The purpose of this paper is to simulate the environmental cost reports preparation used to measure environmental performance in realizing eco-efficiency.
This research uses a descriptive case study by using environmental cost detail data from 2011, 2012, 2013 and 2014. The research object is PT Industri Kereta Api (Persero) located in Madiun, East Java.
The result of the research shows that PT INKA (Persero) has not specifically made environmental cost report. It is found that the percentage of total environmental cost to operational cost tends to increase; the cost which gives the biggest distribution of total environmental cost is the prevention cost. By 2014, the effect of environmental costs on operating costs tended to decrease and during 2012–2014 PT INKA successfully maintained the blue star PROPER and the absence of environmental pollution reports.
PT INKA’s environmental performance is still well controlled and since its inception in 2014 PT INKA has succeeded in realizing the concept of eco-efficiency.
Introduction
Environmental issues arise because of the interaction between economic and environment activities. The higher the intensity, the higher the impact on environment degradation (Idris, 2012). Therefore, environment issues have been a serious problem to be monitored and need a precautionary action from stakeholders. Environmental accounting or green accounting depicts an effort to combine the cost and benefit of environmental activities in economic decision making. The purpose of environmental accounting is to escalate the efficiency of environmental management in order to assess environment activities from the environmental cost and the economic benefit (Putri and Wardiha, 2013; in Moedjarnako and Frisko, 2013). To overcome the damage to the environment, the State Minister of Environment regulation Number 03 Year 2014 had ranked the firms’ environment performance through a program named Program for Pollution Control, Evaluation and Rating or PROPER.
PT INKA is a government-owned company that produces trains, carts and bogie. In its production process, PT INKA produces much waste which potentially contaminates the surrounding environment. Those wastes can be divided into three parts: solid waste (scrap, gram, wood, GFRP – glass fiber reinforced product), liquid waste (used engine oil, travomator oil) and air pollution. During 2002–2004, PT INKA has succeeded to maintain the blue star from PROPER assessment. There are some costs to maintain the blue star in order to keep environmental sustainability. PT INKA, however, has not reported those environmental expenditures. Actually, environmental expenditures have been combined with other expenses. Hence, it makes PT INKA unable to identify precisely what kinds of activities are related to environmental prevention expenditures. Therefore, PT INKA needs to provide an environmental cost report as an accountability report to stakeholders and as a tool in managerial decision making. This research uses a descriptive case study method to try to simulate and provide an environmental cost report separately from the existing one.
Literature review
Environmental impact analysis (AMDAL)
Based on the Act Number 32 Year 2009 for Protection and Environment Management, environment is a unit of all of objects, power, circumstances and mortals, including human beings and their behavior which influences the nature, continuity of life and human welfare and any other mortals. According to the Government Regulation Number 27 Year 1999, the environmental impact analysis (AMDAL) is a study to calculate the environmental impact resulting from business decision making. Every new business in Indonesia must commence with this AMDAL analysis concerning hazardous wastes (B3). Based on this regulation, businesses which produce hazardous waste must supervise and manage such wastes (Badar, 2006, p. 40). AMDAL has some benefits, such as:
planning tool and business management as well as regional development;
helping decision maker in environmental feasibility test from business or activity plan;
giving feedback to detailed technical designs from business or activity plan;
giving feedback to supervision and management plans from business or activity plans; and
giving information to public about the impact of business or activity plans.
Environmental accounting
Environmental accounting is defined as a precaution, mitigation and or avoidance of environment impact, moving from some chances, start from repairs of events which caused disasters based on those events (Ikhsan, 2008, p. 14). Environmental accounting requires company awareness about potential environment problems resulting from the company’s operation, such as, production of waste and air pollution. Companies are responsible for overcoming waste problems by having company operational waste management which needs a special cost budget. Therefore, companies need to record environmental costs in their financial reports.
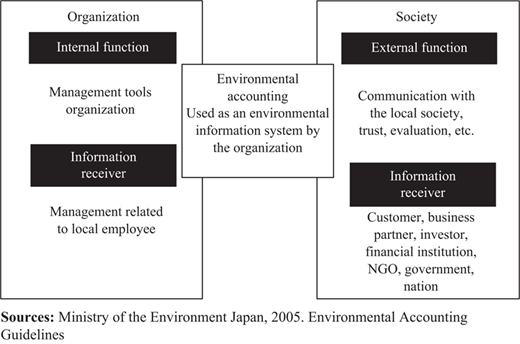
Companies have some advantages when they do environmental accounting, such as reducing expenditure by identifying and analyzing hidden costs. Environmental accounting provides important information related to additional costs from environmental issues by rechecking product costs and specific processes that may be hidden in overhead costs, so it can be used to make decisions. Environmental accounting may increase companies’ economic by increasing business performance. The increase of both economy and environment performance continually will affect not only customer satisfaction, but also investor satisfaction and regulation requirements (Figure 1).
Eco-efficiency
Eco-efficiency stands for ecology and efficiency. This term was first introduced by the World Business Council for Sustainable Development (WBCSD) in 1992. WBCSD defines eco-efficiency as “creating more goods and services with ever less use of resources, waste, and pollution” (Lehni and Pepper, 2000). By implementing eco-efficiency concepts, the companies will not merely emphasize profit from resulting products and services, but also profit from the impact of ecology by minimizing utilization of resources in production processes and lessening waste and pollution. Eco-efficiency implicates that increasing efficiency commences from environmental performance improvement. Eco-efficiency relates to the company activities in producing goods or services in an environmentally friendly manner, simultaneously reducing the negative impact on the environment, and reducing the resources’ consumption. In the developed countries in which the level of environmental concern has been relatively high, eco-efficiency is an emerging phenomenon. Physical and social environmental awareness is very strong at all levels because it will affect the performance of the company in the future.
Research method
The research method used is a descriptive case study in PT Industri Kereta Api (Persero) which operates in train production and train overhaul. The research scope is limited only in identifying and classifying environmental costs based on activities, environmental statement processes and how environmental performance can be assessed by environmental cost and the company’s environmental condition.
Data resources collected are:
Documents: audited financial statements of PT INKA years 2011–2014, budget realizations of K3LH Department years 2011–2014.
Archive records: organization structure, PT INKA’s map, procedure of hazardous waste management, procedure of spilling hazardous waste handling, laboratory test result of waste, etc.
Interviews: researcher performs direct interview with K3LH Department officers.
Direct observations: in order to obtain information on type of waste produced by PT INKA, how it is handled and how the production process is conducted. The results of direct observation in the form of photo documentation.
Preliminary survey: at this stage, researchers try to recognize the object of research, procedures and systems contained therein. Therefore, obtained a description of the company in general and specifically what can be used as the basis of input in writing this thesis.
Field study: observation of research objects, documentation in the form of techniques of collecting and recording data obtained from the company related to the formulation of research problems. The data come from the Department of Accountancy and the Department of Environment PT INKA.
In addition, online news is also used to gather news about the PROPER achieved by PT INKA for the period 2011–2014 and environmental pollution resulting from PT INKA.
Identify activities and costs related to environmental management. Classify environmental costs based on four categories of environmental costs: prevention, detection, internal failure and external failure costs.
Prepare an environmental financial statement by combining the classification of environmental costs with the environmental benefits identified and collected. The environmental financial statement is used as the basis for measuring environmental performance by calculating the distribution ratio of each category of environmental costs to total environmental costs then by comparison with environmental benefits as well as changes in environmental cost trends.
Interpret the results of the analysis adjusted to the related theories so that it provides input for management in assessing the eco-efficiency derived from the improvement of environmental performance. Make conclusions on the results of research.
Result and discussion
PT Industri Kereta Api (Persero) Madiun environmental management
Types of waste identified:
solid hazardous waste, such as hazardous contaminated cans (cans, drums, etc., waste from primer painting workshop department), used train batteries, car, forklift, dust ex-sand blasting, cartridge and so forth; and
liquid hazardous waste, such as used oil and gross oil, and used fuel.
The procedures for handling waste, especially hazardous waste, adopted by PT INKA (Persero) are as follows:
Segregation of waste.
Hazardous waste is sorted according to the type of waste and disposed in the trash as follows:
Waste is stored in the garbage such as for cotton waste in contaminated gloves.
Waste is saved in bins, such as used lubricating oil, used diesel, used kerosene, used oil coolant, used oil, used thinner, ex-sand blasting, ex-sand blasting dust and used resin (see Table II).
Waste saved on the premises, such as contaminated cans, plasma cutting and gas cutting and glass fiber waste (see Table III).
Cartridge waste, used TL lamps, used batteries, ex contaminated drums, expired materials can be directly transported to waste temporary storage.
Temporary storage of hazardous and toxic (B3) waste at a special location called B3 TPS:
The Environment Unit is responsible for the recording, preparing and reporting the waste balance sheet to the relevant agency.
Hazardous waste shall be recorded in logbook; for every three months B3 shall be reported to the Ministry of Environment, Environment Agency of East Java Province, and Madiun City Environmental Office. This type of waste is stored for up to 90 days.
Logistics Manager 1 is responsible for the disposal of hazardous and toxic (B3) waste materials to third parties in accordance with applicable laws and regulations.
Issues emerging related to environmental management
In December 2011, as a result of PROPER assessment conducted by the Ministry of Environment, PT INKA (Persero) received a black star for environmental management, especially in the management of air emission quality from the grit blasting process. From that assessment, PT INKA (Persero) received a sanction in the form of announcement to public and dismissal of credit by bank for its reputation. In 2013, PT INKA had been routinely tested for one-time chimney emissions and air analysis conducted twice a year. Wastewater testing has been routinely conducted since 2012, which is conducted annually four times a year.
Classifying and identifying environmental costs
Environmental costs incurred are recorded as an expense of the K3LH Department and classified as administrative and general expenses in the income statement of the company. Such expenses include: employee expenses; general expenses; service charges; taxes, fees and levies; depreciation and amortization expense; maintenance expenses; education and training expenses; and research and development expenses.
PT INKA (Persero) has not made a specific environmental cost report. Costs associated with environmental costs are accounted for under administrative and general expenses. The environmental costs consisted of the following:
Cost of nuisance permit: these costs incurred to protect residents in the area around the plant who are affected by the disruption of factory activity, such as noise, vibration, smell and emissions. The Interference License permit is submitted to local government of Madiun and extended annually.
Coordination fee with environmental division team: these costs incurred in coordination with the team from the Madiun City Department of the Environment.
Facility maintenance fees: these costs are non-routine and are used to maintain facilities and equipment in the management of hazardous and toxic waste, such as, the maintenance of powder trolleys, purchase of plastic bags for waste, septic tank construction, maintenance of material warehouse and so on.
Cost of treatment of oil waste: oil waste treatment cost is for waste process management by PT Logam Jaya Abadi. The resulting oil waste is processed to change the characteristics and composition to eliminate or reduce the toxicity.
Cost of handling B3 waste: these costs incurred in the process of transportation and disposal of B3 waste by third parties, PT Logam Jaya Abadi.
Cost of wastewater test: this cost is to monitor the quality of wastewater (effluent) of the company’s activities in order to avoid environmental pollution. This domestic wastewater test is conducted by Environmental Laboratory of Perum Jasa Tirta I.
Cost of air analysis and stack emissions: the costs of air analysis and stack emissions are issued in order to fulfill the data of quality standard, performance evaluation of pollution control equipment, research and so on. Tests for air analysis and stack emissions were conducted by PT Envilab Indonesia.
PROPER audit fee: these costs are expended as expenditure for the company’s performance assessment of its environmental management by the Ministry of Environment. This audit aims to check whether the management, control and environmental monitoring contained in PT INKA (Persero) are appropriate for rating.
Cleaning and maintaining protected forest: these costs are incurred for clearance and maintenance of the protected forest located within the plant area. This forest serves to absorb emissions released by mills and dust particles from grid blasting and pigmentation processes.
Officer’s salary fee 5R: this fee is incurred for the welfare of the 5R officers. This officer position was established in 2014, who was responsible for overseeing the production process in order to avoid waste and maintain or add 5R signs that are considered less.
Employee education and training costs: this fee is incurred for the education and training of K3LH Department employees. Programs followed such as environmental socialization, guidance and environmental monitoring and so on.
Table I shows environmental costs of PT INKA (Persero) compared to Hansen and Mowen’s standard.
Meanwhile, the total of issued environmental costs by PT INKA is indicated in Table II.
The environmental cost reports at PT INKA (Persero) in 2011, 2012, 2013 and 2014 are shown in Tables III–VI.
Relative distribution pattern of environmental cost at PT INKA (Persero)
Having simulated the environmental cost report at PT INKA (Persero), it is necessary to create a relative distribution pattern of environmental costs. The goal is to determine the environmental improvements that need to be emphasized. The relative distribution pattern of environmental costs is measured by the total cost of each activity divided by the total operational costs as shown in Table VII.
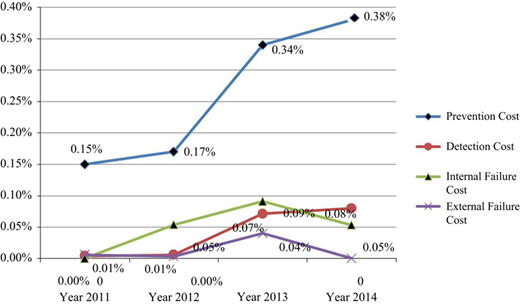
If the environmental cost trend diagram is broken down into categories, then the environmental cost trend diagram per category will be obtained. The environmental cost per category trend diagram is useful in monitoring and controlling environmental costs seen by the type of environmental activity. The trend diagram of the per-environment environmental costs can be seen in Figure 2.
Figure 2 shows the increase or decrease of environmental cost per category to the operational cost of the company. It shows that prevention costs increased from 2011 to 2014. Prevention costs of 0.15 percent in 2011 then moved up to 0.17 percent in 2012, then in 2013 to 0.34 percent and by 2014 0.38 percent. The increase in prevention activities was due to improvements in prevention activities, such as facility maintenance activities, procurement of self-protective equipment, refilling of APAR tubes and the establishment of a 5R team that served as a supervisory team in 2014.
The detection activity also moved up from 2011 to 2014; in 2011 to 0.004 percent, in 2012 to 0.006 percent, in 2013 to 0.071 percent and by 2014 to 0.08 percent. This was due to the activities undertaken on the recommendation of the 2011 PROPER results such as domestic wastewater test as well as chimney and ambient air emissions test.
In addition, activity in internal failure and external failure indicated fluctuating movement. Internal failure events in 2011 amounted to 0 percent, in 2012 0.054 percent, in 2013 0.091 percent and in 2014 to 0.053 percent. The increases that occurred between the years 2011 and 2013 were due to B3 waste management activities that originally in 2011 had no cooperation with third parties in the management of B3 waste, but starting in 2012 had been in cooperation with third parties in the management of B3 waste. In the year 2014 the internal failure activity tended to decrease because B3 waste was produced less than the previous year.
The external failure activity in 2011 showed the percentage of 0.006 percent, the year 2012 by 0.003 percent, the year 2013 by 0.04 percent and the year 2014 about 0 percent. The decline occurring in 2014 was due to the absence of protected forest conservation activities. It showed that environmental management activities conducted by PT INKA (Persero) had been running quite optimally.
Linkage of environmental performance in achieving eco-efficiency
In terms of environment, PT INKA (Persero) has regularly tested the waste generated. It aims to control a good quality standard and prevent the occurrence of environmental pollution. In addition, PT INKA (Persero) also conducts an audit of the company’s environmental performance by the Ministry of Environment commonly referred to as PROPER. Thus, PT INKA (Persero) has been able to apply eco-efficiency concepts that are ecologically or environmentally sound and can produce goods and services while reducing negative environmental impacts.
Some limitations of this research are:
The researcher did not obtain the recommendation of PROPER 2011 assessment from PT INKA (Persero). Researchers used recommendations from internet sources.
The researcher did not obtain the environmental benefit data obtained from the savings activities in the production process and recycling the waste generated, so that the environmental benefits obtained by the company could not be calculated.
Conclusion
PT INKA (Persero) has not specifically prepared an environmental cost report. From the results of the preparation of the environmental cost report, it is found that the combination of prevention activity and detection activity had greater value and percentage compared with the combination of internal failure activity and external failure. Therefore, it can be concluded that the company provides more investment in prevention and detection activities so that the wastes generated do not pollute the internal and external environments.
In previous years the proportion of environmental costs to total operational costs continued to increase from 2011 to 2013. This was caused by the recommendation of PROPER result in 2011 that management of B3 waste be handed over to the third party. Ecological or environmental efficiency can be seen from the absence of environmental pollution and its impact caused by management of waste. Finally, it can be said that the concept of eco-efficiency has been met by PT INKA (Persero) started in 2014.