


The COVID-19 pandemic has changed education ideology across the globe. The education system has drastically shifted from traditional ways of teaching toward online teaching mechanism. This study aims to conduct an analysis of factors influencing the adoption of the e-teaching methodology of learning by students amidst the present pandemic crisis.
The study is based on primary data and a survey was conducted using a semi-structured questionnaire with a sample size of 216 respondents from various universities in India. Cronbach’s alpha and Pearson correlation, the goodness of fit, ANOVA and multiple linear regression analysis was applied.
Furthermore, the results obtained stated that attitude and usefulness proved to be statistically significant as the two variables contribute a statistically significant number of predictions to the practice of adoption of the e-teaching methodology by students. Additionally, it was found out that students there is a strong requirement from the institute and teachers’ part to motivate the students to take interest in e-teaching and students should be given an opportunity to develop a sense of empowerment so, that they can feel comfortable and can discuss their query’s confident during the e-classes.
This study was completed within a time constraint. So, the sample size is small i.e. 216 and variables, which influence the adoption of the e-teaching methodology of learning by students are not exhaustive. There might be many other variables, which are still unexplored and should have been part of this study.
This study will be beneficial for the education sector to better understand the impact of e-teaching methodologies on the learning and development of students in a more practical way.
The study adds value to the literature in the domain of online teaching and the level of e-learning from students’ perspectives in the era of this new pandemic crisis. Then, will be beneficial for not only the students but also will help the institution and teachers to understand the mindset of the students in detail and can improve the way knowledge is delivered to the students by the means of e-classes in a sustainable way.
1. Introduction
At the moment, information and communication technology (ICT) has altered higher education in a considerable way. Specifically, usage of cutting-edge education modernizations such as tablets, smartphones, PDA’s with the wideband network to web and social media have carried substantial variations to the way advanced education institutes, colleges and universities deliver learning opportunities to students. Learning and teaching by the practice of internet-based applications, mobile apps and various social media platforms, have ended up making it quick and casual equally for students and as well as teachers in today’s hectic life practices. Dynamic info and communiqué know-hows have transacted old-style pedagogics and teaching tactics with the digital uprising in the education segment by inspiring collaborative learning and teaching newness like other sectors operating in the digital domain.
In recent times, almost each and every educational institution are anticipated to produce knowledge prospects self-regulating ones, to bid effortlessly reachable knowledge environments and interactive communication openings. Consequently, advanced education institutions advance approaches to encounter these potentials through teaching strategies such as e-learning, by means of teaching technologies. These new-fangled technology-based teaching strategies are primarily molded by decision-makers in the education system. Current education has progressively circumvented the place and time confines of old-style teaching methodologies. Distance education as a means of a new way of teaching and learning has engrossed rising consideration and repute among students because of its widespread bid in an arrangement of education turfs. Meanwhile, information technology has seen a drastic evolution, countless online teaching and learning platforms have appeared. Still, due to the absence of efficacy, many online teaching domains ended up being unproductive.
The COVID-19 pandemic has changed education ideology in terms of the following:
The COVID-19 has caused schools, colleges to shut down their operations all across the globe.
As a consequence, education methodologies have altered melodramatically, with the typical intensification of e-learning.
Studies recommend that online teaching and learning has been discovered to surge conservation of data further, symbolizing the unconventionalitiesCovid-19 have activated might continue for a longer period of time.
This study aims to explore and analyze the factors which influence the adoption of the e-teaching methodology by students in India.
2. Review of literature
Keskin and Yurdugül (2019) investigated and analyzed the individual factors that move learners’ approach to teaching and learning delivery preferences. The optimal scaling analysis technique was applied to the data. It was found out that there is an association between the preferences of the learning atmosphere and the constructs of e-learning motivation, self-efficacy and task value. Chen and Huang (2018) studied the influential factors of network teaching. Structural equation modeling methodology was used for the analysis. It was depicted that there are dissimilar persuasive aspects for learners who prefer diverse learning styles. Notwithstanding the learning flairs of students and the influence of utility value on web-based teaching, there is a superior affiliation that happens amid the task of learning and the prospects of the work at present and future time periods. Kauffman (2015) examined the negative perceptions that can lead to unfavorable learning outcomes including decreased motivation and persistence. An in-depth review of the literature was carried out. It was highlighted that the student is responsible for rereading course/study material, captivating exams at programmed intervals, etc., which necessitates acceptable self-directive skills. Nguyen (2015) scrutinized the evidence of the effectiveness of online learning by establishing and briefing the results and tests of online learning into optimistic, undesirable, assorted and worthless findings. An in-depth review of the literature was conducted. It was concluded that there is sturdy suggestion to recommend that online learning is at the slightest as operative as the traditional arrangement, but the indication is, by no means, convincing. Cakir (2014) enquired about the relationship between online students’ satisfaction and their demographic characteristics. Data was analyzed by applying the T-test and Kruskal-Wallis H test. It was found out that although online students’ gratification levels did not meaningfully fluctuate in terms of age, computer literateness levels and internet user-friendliness but, it expressively differs in terms of internet practice. Gamage et al. (2014) attempted to identify the factors affecting e-learning as per the view of the participants or the students. Ground theory and Quantitative analysis methods of Principle Component Analysis were used to process data. It was depicted that attempted to identify the factors affecting the eLearning as per the view of the participants or the students. Qteishat and Qteishat (2013) inspected the factors contributory to various perceptions and attitudes in the direction of E-Learning in advanced education institutions among the scholars in Jordan. Data was analyzed using Factor analysis and confirmatory factor analysis but, to test the model of the research the partial least square method was used. Further, stepwise regression analysis was applied for testing the research study’s hypotheses. It was demonstrated that the importance of perceptions of usefulness and ease of use, the perception of support for ICT and the prior ICT experience of students for attitudes toward E-Learning.
3. Research gaps
As a research realm, the topic of e-teaching and e-learning is a multifaceted and complex one to comprehend. It comprises an immense assortment of research themes, ones which emphasize high-tech substructures to those with widespread socio-cultural inferences. For example, if we investigate the employment of a certain type of technology in any given establishment, the managers of the pertinent institution have to do decision-making regarding by what means the acceptance of this technology will be supported and will be preserved in times to come. From the outlook of teaching method, the approval of the technology necessitates the importance of varying characters of teachers and learners via the new-fangled technology, the establishment of suitable supportive systems and the rearrangement of the learning atmosphere. The implementation of any pioneering know-how also has far-off consequences for the related public tangled in the institute or it can be referred to as the extensive communal population neighboring it.
In the light of the situation of this current pandemic crisis i.e. COVID-19 almost all educational institutes operating in India has shifted their way of teaching from the traditional classroom classes to online one to safeguard the health and well-being students and teachers. This study is a pilot study and focuses on the students of Various Universities of India and an attempt has been made to analyze various factors, which influence the way e-teaching is done and its adoption by students. Furthermore, not many studies have been conducted with reference to India. So, this study although being the pilot one will try to bridge this gap and will seek to explore more factors, which affect the successful adoption of e-learning methodology by students in times to come.
4. Objectives of the study
To inspect the influence of perception on the adoption of the e-teaching methodology by students.
To inspect the influence of motivation on the adoption of the e-teaching methodology by students.
To inspect the influence of attitude on the adoption of the e-teaching methodology by students.
To inspect the influence of empowerment on the adoption of the e-teaching methodology by students.
To inspect the influence of usefulness on the adoption of the e-teaching methodology by students.
5. Hypotheses of the study
Perception influences the adoption of the e-teaching methodology by students.
Motivation influences the adoption of the e-teaching methodology by students.
Attitude influences the adoption of the e-teaching methodology by students.
Empowerment influences the adoption of the e-teaching methodology by students.
Usefulness influences the adoption of the e-teaching methodology by students.
6. Data methodology
6.1 Research design
6.1.1 Data collection and data instrument.
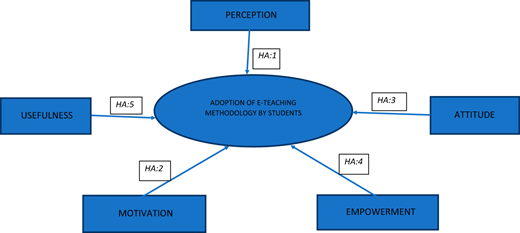
The study is a pilot one and mainly focuses on the primary data for which a semi-structured online survey consisting of five factors consisting i.e. perception, motivation, attitude, empowerment, usefulness and adoption of e-teaching by students is formulated using Google docs (Figure 1).
6.2 Method of collection of samples
Questionnaire pretesting is a comparatively uncomplicated, economical method for spotting problems with a questionnaire. It entails a minute study to settle on how a questionnaire can be enhanced to curtail reply errors, like respondent misunderstanding a question (Converse and Presser, 1986). To accumulate data and to pre-test, the items of the questionnaire a Sample size of 216 respondents from various universities is being taken, namely: University of Delhi, Banaras Hindu University and IGNOU the basis of convenience sampling method and an Electronic Questionnaire was being circulated to them.
6.3 Tools and techniques
To test the hypotheses and to achieve the objectives, hence reliability out for the same. Cronbach’s alpha is being used which determines the internal consistency of items in a survey instrument to estimate its reliability. Further, the data is analyzed using Pearson Correlation, Goodness of fit, Anova and Multiple Linear Regression Analysis- Standard Method.
6.4 Analysis
It can be seen from Table A1 that Cronbach’s alpha is 0.722, which indicates a good level of internal consistency for the questionnaire. Table A2 presents the value that Cronbach’s alpha would be if that particular item was removed from the scale. We can see that elimination of any item would result in a bit lower Cronbach’s alpha. Therefore, it will be desirable not to remove any of the above items. Table A3 shows Descriptive statistics (means and standard deviations) for the Six items (Five predictors and one dependent variable).
Item-total statistics
| Scale mean if item deleted | Scale variance if item deleted | Corrected item-total correlation | Cronbach’s alpha if item deleted | |
|---|---|---|---|---|
| Perception | 12.28 | 13.067 | 0.419 | 0.696 |
| Motivation | 12.83 | 13.172 | 0.470 | 0.680 |
| Attitude | 12.57 | 12.135 | 0.657 | 0.626 |
| Empowerment | 12.56 | 11.718 | 0.642 | 0.624 |
| Usefulness | 12.15 | 13.665 | 0.332 | 0.720 |
| Adoption of e-teaching | 12.82 | 14.604 | 0.258 | 0.722 |
Descriptive statistics
| Mean | SD | n | |
|---|---|---|---|
| Adoption of e-teaching | 2.22 | 1.059 | 216 |
| Perception | 2.76 | 1.139 | 216 |
| Motivation | 2.21 | 1.042 | 216 |
| Attitude | 2.47 | 1.016 | 216 |
| Empowerment | 2.49 | 1.108 | 216 |
| Usefulness | 2.89 | 1.152 | 216 |
After the successful reliability test, we applied the (Pearson Correlation, Goodness of Fit Test and regression analysis).
Table A4 shows the square correlation matrix. Pearson correlations are shown in the first major row of the correlations table and their corresponding probability levels are shown in the second major row. Attitude and usefulness are decently correlated with the dependent variable of adoption of the e-teaching methodology by students than other variables (0.252 and 0.226) and the rest of the predictors (perception, motivation and empowerment) are weakly correlated with the dependent variable with values of (0.148, 0.173 and 0.110), respectively. Within the set of predictors empowerment and attitude and (empowerment and motivation) are more highly correlated with a value of (0.651 and 0.552), respectively, than the other pairs.
Correlations
| Adoption of e-teaching | Perception | Motivation | Attitude | Empowerment | Usefulness | |
|---|---|---|---|---|---|---|
| Pearson Correlation | ||||||
| Adoption of e-teaching | 1.000 | 0.148 | 0.173 | 0.252 | 0.110 | 0.226 |
| Perception | 0.148 | 1.000 | 0.265 | 0.374 | 0.489 | 0.139 |
| Motivation | 0.173 | 0.265 | 1.000 | 0.421 | 0.552 | 0.159 |
| Attitude | 0.252 | 0.374 | 0.421 | 1.000 | 0.651 | 0.379 |
| Empowerment | 0.110 | 0.489 | 0.552 | 0.651 | 1.000 | 0.250 |
| Usefulness | 0.226 | 0.139 | 0.159 | 0.379 | 0.250 | 1.000 |
| Sig. (one-tailed) | ||||||
| Adoption of e-teaching | . | 0.015 | 0.006 | 0.000 | 0.054 | 0.000 |
| Perception | 0.015 | . | 0.000 | 0.000 | 0.000 | 0.020 |
| Motivation | 0.006 | 0.000 | . | 0.000 | 0.000 | 0.010 |
| Attitude | 0.000 | 0.000 | 0.000 | . | 0.000 | 0.000 |
| Empowerment | 0.054 | 0.000 | 0.000 | 0.000 | . | 0.000 |
| Usefulness | 0.000 | 0.020 | 0.010 | 0.000 | 0.000 | . |
| n | ||||||
| Adoption of e-teaching | 216 | 216 | 216 | 216 | 216 | 216 |
| Perception | 216 | 216 | 216 | 216 | 216 | 216 |
| Motivation | 216 | 216 | 216 | 216 | 216 | 216 |
| Attitude | 216 | 216 | 216 | 216 | 216 | 216 |
| Empowerment | 216 | 216 | 216 | 216 | 216 | 216 |
| Usefulness | 216 | 216 | 216 | 216 | 216 | 216 |
Table A5 shows the result of testing the fit of the model. In the model summary table, it can be seen that the multiple correlations (R) are 0.331, with a corresponding value of R square of 0.110, suggesting that 11% of the variance of adoption of the e-teaching methodology by students is explained by a set of predictors. R square change is also 0.110. The adjusted R square value is 0.088 and represents some R square shrinkage as a result of including only five predictors in the model.
Model summary
| Model | R | R2 | Adjusted R2 | Std. error of the estimate | Change statistics | ||||
|---|---|---|---|---|---|---|---|---|---|
| R2 change | F change | df1 | df2 | Sig. F change | |||||
| 1 | 0.331a | 0.110 | 0.088 | 1.012 | 0.110 | 5.167 | 5 | 210 | 0.000 |
Note:
aPredictors: (constant), usefulness, perception, motivation, attitude and empowerment
Table A6 the ANOVA table provides a test of the statistical significance of the regression model. The regression model has five degrees of freedom because that is the number of predictors in the model. The total degrees of freedom is: N − 1 i.e. 216 − 1 = 215, leaving 210 degrees of freedom for the error term. The model accounts for a significant amount of dependent variable variance, F(1, 210) = 5.167, p < 0.001. The eta square value (it measures the proportion of the total variance in a dependent variable which is associated with groups defined by an independent variable) is equal to regression variance divided by total variance, which is 26.437/241.333 = 0.10954 i.e. (0.110 approximately) which is the same value as R square reason being ANOVA and linear regression are simply different expressions of the general linear model.
ANOVAa
| Model | Sum of squares | df | Mean square | F | Sig. |
|---|---|---|---|---|---|
| 1 | |||||
| Regression | 26.437 | 5 | 5.287 | 5.167 | 0.000b |
| Residual | 214.896 | 210 | 1.023 | ||
| Total | 241.333 | 215 | |||
Notes:
aDependent variable: adoption of e-teaching.
bPredictors: (constant), usefulness, perception, motivation, attitude and empowerment
Table A7 shows the coefficients for the variables in the regression model. The three columns on the extreme right show correlations under the heading zero-order, partial and part, respectively. The column to the very left displays information about regression coefficients.
Coefficientsa
| Model | Unstandardized coefficients | Standardized coefficients | t | Sig. | Correlations | |||
|---|---|---|---|---|---|---|---|---|
| B | Std. error | Beta | Zero-order | Partial | Part | |||
| 1 | ||||||||
| (Constant) | 1.131 | 0.254 | 4.453 | 0.000 | ||||
| Perception | 0.097 | 0.070 | 0.104 | 1.391 | 0.166 | 0.148 | 0.096 | 0.091 |
| Motivation | 0.139 | 0.080 | 0.137 | 1.748 | 0.082 | 0.173 | 0.120 | 0.114 |
| Attitude | 0.241 | 0.094 | 0.231 | 2.557 | 0.011 | 0.252 | 0.174 | 0.166 |
| Empowerment | −0.197 | 0.095 | −0.206 | −2.076 | 0.039 | 0.110 | −0.142 | −0.135 |
| Usefulness | 0.141 | 0.065 | 0.154 | 2.185 | 0.030 | 0.226 | 0.149 | 0.142 |
Note:
aDependent variable: adoption of e-teaching
Only the three predictor variables are statistically significant (p < 0.05) in this model i.e. attitude, empowerment and usefulness. Then, out of three statistically significant predictor’s only attitude and usefulness has the highest correlation with the adoption of the e-teaching methodology by students. This can also be seen from relative values of unstandardized and standardized (beta) coefficients associated with these two variables’ (0.241 and 0.231) and (0.141 and 0.154), respectively.
7. Discussion and conclusions
The study is a pilot one and started from scratch from the development of a questionnaire and its circulation to respondents with an aim of pretesting it to check its reliability and validity. In the light of results achieved after reliability analysis and Regression and correlation analysis, it can be seen that the items of the questionnaire showed up a good score on reliability part and furthermore, two items i.e. attitude and usefulness proved to be statistically significant too after Regression and Correlation analysis. Both the items are decently correlated to the adoption of E-teaching methodology by students. Hence, Accepting the third and fifth hypotheses (HA: 3 and HA: 5) and rejecting the rest hypotheses (HA: 1, HA: 2 and HA: 4). Additionally, it was found out that students there is a strong requirement from the institute and teachers’ part to motivate the students to take interest in e-teaching and students should be given an opportunity to develop a sense of empowerment so, that they can feel comfortable and can discuss their query’s confident during the e-classes. This will also change their current perception into a positive one which will be beneficial for not only the students but also, will help the institution and teachers to understand the mindset of the students in detail and can improve the way knowledge is delivered to the students by the means of e-classes in a sustainable way.
8. Limitations and future implications
This study was completed within a time constraint. So, the sample size is small i.e. 216. Then, out of 216 (138 students were from the University of Delhi, 49 from IGNOU and the rest 29 from BHU). The variables which influence the adoption of the e-teaching methodology of learning by students are not exhaustive. There might be many other variables, which are still unexplored and should have been part of this study. Not too many studies were available for an in-depth review of the literature. After analyzing the responses of the students, it was realized that the respondents showed less interest level while filling up the questionnaire. In terms of repetitive responses on a scale of 0 to 5.Hence, the study aims to move further by exploring more variables and increasing the sample size for conducting sustainable research. When completed, this study will be beneficial for the education sector to better understand the impact of e-teaching methodologies on the learning and development of students in a more practical way.
This paper forms part of a special section “Global financial and business environment (ICGFBE 2020)”, guest edited by Rakesh Gupta and Anurag Agnihotri.

