


In the context of escalating climate change and environmental challenges, sustainability in logistics has become a global priority. This study aims to examine the determinants of green logistics adoption among small- and medium-sized enterprises (SMEs) in Vietnam, a key driver of the national economy.
This research integrates the technology–organization–environment (TOE) framework, diffusion of innovation (DOI) theory and Thong’s model (1999) to develop a comprehensive analytical framework. Factors are categorized into four dimensions: technological, organizational, environmental and individual. Data were collected from 202 Vietnamese SMEs across multiple sectors and analyzed using partial least squares structural equation modeling.
The results indicate that human capital quality, organizational support, firm size, slack resources, competitive pressure, customer pressure, regulatory pressure, government support, social responsibility pressure, relative advantage, compatibility, CEO innovativeness and CEO knowledge of green logistics positively influence the adoption of green logistics. Conversely, complexity (CPL) and adoption cost have negative effects.
The study provides actionable insights for SME managers, entrepreneurs and policymakers to promote green logistics adoption, particularly through enhancing organizational capabilities, strengthening institutional support and reducing perceived barriers such as cost and CPL.
This research contributes to the literature by integrating multiple theoretical perspectives (TOE, DOI and Thong’s model) to explain green logistics adoption in an emerging economy context, with a specific focus on SMEs in Vietnam.
1. Introduction
In the context of globalization, the increasing emphasis on sustainable development and green standards has put pressure on Vietnamese firms, particularly small and medium-sized enterprises (SMEs), to adopt environment-friendly practices. This is necessary to maintain competitive advantage, meet international market requirements and satisfy eco-friendly demands of major partners from developed economies such as the US, the European Union and Singapore. Additionally, domestic environmental concerns in Vietnam, coupled with a shift in consumer behavior toward green products, have further intensified the need for SMEs to embrace green solutions.
It is noteworthy that, in addition to the manufacturing industry, the logistics sector also contributes significantly to environmental deterioration. According to the World Bank (2019) in Vietnam, over 30 million tons of CO2 are released annually from transportation activities, of which 85% came from road transportation (Khanh, 2019). As a result, Vietnamese enterprises should be urgently adopting green logistics practices to mitigate the increasingly harmful effects on the environment.
However, the level of green logistics adoption among Vietnamese SMEs has been relatively limited due to their lack of expertise, experience and resources. and several studies have been conducted to support SMEs in Vietnam overcome these obstacles.
Although there is plentiful research on green logistics in Vietnam, most are qualitative studies focusing on the current situation, challenges and recommendations for SMEs to implement green logistics (Do, 2024; Nguyen, 2024; Pham, 2023; Doan, 2024). With regards to the quantitative studies, the majority have aimed to explore the influence of specific individual factors on green logistics adoption (Ngo, 2022; Chowdhury et al., 2022) or end at the stage of proposing a theoretical model without empirical testing (Nguyen, 2023). However, Nguyen et al. (2023) made a notable advancement by applying the technology–organization–environment (TOE) framework and conducting empirical analysis using the Smart-PLS tool and identified key factors such as organizational encouragement, government support (GS), human resource quality, technology accumulation and environmental uncertainty. While this study provided a more systematic understanding, it focused primarily on logistics service providers rather than SMEs. Similarly, Le et al. (2021) examined green innovation adoption through factors such as R&D expenditure, networking and CEO characteristics, emphasizing their importance; nonetheless this study was limited to specific organizational and environmental dimensions without a comprehensive framework. As a result, there has been a significant gap in the literature in the lack of comprehensive, quantitative studies that address the multi-dimensional determinants of green logistics adoption among SMEs in Vietnam.
To address this gap, this study explicitly contributes to the literature by empirically testing a multi-faceted model that integrates the TOE framework, diffusion of innovation (DOI) theory and Thong’s model (1999). While the TOE framework has been widely applied in international studies, there is a notable lack of research in Vietnam utilizing this framework to explore green logistics adoption, particularly among SMEs. This comprehensive approach offers a fresh perspective on the determinants influencing SMEs’ adoption of green logistics, and this study will employ the TOE framework, DOI theory and Thong’s model (1999) to explore the determinants of green logistics adoption among Vietnamese SMEs. In addition to the factors explored in previous studies, the current research will include social responsibility pressure (SRP) as a new variable that requires further testing. Although this factor has been recognized in international studies (Thomas et al., 2021; Youngswaing et al., 2024), it has not been thoroughly investigated within the Vietnamese context. Given the growing public focus on environmental issues, SRP has become an important driver for SMEs in Vietnam to implement green logistics solutions. These contributions aim to provide a deeper understanding of the challenges and drivers faced by Vietnamese SMEs, paving the way for more targeted strategies to foster sustainable practices in the logistics sector. The findings of this study will offer valuable insights for SME managers and policymakers, helping to overcome adoption barriers and contribute to sustainable economic and environmental development in Vietnam.
The study is organized into seven sections as follows: Section 1 presents research introduction and objectives; Section 2 describes the green logistics; Sections 3 and 4 discuss research hypothesis and models; Section 5 outlines the research methodology; empirical findings are reported in Section 6 and finally Section 7 concludes the study by providing implications, limitations and directions for future research.
2. Green logistics
In the 1980s, environmental issues such as air pollution and climate change gained widespread attention, leading to the introduction of “green logistics” as the logistics sector was identified to be a major contributor to global greenhouse gas emissions (Piaralal et al., 2015). Presently, there is no universally accepted definition of green logistics but instead numerous interpretations from various perspectives have been proposed for this term. Chang and Qin (2008) defined it as incorporating modern logistics technologies to minimize environmental impact. Seroka-Stolka and Ociepa-Kubicka (2019) further described it as encompassing green practices in supply chain management, including energy-saving measures, green material handling, waste management, packaging and transportation. Sbihi and Eglese (2009) and Seroka-Stolka (2014) emphasized the broader goal of enhancing the sustainability of production and delivery processes. Despite the variety of green logistics term explanations, they all converge on a common goal of reducing logistics activities’ negative environmental effects to achieve sustainable targets. To attain this, a company is expected to employ green logistics through adopting green innovation practices. In other words, green logistics can be regarded as a process of integrating green technical innovation.
3. Research hypothesis
3.1 Organizational context
3.1.1 Quality of human resources
Quality of human resources refers to the competence, learning capabilities and innovation of the employees (Tornatzky and Fleischer, 1990). A lack of skilled labor with expertise in green logistics and the ability to implement it effectively is recognized as a significant barrier discouraging companies from adopting green innovation practices (Thong, 1999; Yoon et al., 2020). According to research by Shaharudin et al. (2018), green logistics implementation is a relatively novel and complicated process that demands substantial changes in existing operations and collaboration between departments. Thus, high-quality employees with strong learning capabilities are essential for green logistics integration success (Lin et al., 2009; Nguyen et al., 2023; Zailani et al., 2014; Jun et al., 2019). Based on this, the author formulates the following hypothesis:
Quality of human resources has a positive impact on green logistics adoption.
3.1.2 Organizational support
Organizational support, especially assistance from top management, refers to the provision of necessary resources and knowledge to employees for the successful implementation of green logistics (Lin and Ho, 2011). Adopting green logistics demands substantial organizational resources, including financial support, human capital, technology, training and cross-departmental cooperation (Gonzalez-Benito and Gonzalez-Benito, 2006). Top management support plays a crucial role in this integration process as through their coordination, guidance and allocation of resources, employees are assured of accessing sufficient resources to implement green logistics effectively (Wang and Lai, 2014). Additionally, rewards and incentives from senior managers also significantly motivate employees to devote more effort to green logistics practices (Nham et al., 2014). Therefore, organizational support is affirmed to be a key determinant of green logistics adoption (Shaharudin et al., 2018; Liu et al., 2024), and accordingly, the following hypothesis is formulated:
Organizational support has a positive impact on green logistics adoption.
3.1.3 Size
According to Hörisch et al. (2014), knowledge and utilization of green management tools are essential for organizations when deciding to implement green innovation practices and are affected by the company size. Numerous previous studies have also supported this finding, indicating that larger firms will have more tendency to pursue green innovation due to stronger financial resources, higher quality human capital, advanced accumulated technological infrastructure and greater capacity to bear the cost and risk of failure (Hao et al., 2020; Wang et al., 2010; Lin and Ho, 2011). More recent empirical evidence reinforces this argument, such as by Chen and Panichakarn (2024), who demonstrated that organizational size significantly influences the adoption of green supply chain innovations as larger firms are better positioned to respond to sustainability pressures and leverage perceived advantages due to superior resource availability and organizational capabilities. As a result, the following hypothesis was formulated:
Organization size has a positive impact on green logistics adoption.
3.1.4 Slack resources
Slack resources (SRs) refer to the surplus resources beyond what is needed to produce a certain output (Nohria and Gulati, 1996), and variations in SRs affect a company’s ability to adopt environmental innovations (Sharma et al., 1999). Lee (2008) found that implementing green innovation requires significant resources, including finance, human capital, time and technology. Companies with substantial SRs can invest in sustainable solutions without financial concerns (Henriques and Sadorsky, 1999), while those with limited resources prioritize core business activities over green innovation. Hence, organizational slack plays a critical enabling role in green innovation by allowing firms to absorb uncertainty, experiment with environment-friendly logistics practices and sustain long-term investments in green technologies (Wan et al., 2023). Therefore, the following hypothesis is proposed:
SR has a positive impact on green logistics adoption.
3.2 Environmental context
3.2.1 Competitor
Institutional theory suggests that companies always face mimetic pressure, where they imitate the innovations of successful competitors to gain similar success and maintain a competitive advantage (Dimaggio and Powell, 1983). This finding can also apply to green logistics adoption as shown in research conducted by Mousa et al. (2024) within the textile industry that confirms competitive pressure from rivals and stakeholders motivates firms to implement green supply chain practices, of which green logistics is a core component, to maintain competitiveness and legitimacy in the market. Cai and Li (2018) indicated that if a company observes its competitors attracting more customers and improving environmental performance by implementing green logistics solutions, it may intend to adopt it as well.
Competitive pressure has a positive impact on green logistics adoption.
3.2.2 Stakeholder
Stakeholders refer to groups or individuals that exert significant influence on the company and vice versa including suppliers, government, customers and social community (Freeman, 2010). According to Sharma and Henriques (2005) and Kim and Lee (2012), stakeholder pressure is a key driving force behind the company’s intention to adopt green logistics practices. Further research indicated that, among stakeholder groups, customer and regulatory pressures are the most crucial determinants (Gonzalez-Benito and Gonzalez-Benito, 2006). Due to increasing public environmental awareness, customers currently expect products to be delivered via environment-friendly solutions (Cai and Li, 2018). Moreover, growing green expectations from customers have been shown to exert a significant positive influence on firms’ adoption of green supply chain and logistics practices (Geng et al., 2024). This demand serves as a powerful impetus for a company to make the decision to integrate green logistics into their operation. In addition to customer pressure, pressure from environmental regulation also plays a similarly pivotal role in the company’s green practice implementation (Weng and Lin, 2011; Lin et al., 2020). Limited resources have made SMEs reluctant to employ green logistics activities; however, strict environmental regulations imposed by government and industry associations could undermine this barrier and improve the rate of adopting green logistics among SMEs (Ali et al., 2020). Chatzoudes et al. (2024) suggest that environmental regulatory pressure significantly drives green logistics adoption by compelling firms to comply with stricter environmental standards, thereby shaping sustainable operational practices and enhancing competitiveness. As a result, this factor is expected to exhibit a positive influence on green logistics utilization, and accordingly the following hypotheses are proposed:
Buyer pressure has a positive impact on green logistics adoption.
Regulatory pressure has a positive impact on green logistics adoption.
3.2.3 GS
In addition to regulations introduced by the government requiring SMEs to apply green logistics, support from authorities also significantly influences the SMEs’ decisions (Ha, 2023; Lee, 2008). Meta-analysis evidence suggests that government incentives and environmental policy instruments positively affect firms’ environmental innovation, thereby facilitating the adoption of green practices in SMEs (Liao and Liu, 2021). Additionally, Jun et al. (2019) argued that if SMEs receive substantial assistance and encouragement from the government, including financial support, tax incentives, training programs and technical support, they will be more likely to utilize green logistics technology as they will alleviate the burden of limited resources when adopting novel technology. Based on this, the following hypothesis has been formulated:
Government’s support has a positive impact on green logistics adoption.
3.2.4 Social responsibility pressure
As stated in the institutional theory, SRP refers to pressure arising from an organization’s duty to meet social expectations, norms and codes of conduct, also known as corporation social responsibility (CSR) to maintain a positive image (Jones, 1999). With growing environmental concerns, companies are increasingly pressured to adopt eco-friendly practices as part of their CSR initiatives, driven by environmental organizations, media and local communities (Benn et al., 2009; Jun et al., 2019). This not only enhances public trust but also provides a competitive advantage in the long term (Youngswaing et al., 2024). Thus, CSR is no longer a voluntary option but has become a critical requirement for companies aiming to enhance their sustainability performance and solidify their market position. Based on this, the following hypothesis has been formulated:
Social responsibility pressure has a positive impact on green logistics adoption.
3.3 Technological context
3.3.1 Relative advantage
According to Rogers (2003), relative advantage (RA) refers to superior benefits that innovation could offer compared to the current solution. Research consistently shows a positive relationship between RA and the adoption of green innovation (Shaharudin et al., 2018; Hwang et al., 2016; Tornatzky and Klein, 1982). Specifically, the greater the benefits of green innovation, such as improved environmental performance, cost savings and enhanced public image, the more likely companies are to adopt it (Lin and Ho, 2011). Hence, the following hypothesis is proposed:
Relative advantage has a positive impact on green logistics adoption.
3.3.2 Complexity
Rogers (2003) defines complexity (CPL) as the challenges adopters face when learning and using new green innovations. High CPL requires more effort from employees and greater resources from a company to integrate the necessary technology (Liu et al., 2024). Due to limited resources, specifically finance and technology, it is understandable that SMEs are hesitant to adopt green technology innovation. As a result, the following hypothesis has been formulated:
Complexity has a negative impact on green logistics adoption.
3.3.3 Compatibility
Compatibility refers to the extent to which green logistics innovation aligns with a company’s existing value, culture, needs and operational system (Lin and Ho, 2011). Yoon et al. (2020) found that companies prefer adopting green innovation compatible with their current technological knowledge, infrastructure and operational processes since this minimizes costs, time and risks. Moreover, research conducted by Tiwari et al. (2023) indicates that firms are more willing to adopt new technologies when they can be integrated smoothly into existing organizational routines and decision processes, as this reduces perceived implementation CPL and uncertainty. Etzion (2007) also noted that better environmental outcomes are achieved when innovations fit with a company’s existing experience. As a result, the following hypothesis is proposed:
Compatibility has a positive impact on green logistics adoption.
3.3.4 Adoption cost
Green logistics involves several solutions such as green warehousing, green transportation, green packaging, reverse logistics and green information management. Because of the necessary equipment needed, the initial investment required for integrating green logistics technology will be substantial, and companies not only incur significant expenses for purchasing and implementing these but also face considerable costs for employee training and ongoing maintenance (Hao et al., 2020). Supporting this argument, empirical evidence from SMEs further indicates that high adoption costs and financial constraints constitute key barriers to the implementation of green logistics and green supply chain practices (Tsikada et al., 2025). Therefore, the AC is often regarded as one of the most significant hindrances in implementing green logistics practices, especially for SMEs with limited financial resources (Park et al., 2018; Henriques and Sadorsky, 1999). Accordingly, the following hypothesis is formulated:
Adoption cost has a negative impact on green logistics adoption.
3.4 Individual context
3.4.1 CEO’s innovativeness
CEO’s innovativeness (CI) refers to a CEO’s willingness to adopt new ideas for the company’s growth (Yoon et al., 2020). In SMEs, green innovation implementation is risky due to limited financial resources and failure could result in significant losses (Ettlie, 1990). Recent evidence shows that CEO’s openness to new ideas significantly promotes firms’ green innovation initiatives (Liu et al., 2025). Hence, a more innovative CEO is more likely to implement innovative solutions, including green logistics (Thong, 1999; Laforet and Tann, 2006). As a result, the following hypothesis is proposed:
CEO’s innovativeness has a positive impact on green logistics adoption.
3.4.2 CEO’s green logistics knowledge
A CEO’s knowledge of green logistics refers to their expertise in implementing the required green technologies (Yoon et al., 2020). In SMEs, a CEO with in-depth knowledge of green logistics is more likely to adopt it, as they can better implement and assess the adoption risks (Thong, 1999; Dewar and Dutton, 1986; Ettlie, 1990). Based on this, the following hypothesis is proposed:
CEO’s green logistics knowledge has a positive impact on green logistics adoption.
4. Research model
The research model for this study is based on the combination of the framework technology–organization–environment (TOE), the theories of DOI, institutional theory and Thong’s model (1999). Green logistics adoption is considered a process of implementing technological innovation, and in this context, Rogers’s diffusion innovation theory (2003) is commonly used in many studies (AlBar and Hoque, 2019; Ali et al., 2020; Li, 2008). The theory explains the stages an innovation has undergone before being adopted by an individual or a group. Rogers (2003) emphasizes five attributes influencing a company’s diffusion rate: CPL, RA, compatibility, trialability and observability. However, applying this theory in an organizational context will have certain limitations as it tends to focus on the attitudes and behavior of individuals within the business without consideration of organizational characteristics such as size and quality of human resources or environmental factors including competitor pressure (CP) and GS (Lin et al., 2020). As a result, this theory is often employed to complement the technological factors within the TOE framework.
The TOE framework proposed by Tornatzky and Fleischer (1990) is considered a strong theoretical foundation for technological innovation adoption research. The framework identifies three major factors that impact significantly technology adoption within an organization: organization, environment and technology. Organizational factors refer to the internal business characteristics such as size, SR and quality of human resources. Environmental factors include external elements influencing the company’s decision to go green, such as CP, customer pressure and regulatory pressure. Technological factors cover the available technologies, both internal and external to the company, regardless of whether they are currently in use, including attributes such as CPL, compatibility and RA, which is supported by the theory of diffusion innovation. As a result, several researchers have combined TOE with DOI for a more comprehensive approach, such as Thong (1999), Wang et al. (2010), Lin et al. (2020) and Liu et al. (2024).
Additionally, institutional theory could also be used to highlight the external pressure that drives the company to adopt innovation practices, including coercive pressures (regulations), normative pressures (customer and non-government organization’s expectations) and mimetic pressures (tendency to mimic rivals under uncertainty) (DiMaggio and Powell, 1983; Berrone et al., 2013). Accordingly, this theory can be applied to clarify the environmental factors within the TOE framework.
Thong’s model (1999) is a combination of TOE and DOI theory. In addition to organizational and technical factors, this model also emphasizes the crucial role of the CEO’s characteristics (green knowledge, innovativeness) on the SME’s innovation adoption where the CEO plays a central role in decision-making. Thus, it is suggested that individual characteristics be included in the testing model in addition to the three existing perspectives in the TOE framework.
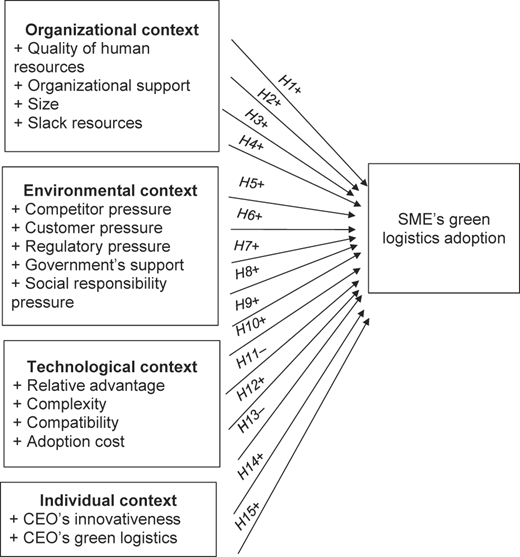
Together, these theoretical foundations will provide a comprehensive perspective of determinants of green logistics adoption categorized into four contexts: organization, environment, technology and individual. Drawing on previous literature, 15 variables from these four dimensions will be included in this model. Of these, 13 factors are hypothesized to have a positive influence on green logistics adoption, while the remaining two factors (CPL and AC) are hypothesized to exert an inverse direction. Accordingly, the research model is proposed as illustrated in Figure 1.
5. Research methodology
5.1 Questionnaire design
Except for the size variable, which is measured by the number of employees in the organization, the measurement of others is a 5-point Likert scale, ranging from 1 point being strongly disagree to 5 points being strongly agree. The research employs two to three observed variables to measure each factor in the model, as shown in the following table 1:
5.2 Data collection
The primary data for this research were collected through a survey distributed to SMEs in Vietnam. The target respondents are SMEs involved in logistics operations or those utilizing logistics services. To gather the data, a non-probability sampling technique was employed, with the study focusing on key sectors closely related to logistics, such as logistics services, commerce and construction. However, to ensure accuracy and reliability in multiple regression analysis, the gathered response should satisfy the minimum required sample size. According to Green (1991), the minimum sample size for Partial Least Squares Structural Equation Modeling (PLS-SEM) can be calculated by the following formula:
where N refers to the number of samples and m refers to the number of predictors (independent variables) in the model.
Based on Green’s formula, the minimum sample size required for a model including 15 predictors should be: 8 × 15 + 50 = 170. This means that to ensure the validity of the analysis, the actual sample size should exceed 170 responses.
In this study, 233 responses were initially collected. However, 31 responses were excluded due to homogeneous answers, indicating no variation in scores provided on the 1–5 Likert scale. This may entail inaccuracy for the empirical analysis as there is high possibility that these respondents were not serious in their responses. After omitting these invalid responses, only 202 observation results were valid for further analysis. Nevertheless, this sample size is sufficient for PLS-SEM analysis, which requires a minimum sample size of 170. The characteristics of the participants are summarized in the following table 2:
The sample consists of 202 respondents, with females accounting for the majority (79.2%). Participants represent various organizational levels, with 59.9% holding managerial or higher positions and 40.1% being employees. In terms of firm size, most respondents are from medium-sized enterprises (53%), followed by small-sized (32.7%) and micro firms (14.4%). Regarding firm characteristics, most respondents are in Hanoi (50%) and Ho Chi Minh City (33.2%). The sample is concentrated in the logistics sector (39.1%), which is more highly represented than manufacturing, trading and construction industries.
5.3 Analytical method
In this research, the author employs a quantitative method to explore and assess factors impacting the decision of green logistics adoption. Based on the proposed hypothesis, numerical data will be gathered through a survey distributed to Vietnamese SMEs. Once the collected response is sufficient for testing model, these data will be processed by a variety of statistical techniques including Cronbach’s alpha and PLS-SEM, with the support of Smart-PLS 4.0.
6. Empirical findings
6.1 Testing the reliability and validity of measurement model
Two commonly recommended indices for assessing measurement reliability are Cronbach’s alpha and composite reliability (CR).
As shown in Table 3, all constructs have Cronbach’s alpha and CR values exceeding 0.7, meeting the criteria for reliability. Consequently, it can be concluded that the measurement scale exhibits strong internal consistency with the items being closely related and reliably measuring the same construct.
Measurement of factors in the model
| Context | Factor | Code | Observed variable | Source |
|---|---|---|---|---|
| Factors influencing the intention to adopt green logistics | ||||
| Organization | Organizational support (OS) | OS 1 | 1. Our employees are always encouraged to learn green logistics knowledge by leaders | Lin et al. (2020), Weng and Lin (2011) |
| OS 2 | 2. Our employees are provided with the necessary resources to implement green logistics practices | |||
| Quality of human resources (QHR) | QHR 1 | 1. It is easy for our employees to learn green logistics knowledge | Lin et al. (2020), Weng and Lin (2011) | |
| QHR 2 | 2. Our employees possess the necessary skills to implement green logistics practices | |||
| Slack resources (SRs) | SR 1 | 1. Our company has the financial slack budget and technical resources to invest in green logistics implementation | Lee (2008), Henriques and Sadorsky (1999) | |
| SR 2 | 2. Our company has a sufficient number of skilled employees available for green logistics adoption | |||
| Technology | Relative advantage (RA) | RA 1 | 1. Green logistics adoption provides better environmental performance compared to existing practices | Lin et al. (2020), Weng and Lin (2011) |
| RA 2 | 2. Green logistics adoption offers greater economic benefits than current solutions | |||
| RA 3 | 3. Implementing green logistics enhances our company’s reputation in the market | |||
| Compatibility (CPA) | CPA 1 | 1. It is easy to integrate green logistics technology with our existing systems without significant changes | Lin et al. (2020), Weng and Lin (2011) | |
| CPA 2 | 2. Green logistics align with our company’s values, needs and strategic goals | |||
| Complexity (CPL) | CPL 1 | 1. It is difficult to learn green logistics knowledge | Lin et al. (2020), Weng and Lin (2011) | |
| CPL 2 | 2. It is difficult to share the knowledge of green logistics | |||
| CPL 3 | 3. Using green logistics requires significant expertise and experience | |||
| Adoption cost (AC) | AC 1 | 1. Implementing green logistics requires a high initial investment | Hao et al. (2020), Lin et al. (2020) | |
| AC 2 | 2. Training our employees to use green logistics technologies needs significant costs | |||
| Environment | Government support (GS) | GS 1 | 1. Adopting green logistics can receive financial and technical support from the government | Lin et al. (2020), Weng and Lin (2011) |
| GS 2 | 2. Green logistics adoption is encouraged by government regulations | |||
| Buyer's pressure (BP) | BP 1 | 1. Our company must enhance environmental performance to meet customer expectations | Lin et al. (2020), Weng and Lin (2011) | |
| BP 2 | 2. Our customers want the company to adopt more sustainable and eco-friendly practices | |||
| Regulatory pressure (RP) | RP 1 | 1. Our company must follow the environmental regulations set by the government | Lin et al. (2020), Weng and Lin (2011) | |
| RP 2 | 2. There are environmental requirements from industry associations that need to conform | |||
| Competitor pressure (CP) | CP 1 | 1. Our company faces pressure to adopt green logistics practices due to the successful implementation by competitors | Lin et al. (2020), Weng and Lin (2011) | |
| CP 2 | 2. To remain competitive, we are pressured to follow current green logistics trends | |||
| Social responsibility pressure (SRP) | SRP 1 | 1. Society expects our company to adopt environment-friendly practices in operations | Youngswaing et al. (2024), Hwang et al. (2016) | |
| SRP 1 | 2. Meeting social expectations for environmental responsibility is crucial for maintaining our company’s reputation and competitiveness | |||
| SRP 3 | 3. Our company must adopt green logistics due to increasing public awareness of environmental issues | |||
| Individual | CEO's innovativeness (CI) | CI 1 | 1. Our CEO is willing to implement green logistics innovations into practice, as long as they are necessary and feasible | Thong (1999), Laforet and Tann (2006) |
| CI 2 | 2. Our CEO proactively researches and explores new green logistics innovations | |||
| CEO’s green logistics knowledge (CGLK) | CGLK 1 | 1. Our CEO has profound expertise and experience in green logistics | Thong (1999), Yoon et al. (2020) | |
| CGLK 2 | 2. Our CEO proactively learns and deepens green logistics knowledge | |||
| Intention to adopt green logistics | ||||
| Dependent variable | The intention of green logistics adoption (GLA) | GLA 1 | 1. There is a likelihood that our company will adopt green logistics within the next one to three years | Lin et al. (2020) |
| GLA 2 | 2. Our company currently plans to implement green logistics practices | |||
| GLA 3 | 3. Our company strongly recommends employing green logistics to other businesses | |||
Characteristics of respondents
| Items | Classification | Frequency (N) | Percent (%) |
|---|---|---|---|
| Gender | Male | 42 | 20.8 |
| Female | 160 | 79.2 | |
| Position | CEO | 11 | 5.4 |
| Vice director | 9 | 4.5 | |
| Top management | 33 | 16.3 | |
| Manager | 68 | 33.7 | |
| Employee | 81 | 40.1 | |
| Company size | Micro | 29 | 14.4 |
| Small | 66 | 32.7 | |
| Medium | 107 | 53.0 | |
| Company location | Hanoi | 101 | 50.0 |
| Ho Chi Minh | 67 | 33.2 | |
| Others | 34 | 16.8 | |
| Business sector | Manufacturing | 32 | 15.8 |
| Trading | 29 | 14.4 | |
| Logistics services | 79 | 39.1 | |
| Construction | 33 | 16.3 | |
| Others | 29 | 14.4 | |
| Total | 202 | 100.0 | |
The measurement reliability
| Number of items | Cronbach’s alpha | Composite reliability (rho_c) | Average variance extracted (AVE) | |
|---|---|---|---|---|
| AC | 2 | 0.885 | 0.941 | 0.889 |
| BP | 2 | 0.950 | 0.976 | 0.953 |
| CI | 2 | 0.718 | 0.866 | 0.765 |
| CGLK | 2 | 0.883 | 0.945 | 0.895 |
| CP | 2 | 0.871 | 0.939 | 0.885 |
| CPA | 2 | 0.774 | 0.896 | 0.812 |
| CPL | 3 | 0.849 | 0.903 | 0.757 |
| GLA | 3 | 0.837 | 0.902 | 0.753 |
| GS | 2 | 0.931 | 0.966 | 0.934 |
| OS | 2 | 0.866 | 0.937 | 0.881 |
| QHR | 2 | 0.834 | 0.917 | 0.847 |
| RA | 3 | 0.825 | 0.889 | 0.730 |
| RP | 2 | 0.837 | 0.924 | 0.858 |
| SR | 2 | 0.774 | 0.895 | 0.810 |
| SRP | 3 | 0.889 | 0.931 | 0.819 |
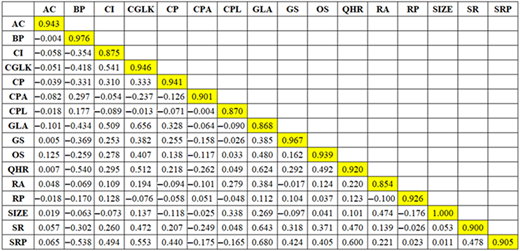
The validity of a scale is evaluated through convergent validity and discriminant validity. The convergent validity of the construct is satisfied with AVE larger than 0.5. In contrast to convergent validity, which denotes the positive correlation among items reflecting a single construct, discriminant validity signifies the distinctness among latent variables within a model (Fornell and Larcker, 1981). This can be tested through Fornell–Larcker criterion.
As shown in Figure 2, the absolute value of the correlation coefficient between each construct and the others does not exceed the square root of its AVE, indicating that the discriminant validity criterion is met.
6.2 Structural model analysis
Before conducting regression analysis, it is essential to check for multicollinearity. Multicollinearity occurs when there is a strong correlation among independent variables within a model, which would lead to the inaccuracy of regression estimates.
Since all the variance inflation factor (VIF) values depicted in Table 4 are smaller than 3, the model poses no threat of multicollinearity. To examine the explanatory power of the model, the authors used R-square adjusted.
Inner model multicollinearity testing results
| Independent variables | VIF |
|---|---|
| AC | 1.061 |
| BP | 1.924 |
| CI | 1.715 |
| CGLK | 2.255 |
| CP | 1.419 |
| CPA | 1.197 |
| CPL | 1.346 |
| GS | 1.402 |
| OS | 1.469 |
| QHR | 2.313 |
| RA | 1.528 |
| RP | 1.185 |
| SIZE | 1.538 |
| SR | 1.555 |
| SRP | 2.774 |
As illustrated in Table 5, the R2 adjusted value is 0.846, indicating that 15 predictors account for 84.6% of the variance in the dependent variable (green logistics adoption), whereas the remaining 15.4% may be attributed to factors outside the model. To assess the statistical significance of the path coefficients, the authors used the standard error obtained from the bootstrapping resampling technique in Smart-PLS. A path coefficient is considered statistically significant if the p-value is less than 0.05 (see Figure 3). Figure 3 presents the structural model with path coefficients.
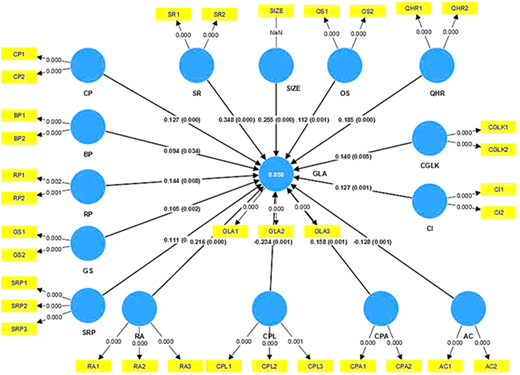
Overall, all 15 relationships between independent variables and dependent variables are statistically significant, with p-values below 0.05, as shown in Table 6. As a result, all 15 proposed hypotheses are supported and consistent with previous research. Among the independent variables, AC and CPL show an inverse relationship with green logistics implementation, while the remaining 13 variables exhibit a positive direction. Remarkably, it is SRs that have the strongest correlation with green logistics adoption, with a path coefficient (β) of 0.348.
Results of structural model path coefficients
| Relationship | Path coefficient | Sample mean | Std. dev. | t-stat | p-values | Hypothesis results |
|---|---|---|---|---|---|---|
| AC → GLA | −0.128 | −0.122 | 0.037 | 3.431 | 0.001 | Accepted |
| BP → GLA | 0.094 | 0.091 | 0.044 | 2.114 | 0.035 | Accepted |
| CI → GLA | 0.127 | 0.131 | 0.036 | 3.539 | 0.000 | Accepted |
| CGLK → GLA | 0.140 | 0.138 | 0.049 | 2.863 | 0.004 | Accepted |
| CP → GLA | 0.127 | 0.121 | 0.036 | 3.502 | 0.000 | Accepted |
| CPA → GLA | 0.158 | 0.142 | 0.048 | 3.301 | 0.001 | Accepted |
| CPL → GLA | −0.234 | −0.212 | 0.070 | 3.345 | 0.001 | Accepted |
| GS → GLA | 0.105 | 0.101 | 0.034 | 3.048 | 0.002 | Accepted |
| OS → GLA | 0.112 | 0.111 | 0.036 | 3.109 | 0.002 | Accepted |
| QHR → GLA | 0.185 | 0.176 | 0.049 | 3.773 | 0.000 | Accepted |
| RA → GLA | 0.216 | 0.208 | 0.044 | 4.876 | 0.000 | Accepted |
| RP → GLA | 0.144 | 0.141 | 0.046 | 3.145 | 0.002 | Accepted |
| SIZE → GLA | 0.255 | 0.243 | 0.041 | 6.164 | 0.000 | Accepted |
| SR → GLA | 0.348 | 0.340 | 0.041 | 8.434 | 0.000 | Accepted |
| SRP → GLA | 0.111 | 0.124 | 0.053 | 2.084 | 0.037 | Accepted |
Although the standardized regression coefficient in path coefficient analysis can compare the influence of exogenous variables on the endogenous variable, it cannot precisely determine the degree of that impact. Hence, f-square value was utilized to identify the effect size of each factor on green logistics adoption.
As revealed in Table 7, the influence levels of the independent factors on green logistics adoption in descending order are SR, organization size (SIZE), CPL, RA, compatibility (CPA), regulation pressure (RP), AC, quality of human resource (QHR), CP, CI, CEO’s green logistics knowledge (CGLK), organization support, GS, Buyer’s pressure and SRP. Accordingly, the result confirms that the strongest influence is SR, whereas the weakness is SRP, which is slightly different compared to the outcomes drawn from standardized regression coefficients.
7. Conclusion
The research examines the factors influencing Vietnamese SMEs’ intention to adopt green logistics practices, identifying 15 significant variables across four dimensions: organization, technology, environment and CEO characteristics. Results show that SRs are the most crucial driver for adoption, while CPL and adoption costs negatively impact implementation. By integrating the TOE framework, DOI theory and Thong’s model, this study fills a critical gap in the Vietnamese context, offering a comprehensive and empirical approach to understanding green logistics adoption. Additionally, the inclusion of SRP as a novel variable provides new insights into its potential role as a key driver for sustainable practices. The study provides recommendations for SME managers and policymakers.
7.1 Recommendation
7.1.1 To the enterprises
To promote the adoption of green logistics, companies should focus on four key areas simultaneously.
7.1.1.1 From the organizational aspect
First, improving SRs is crucial, as they are the most significant factor in the adoption process. This includes allocating sufficient financial budgets, human capital and technology as well as integrating green logistics into a company’s development strategy. Implementing resource management systems such as Enterprise Resource Planning or data analysis tools can help forecast and manage future resource demands more effectively. Second, enhancing human capital is vital. Providing training for existing employees and attracting skilled experts in green logistics will ensure a knowledgeable workforce capable of implementing sustainable practices. Third, organizational support and incentives are essential. Leaders should offer assistance to employees during the transition and establish incentive systems, such as financial rewards or career development opportunities, to encourage active participation in green logistics initiatives.
7.1.1.2 From the environmental aspect
First, companies should leverage government assistance and international funding opportunities, such as tax incentives, financial support, preferential interest rates and funds such as the Green Climate Fund, World Bank Climate Investment Funds, the Climate Finance Accelerator Program and Aus4Skills, to strengthen their resources and mitigate the financial burden when implementing sustainable solutions. Second, it is imperative for firms to respond to the pressure from competitors and consumers. In this rapidly evolving market, firms must monitor sustainable consumption trends and competitors’ activities to stay competitive while simultaneously enhancing their reputation and contributing to industry-wide sustainability.
7.1.1.3 From the technological aspect
First, companies ought to balance the perceived benefits with costs, and enterprises should thoroughly contemplate the long-term advantages of green logistics rather than merely focusing on the immediate expenses. Despite the substantial initial expenditure, long-term operations’ expenses will markedly diminish, thereby providing a competitive edge for companies. Moreover, environmental sustainability is an inevitability the world is moving toward. As such, enterprises should immediately implement these practices to sustain their competitiveness and secure the first-mover advantage, especially in Vietnam, where the ecological logistics transition remains nascent. Second, enterprises must develop detailed plans for green logistics integration, starting with modest changes, such as eco-friendly packaging or renewable energy in warehouses, and gradually expanding over time to manage costs effectively. Third, collaborating with stakeholders in the green supply chain can reduce integration CPL and adoption costs by leveraging expert knowledge, helping companies accelerate the transition process and minimizing risks of failure by cooperating with stakeholders with expertise in the green logistics sectors.
7.1.1.4 From the individual aspect
CI and green logistics knowledge have been demonstrated to exhibit a considerable impact on the intention of an SME to employ green logistics, and CEOs should continuously nurture and deepen their understanding of green logistics including related regulations and support tools. As such, they can confidently make the most precise and compatible decisions, directions and strategies for environment-friendly logistics practices. Additionally, CEOs should actively foster innovation in green logistics within the organization and explore novel methods to improve operational efficiency.
7.1.2 To the policymakers
The promotion of the shift to green logistics for sustainable development is not only the responsibility of the enterprise but also of the government. Accordingly, some recommendations for policymakers are suggested. First, incentives for SMEs should be enhanced by improving the dissemination of information about available support, developing a detailed and transparent set of eligibility criteria for green logistics and optimizing administrative processes to ensure easy access. Second, strengthen environmental regulations by setting clear, specific criteria for green logistics including energy savings, waste management, eco-friendly materials and imposing stricter sanctions, such as penalties for exceeding environmental limits, to drive compliance. Third, foster international cooperation by forming strategic partnerships with global environmental organizations to secure additional funding and expertise. Fourth, invest in infrastructure development, such as electric charging stations and sustainable distribution centers, to support businesses in adopting green logistics more effectively.
7.2 Limitations and direction for future research
Even with these attempts to bridge the existing research gap in green logistics, the researchers continued to encounter certain limits that require further investigation. First, the data gathered are nonrepresentative as it primarily comes from Hanoi and Ho Chi Minh City within certain sectors, which does not adequately reflect SMEs nationwide. Therefore, future studies should broaden the sample scope to include various provinces and industries beyond logistics, such as agriculture, manufacturing and energy, to ensure a more holistic and representative dataset. Second, the restricted number of predictors for each construct, with only two to three items per construct, may limit the accuracy and depth of the findings. In future research, increasing the number of items per construct will help improve the reliability and validity of measurements, providing a more thorough representation of each construct. Third, while the model includes 15 exogenous variables, they do not sufficiently explain the variance in the dependent variable. To address this, future studies should incorporate additional potential predictors, such as the relationship with suppliers and infrastructure, to enhance the explanatory power of the model. Fourth, the study only used quantitative methods based on data from an online and offline survey, which may lack the depth and context needed for a comprehensive understanding of the issue. Future research should utilize a mixed-methods approach, combining qualitative techniques including focused interviews and case studies with quantitative methods to gain deeper insights into the statistical trends identified.

