

The main objective is to find out how trust affects customer loyalty and adaptation to possible changes in the price of the service. Sports services have experienced growth in recent years in a competitive environment that uses different strategies to attract and retain users. Trust is a fundamental tool for managing a sports service since it creates a more positive customer perception.
A total of 408 customers of a fitness centre participated in this study. A multi-item scale measuring trust, satisfaction, loyalty and adaptation to price was used. The relationships between constructs were tested using structural equation modelling.
The results have shown that trust is very relevant among users of the centre, as it affects both satisfaction and loyalty as well as adaptation to price.
Further research is needed on the relationships between these constructs, especially on the relationship between satisfaction and price adaptation, in more sports centres, whether for-profit or not-for-profit, while it is also necessary to include the variable price or low-cost centre, which may condition this relationship, becoming a limitation of this study. It would also be interesting to consider external factors, such as the socioeconomic context, the profile of users or social commitment.
Fitness centres, in response to a change in prices, must establish measures that affect trust, with the aim of increasing the attitudinal and behavioural variables resulting from such a change.
These results highlight the importance of user confidence in terms of their behaviour and intentions in the face of changing prices. The research will provide information to managers and sports centres on different measures and variables.
1. Introduction
The fitness sector has experienced significant growth in the last decade, increasing the number of customers, facilities and employees both in Europe (Europe Active and Deloitte, 2024) and in the rest of the world (Health and Fitness Association, 2024). The competitive environment in which this sector operates forces companies to face new threats and opportunities while redefining their strategies to survive and gain competitive advantages. Research in the fitness sector has shown that promotion through social media, the use of digital applications, attractive prices, frequent renewal of equipment and renovation/maintenance of facilities have been the most common retention and promotion strategies (Gómez-Ruiz et al., 2022; Tsitskari and Batrakoulis, 2022).
But along with these strategies, as proposed by Alguacil et al. (2020), trust is a fundamental tool when it comes to managing a fitness service. Trust creates a more positive customer perception of the service. High levels of trust translate into more positive future intentions to use the fitness centre since trust in the organisation affects customer loyalty and adaptation to possible changes in the price of services.
2. Theoretical foundation and hypothesis
Building stable and lasting relationships with consumers is one of the objectives of marketing, wherein trust is a fundamental element (Hiscock, 2001), with a substantial body of research in this regard (Fullerton, 2005; Ganesh et al., 2000). Trust has been studied in a wide range of sectors, but research in the fitness sector is still scarce (Cuesta-Valiño et al., 2021; Schlesinger et al., 2014). Parasuraman et al. (1985) first introduced the concept of trust as an essential factor in achieving successful relationships between customers and service providers. Trust is used to express the authority of a brand or organisation that inspires confidence in customers within a relationship (Munuera-Aleman et al., 2003). For Chaudhuri and Holbrook (2001), trust is the consumer’s willingness to believe in the ability of a brand to perform its stated function. Specifically in the business sector, trust is related to the supposed ability and capacity of a company to carry out certain activities while fulfilling its obligations and promises (Bastos et al., 2015).
Several authors consider trust to be a multidimensional construct, based on two aspects: honesty and benevolence (Flavián and Guinalíu, 2006; Hewett et al., 2002; Roberts et al., 2003). However, despite recognising the presence of different attributes in the concept, other authors work with one-dimensional instruments of trust in order to achieve greater generality and obtain simpler models (Kim et al., 2009; Lien et al., 2015). Research has shown that trust positively influences customer satisfaction (Benton and Maloni, 2005). Trust has been found to precede satisfaction among spectators of sports services (Quirante-Mañas et al., 2025) and also among participants in an international badminton sporting event (Quirante-Mañas et al., 2024). Other studies (Munuera-Aleman et al., 2003; Bastos et al., 2015; Sung and Kim, 2010) conclude that trust is one of the most important constructs that affect loyalty since trust creates relationships of exchange that are highly valued (Lee et al., 2015).
Satisfying customers is another goal of any company due to its potential impact on purchasing behaviour and the consequent economic benefits that this entails (Ali et al., 2016). The literature contains publications dealing with customer satisfaction in various services (Agarwal and Dhingra, 2023; Desmal et al., 2022), including in the fitness sector (Nuviala et al., 2021). The definition and conceptualisation of customer satisfaction vary throughout the marketing literature. However, all definitions and conceptualisations agree that the concept of satisfaction implies the necessary presence of a goal that the consumer wishes to achieve (Ali et al., 2016). The definition provided by Oliver (2010) endorses this perspective, understanding satisfaction as the fulfilment of customer expectations about products and services when comparing them with perceived performance. More recently, Foroughi et al. (2019) argue that satisfaction is an emotional reaction to an act of consumption or a subjective evaluation performed as a post-choice cognitive judgement based on previous perceptions or assumptions of quality. When it comes to measuring customer satisfaction, it is common to use one-dimensional scales (Cronin et al., 2000; Oliver, 2010), as in the measurement of this construct in the fitness services sector (Avourdiadou and Theodorakis, 2014; Nuviala et al., 2020). Therefore, in accordance with the above, we have put forward the following hypotheses:
Trust is a precursor to satisfaction.
On the other hand, recent research has revealed a strong relationship between satisfaction and loyalty in sports services, as shown in the study conducted by Gálvez-Ruiz et al. (2023) in low-cost fitness centres, Haro-González et al. (2018) in fitness services aimed exclusively at women or the research by Quirante-Mañas et al. (2023) with participants in fun runs.
Gaining knowledge about the future intentions of service users is particularly interesting for the organisers of programmes and physical activities. Usually, within the world of sports and fitness management, research has focused on the issue of loyalty, understood as a deeply rooted intention to consume a product or service repeatedly, despite situational influences and marketing efforts (Oliver, 2010). This construct includes both the possibility of repurchasing and the intention to recommend the service to third parties (Howat and Assaker, 2016). Specifically for fitness services, Yoshida and James (2010) defined customer loyalty as the favourable attitude towards the sports and fitness centre in terms of recommending the centre and its services and demonstrating positive repurchase behaviours. This construct is usually measured using one-dimensional scales, as Shah and Jan (2021) did recently to assess loyalty in the hotel industry, Supriyanto et al. (2021) with regard to banking and Shie et al. for health services (2022). When exploring fitness services, various research papers have also used one-dimensional scales (Dueñas-Dorado et al., 2021; Min, 2022; Yoshida et al., 2023). In accordance with the above, we propose the following hypotheses:
Trust is a precursor to loyalty.
Satisfaction is a precursor to loyalty
Another intention of interest to theorists and managers of sports and fitness centres is price acceptance, which refers to the maximum price that a buyer is willing to pay for a particular product or service (Huber et al., 2001; Martín-Consuegra et al., 2007). Price acceptance has not received significant attention compared to other customer satisfaction outcomes such as loyalty, repurchase intentions and word of mouth (Ali et al., 2016). There are few studies that include this construct in the field of fitness services, which would include Dalmau-Torres et al. (2022), Fernández-Martínez et al. (2020) or Pérez-Ordás et al. (2019). One-dimensional instruments have been used to measure the construct (Ali et al., 2016; Giovanis and Athanasopoulou, 2018; Martín-Consuegra et al., 2007).
Regarding the relationship of this construct to others, satisfaction has been found to be a direct antecedent of price tolerance (Ali et al., 2016; Dalmau-Torres et al., 2022; Giovanis and Athanasopoulou, 2018), since users who are willing to pay a higher price for the service tend to expect higher quality, which translates into greater satisfaction (Addolorato and Hormigón-Gimeno, 2025). Similarly, some researchers have found that loyalty is also a precedent of price tolerance (Escamilla-Fajardo and Núñez-Pomar, 2014; Giovanis and Athanasopoulou, 2018; Jaiswal and Niraj, 2011).
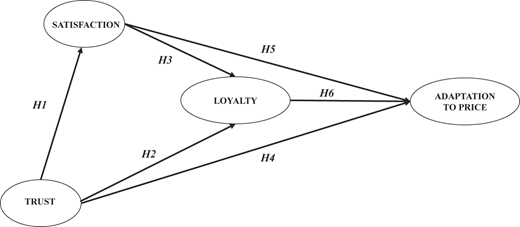
The review conducted of the literature on sports and fitness services has shown the relationship between these constructs separately. As far as we know, no research links these four constructs together in sports services and none specifically does so in relation to fitness services, so the aim of this paper is to find out whether trust in the organisation affects satisfaction, customer loyalty and adaptation to possible changes in the price of fitness services. In accordance with the studies reviewed, we propose the following hypotheses:
Trust is an antecedent to adaptation to price.
Satisfaction is an antecedent to adaptation to price.
Loyalty is an antecedent to adaptation to price.
Therefore, we present the following model that relates the different constructs and hypotheses (see Figure 1):
3. Methodology
3.1 Study population
A total of 408 clients of a private fitness centre located in the city of Huelva (Spain) participated in this study, with an average age of 34.48 ± 14.41 years, of which 52.9% were women. Most reported having a higher level of education (53.9%). About 61.8% did physical activity four or more times a week and 77.1% did between one and two hours of physical activity (Table 1). The most popular activity among clients was unsupervised training (free activities) for 68.8%, 30.4% of clients frequently took part in instructor-led or supervised activities and 19.6% used the services of a personal trainer. The prices of the different services were around average compared to other similar centres located in the same city and could be considered traditional rather than either low-cost or premium/boutique (De la Cámara-Serrano, 2015).
Description of sociodemographic variables
| Variable | Total | Female | Male | Sig. | |
|---|---|---|---|---|---|
| Number | 408 | 216 (52.9%) | 192 (46.1%) | ||
| Age | 34.48 ± 14.36 | 31.90 ± 12.59 | 37.78 ± 15.56 | 0.000 | |
| Education | Basic | 6.9% | 1.9% | 12.5% | 0.000 |
| Secondary | 39.2% | 37.0% | 41.7% | ||
| Higher | 53.9% | 61.1% | 45.8% | ||
| Activities carried out | Group | 30.4% | 40.7% | 18.8% | 0.000 |
| Free | 68.6% | 57.4% | 81.3% | 0.000 | |
| Personal training | 19.6% | 22.2% | 16.7% | 0.000 | |
| Number of times per week | Once a week | 1.0% | 1.9% | 0.0% | 0.001 |
| 2–3 times a week | 37.3% | 44.4% | 29.2% | ||
| 4 or more times a week | 61.8% | 53.7% | 70.8% | ||
| Average duration of sessions | Less than one hour per session | 5.9% | 7.4% | 4.2% | 0.251 |
| Between 1 and 2 h | 77.5% | 77.8% | 77.1% | ||
| More than 2 h | 16.7% | 14.8% | 18.8% | ||
Source(s): Authors’ own work
3.2 Instruments
To carry out this study, we used multi-item Likert-type scales ranging from 1 to 5, where 1 represented total disagreement and 5 total agreement. Trust was measured using five items proposed by Flavián and Guinaliu (2006). Satisfaction was assessed through four items suggested by Nuviala et al. (2013a). Loyalty (five items) and adaptation to price (two items) are two constructs integrated into a scale that aims to measure the future intentions of fitness services users (Nuviala et al., 2014). We also included several sociodemographic questions to gain a better understanding of the socio-fitness profile of the users of the centre where the research was carried out (Table 1).
3.3 Procedure
Firstly, we requested authorisation from the management of the fitness centre to conduct the research. Once granted, we informed clients of the fitness centre of the purpose of the research and then asked them to participate in the study and complete an anonymous questionnaire. After obtaining written consent, members of the research team who had received previous training through a pilot experiment administered the questionnaire to the clients. We gathered data during the last two weeks of March, from Monday to Friday, in the morning and afternoon. This process took around five minutes. The researchers who administered the questionnaire answered any questions participants might have while completing the survey.
This research work takes into account the international ethical guidelines established by the American Psychological Association (APA) and also adopts the fundamental principles established in the Declaration of Helsinki (revised in 2013).
3.4 Statistical analysis
The first goal was to verify univariate and multivariate normality. For this purpose, in addition to the mean and standard deviation, we calculated the values of asymmetry and kurtosis of the items. We tested univariate normality using the criterion proposed by Kline (2011), according to which values below 3 were considered normal for asymmetry and values below 10 for kurtosis. We then verified multivariate normality using Mardia’s test (Mardia, 1970). If Mardia’s value is higher than 70, it could indicate a problem with normality (Rodríguez and Ruiz, 2008).
We calculated correlations between study factors, internal consistency (Cronbach’s alpha), average variance extracted (AVE), composite reliability (CR) and Harman’s factor test. We calculated multicollinearity in the same way in order to determine the correlation between the factors. Acceptable values for Cronbach’s alpha are around 0.70, while the correct values for Cronbach’s alpha range from 0.80 to 0.90 (Streiner, 2003). Suitable CR values should be higher than 0.6 (Bagozzi and Yi, 1988), while appropriate AVE values should be higher than 0.5 (Hair et al., 2006). Podsakoff et al. (2003) indicated that the Harman factor test is performed by examining the results of exploratory factor analysis and verifying whether the first extracted factor accounts for more than 50% of the variance. The evaluation of collinearity was carried out following the criterion proposed by Hair et al. (2017), who consider indications of multicollinearity when the variance inflation factor (VIF) is greater than 5.
Subsequently, we conducted an analysis to verify the adequacy of the model that relates trust, satisfaction, loyalty and adaptation to price. This evaluation was carried out following the maximum likelihood (ML) estimation method (Thompson, 2004), applying a resampling procedure if the Mardia value exceeded 70. To measure the overall fit of the model, we used the following indexes: Chi-square minimum (CMIN), degrees of freedom (DF), CMIN/DF ratio, comparative fit index (CFI), Tucker–Lewis index (TLI), incremental fit index (IFI), parsimony comparative fit index (PCFI) and root mean square residual (RMR). CFI, TLI and IFI values ≥ 0.90 are considered acceptable (Schermelleh-Engel et al., 2003). PCFI values should be >0.5 (Hair et al., 2006). RMR values >0.05 and ≤ 0.1 indicate an acceptable fit and values ≤ 0.05 indicate a good fit (Schermelleh-Engel et al., 2003). With regard to the χ2/DF value, a perfect model would yield a value of 1.00, and ratios below 2.00 would be considered indicators of a very good fit of the model, while values below 5.00 would be considered acceptable (Hu and Bentler, 1999; MacCallum et al., 2001; Yuan, 2005). Finally, we calculated standardised regression coefficients to identify relationships in the model using AMOS 22.0. (IBM Corp., Armonk, NY, United States).
4. Results
Firstly, we verified the univariate normality of the items for which the values of asymmetry and kurtosis were calculated. As shown in Table 2, they are below the expected limits, confirming univariate normality. We then calculated Mardia’s coefficient value, which was 129,277. The result is lower than suggested by Bollen (1989) based on the p formula (p + 2), where p is the number of observed variables, which would give a result of 360, since in this study there were 18 observed variables. The result shows fulfilment of the assumption of multivariate normality.
Descriptive analysis of the items
| Construct | Items | Mean | St. Dev. | Factor weight | Asymmetry | Kurtosis |
|---|---|---|---|---|---|---|
| Satisfaction | Choosing this centre has been a good decision | 4.01 | 0.98 | 0.936 | −0.80 | 0.48 |
| I am pleased I signed up at the centre | 3.93 | 0.98 | 0.950 | −0.55 | −0.20 | |
| It was a good decision to work out at this centre | 4.03 | 0.98 | 0.923 | −0.65 | −0.15 | |
| I am happy I signed up at the centre | 3.91 | 1.04 | 0.954 | −0.67 | −0.06 | |
| Loyalty | I will tell other people about the positive aspects of the fitness centre | 4.48 | 0.78 | 0.895 | −1.72 | 3.54 |
| I will recommend the fitness centre to anyone looking for my advice | 4.53 | 0.71 | 0.935 | −1.56 | 2.10 | |
| I will encourage my friends and family to work out at this centre | 4.39 | 0.83 | 0.886 | −1.26 | 0.83 | |
| For any fitness service I might need, I will consider this centre as my first choice | 4.35 | 0.86 | 0.866 | −1.41 | 1.92 | |
| In the coming years, I will do more fitness activities at this centre | 4.23 | 0.86 | 0.769 | −0.94 | 0.54 | |
| Adaptation to price | Even if the prices are somewhat higher, I will stay with this fitness centre | 3.70 | 1.14 | 0.922 | −0.68 | −0.33 |
| I am willing to pay a higher price than other gyms charge for the service I receive | 3.33 | 1.19 | 0.922 | −0.25 | −0.78 | |
| Trust | The fitness centre delivers on its promises | 3.99 | 0.96 | 0.820 | −0.71 | 0.14 |
| Information provided by the centre is reliable | 4.17 | 0.93 | 0.820 | −0.80 | −0.13 | |
| The staff has the necessary training to provide the service | 4.14 | 1.00 | 0.855 | −1.01 | 0.39 | |
| The fitness centre has the experience necessary to provide the services | 4.18 | 0.96 | 0.883 | −1.06 | 0.77 | |
| The fitness centre has the necessary resources to provide the services engaged | 4.17 | 1.02 | 0.855 | −1.19 | 0.97 |
Source(s): Authors’ own work
Exploratory factor analysis explained 41.80% of the total variance, a result that is below the critical level of 50%, suggesting that the bias of the common method does not seem to significantly affect the results of the study. We then went on to verify the correlation between constructs. As shown in Table 3, there is no correlation between satisfaction and adaptation to price. We also checked reliability (CR and Cronbach’s alpha) and validity (AVE). Cronbach’s alpha values were equal to or greater than 0.766, AVE presented 0.71 as the lowest value, while the smallest value of CR was 0.90. The results obtained for multicollinearity with VIF presented values between 1,135 and 1,771, which demonstrates the absence of this type of problem.
Mean, standard deviation, correlation, validity and reliability of the constructs included in the research
| Mean | Standard deviation | 1 | 2 | 3 | 4 | 5 | AVE | CR | |
|---|---|---|---|---|---|---|---|---|---|
| 1. Satisfaction | 3.97 | 0.93 | (0.95) | 0.33** | 0.15 | 0.64** | 0.52** | 0.88 | 0.96 |
| 2. Loyalty | 4.40 | 0.70 | (0.91) | 0.57** | 0.28** | 0.21* | 0.76 | 0.94 | |
| 3. Price | 3.51 | 1.07 | (0.82) | 0.29** | −0.01 | 0.84 | 0.91 | ||
| 4. Trust | 4.13 | 0.82 | (0.90) | 0.39** | 0.71 | 0.92 |
Note(s): *p < 0.05 and **p < 0.01
Source(s): Authors’ own work
Following these previous analyses, and having confirmed univariate normality, although not multivariate normality, we then verified the model tested by means of the ML estimation method with a resampling procedure. The model fit indices show values above the recommended values to consider the model correct (CMIN = 208.294; DF = 98; CMIN/DF = 2,125; CFI = 0.926; TLI = 0.910; IFI = 0.927; PCFI = 0.756 and RMR = 0.065).
Secondly, having verified the model, we calculated the standardised coefficients of the relationships between latent variables for all users of the fitness centre. The data in Table 4 show how trust is a direct antecedent of both satisfaction and adaptation to price. Regarding satisfaction, the results show that it is a precedent of loyalty, but not of adaptation to price, which is a precursor of loyalty. The total effects – sum total of direct and indirect effects – show that trust affects loyalty through satisfaction and that trust has an indirect effect on adaptation to price through satisfaction and loyalty.
Direct and total effects of relationships between constructs. Standardised values. Hypothesis confirmation
| Hypothesis | Direct effect | Total effect | Confirmation | |||
|---|---|---|---|---|---|---|
| Standardised | Standardised | |||||
| H1. | Satisfaction | ← | Trust | 0.690* | 0.690* | Confirmed |
| H2. | Loyalty | ← | Trust | n.s. | 0.251* | Confirmed |
| H3. | Loyalty | ← | Satisfaction | 0.291* | 0.291* | Confirmed |
| H4. | Price | ← | Trust | 0.231* | 265* | Confirmed |
| H5. | Price | ← | Satisfaction | n.s. | n.s. | Not confirmed |
| H6. | Price | ← | Loyalty | 0.569* | 0.569* | Confirmed |
Note(s): n.s. = not significant, *p < 0.05 and **p < 0.001
Source(s): Authors’ own work
5. Discussion
The purpose of this study was to ascertain how trust in the organisation affects customer loyalty and adaptation to possible changes in the price of fitness services. To analyse the data, we used the ML estimation method since the necessary conditions related to sample size and normality were met (Hayes and Preacher, 2014) based on structural equation modelling techniques, subsequently verifying the relationships between constructs. The results of this study showed that trust has an effect on both loyalty and adaptation to price.
In particular, the results show that there is a significant and direct effect between customer trust and satisfaction, thus confirming H1. Benton and Maloni (2005) had previously shown that trust had a positive impact on customer satisfaction in a telephone company, as did Giovanis and Athanasopoulou (2018) in relation to Internet services. However, in the field of sports and fitness services, the scarce literature on the subject does not explore this relationship, such as Cuesta-Valiño et al. (2021), who did not include the relationship between trust and satisfaction in their model of fitness services. In any case, following Balaji (2015), knowing that the trust–satisfaction relationship is supported by the theory of cognitive coherence, we would expect satisfaction to be higher in the presence of a high degree of customer trust, so it seems that increasing trust in sports services will increase satisfaction.
The confirmation of H1 – that trust is a precursor to satisfaction – should be considered a very relevant result due to the subsequent consequences since trust has an effect, at least indirectly, on other constructs analysed in this research. The results have not shown a direct effect of trust on loyalty, contrary to the findings of other studies (Bastos et al., 2015; Munuera-Aleman et al., 2003; Sung and Kim, 2010). As in this study, Balaji (2015) did find the absence of a direct relationship between trust and loyalty. The results showed that the trust–loyalty relationship was mediated by satisfaction, a result that is reproduced in this population of fitness centre users. The results allow us to assume, as did Lee et al. (2015), that trust is an important construct and that it affects loyalty since trust creates relationships of exchange that are highly valued. Therefore, the results, although indirectly, allow us to confirm hypothesis 2.
The relationship between satisfaction and loyalty – hypothesis 3 – has been proven multiple times (Chiou and Droge, 2006) and even specifically in sports and fitness services (Gálvez-Ruiz et al., 2023; Haro-González et al., 2018; Quirante-Mañas et al., 2023). The results of this research are along the same lines and confirm this relationship, even encouraging repeat participation (Chaves-Castro et al., 2025; Morán-Gámez et al., 2024; Quirante-Mañas et al., 2024). It is important to note that this relationship is what allows us to establish the effect of trust on loyalty through satisfaction.
As regards the effect of trust on adaptation to price, we have found no studies in the sports and fitness services sector in this regard, although we did find one study on Internet services (Giovanis and Athanasopoulou, 2018), which did not find the direct relationship shown in this study, noting instead an indirect relationship through satisfaction. Therefore, following Nyffenegger et al. (2015), we might assume that trust is a key aspect in establishing and improving relationships between customers and services, to which other elements such as emotions can be added to consolidate those relationships. The results and the existing literature confirm hypothesis 4 regarding the relationship of trust to adaptation to price.
One of the most striking results rejects hypothesis 5, noting the lack of a relationship between satisfaction and adaptation to price. Jaiswal and Niraj (2011) previously concluded that the relationship between satisfaction and behavioural intentions would be indirect, mediated by loyalty. However, in this case, there is no direct or indirect relationship between satisfaction and adaptation to price, although there is a relationship between satisfaction and loyalty (hypothesis 4). This result is paradoxical since conative variables play a mediating role in the relationship between affective and behavioural constructs (Ajzen and Fishbein, 1980), so loyalty should mediate in the relationship between satisfaction and behavioural intentions, such as the willingness to pay more (Chiou and Droge, 2006). It is highly possible that this result is due to the low affective component promoted by fitness services and specifically free activities (unsupervised by an employee of the fitness centre), the most common option among the respondents in this study, compared to other types of services in which the participation of fitness instructors and the presence of other users is possible. It is also possible that the pricing policy established by the fitness centre might also have affected this result. Thus, a policy of low prices can encourage customers to look for fitness centres with more affordable prices, and any increases in price might make them look elsewhere, even if the centre achieves acceptable scores on issues such as trust and satisfaction. Nuviala et al. (2013b) previously showed that the main reason for leaving a fitness centre is price, so centres that focus their business strategy on offering low prices will find it very hard to increase them without losing customers.
We did find a relationship between loyalty and adaptation to price, hypothesis 6. Managers of fitness centres and marketers must earn the attitudinal loyalty of users to ensure favourable behavioural intentions among customers, such as adaptation to higher prices in this case, a result that has been found elsewhere in the literature (Escamilla-Fajardo and Núñez-Pomar, 2014; Giovanis and Athanasopoulou, 2018; Jaiswal and Niraj, 2011).
6. Conclusions
Trust has been shown to be a very relevant construct among fitness centre users since it affects satisfaction, loyalty and adaptation to price. Further research is required to examine the relationships between these constructs, especially the relationship between satisfaction and adaptation to price, in other fitness centres (non-profit or profit-making), including the variable price or low-cost centre, which might condition this relationship, making this a limitation of the present study. It would also be interesting to consider external factors, such as the socioeconomic context, the profile of users or social commitment.
These results emphasise the importance of user trust in terms of their behaviours and intentions, corroborating the need to provide information to fitness managers and centres on measures and variables that affect trust, with the aim of increasing the attitudinal and behavioural variables resulting from trust and therefore fostering a positive attitude towards changes in prices. Possible measures could include all those that refer to the control and evaluation of aspects related to the improvement of physical condition or the use of various tools and resources, such as innovative technological applications, next-generation devices or the incorporation of artificial intelligence.
Contribution of authors
Conceptualization Tamayo J.A.; Methodology Fernández A. and Nuviala, A.; Software Tamayo J.A.; Validation Tamayo, J.A.; Formal Analysis Fernández A. and Nuviala, A.; Investigation Tamayo J.A.; Resources Tamayo J.A.; Data Curation Tamayo J.A.; Writing – Original Draft Tamayo J.A.; Fernández A. and Nuviala, A.; Writing – Review and Editing Fernández A. and Nuviala, A.; Visualization Tamayo, J.A.; Supervision Fernández A. and Nuviala, A.
All the authors have read and agree with the published version of the manuscript.
Statement of the ethics committee
This study was done keeping in mind international ethical guidelines, in line with the American Psychological Association (APA) standards, and it also followed the main principles from the Declaration of Helsinki. Plus, it was approved by the Andalusian Biomedical Research Ethics Committee (Minutes 04/2016).
