


The purpose of this paper is to examine millennial customer perceptions of food trucks and to identify factors that can foster their behavioral intentions pertaining to food trucks.
The study is based on a sample of 247 millennial customers of various food truck vendors in the United States and was assessed using ordinary least squares regression analysis.
Food truck image and employee friendliness were found to impact both customer satisfaction and word of mouth behavior; however, the other hypotheses were not supported.
There were two limitations. The first was that one of the constructs did not achieve the minimum average variance extracted. The second was that data collection was done in a single city in the United States; therefore, future research could overcome these limitations through a refinement of the construct’s items and targeting more cities.
There has been limited academic research on the millennial customer perceptions of the food truck phenomenon. This research addresses that gap through a field study that examines factors that contributed to the growth and popularity of food trucks among millennials
1. Introduction
The concept of street food is not new per se and has been a part of everyday life worldwide. Some countries like South Korea have encouraged a “street food culture” to complement food tourism by facilitating the growth of street food markets such as the Myeongdong Street Food Alley. However, the food truck phenomenon caught up with American customers comparatively late, around 2008, when entrepreneurial chefs started catering to the “hipster-food crowed” in cities like New York, Los Angeles and Austin (Chang, 2016). Food trucks have emerged from a thing of novelty to a source of necessity. The economic depression (2007–2009) resulted in a reduced labor force, which has increased the workload and the working hours across America (Amadeo, 2021; Bybee, 2011). This led to the introduction of a time and effort-reducing meal solution in the form of food trucks. The industry has experienced significant growth, growing 6.6% per year between 2016 and 2021, with a projected revenue of $1.2 B by the end of 2021 and over 32,000 food trucks currently operating across the United States (IBISWorld, 2021). The meteoric rise of the food truck culture has also been well documented in popular media with the Hollywood sleeper-hit movie “Chef’” or reality/cooking shows like “The Great Food Truck Race” or “Big Food Truck Tip”, all centered around food trucks.
Millennials are one of the largest customer segments within the restaurant and hospitality industry (Rauch, 2014), accounting for 21% of the consumer spending which amounts to almost $1.3 trillion dollars (Peregrin, 2015; Hendrix and Bowdish, 2012). The US Department of Agriculture’s 2014 food expenditure data further report that millennials outspent baby boomers on eating out, about 44% of their food dollars (Talty, 2016). Self-identified as the “foodie generation” (Fromm, 2014), 47% of millennials have eaten from food trucks (Coughlin, 2016). The popularity of food trucks in this group is primarily due to their “authentic and brandless” appearance to a generation that thrives on “originality and novelty” (Coughlin, 2016). They like to engage with companies that are philanthropic and use social media to develop a two-way relationship with their customers (Hendrix and Bowdish, 2012). There is also a great demand for locally grown and healthy food among millennials, who want friendly retail employees and the convenience of fast take-out (Fromm, 2014). These traits among millennials clearly explain why food trucks, with their unique food offerings, convenience, value pricing and extremely personalized service, are a big hit with this generation (Fromm, 2014).
Existing food truck research can be classified into two categories: (1) research on the food truck business including operational challenges, public policy issues or those relating to mobile kitchen health and safety codes/standards and (2) research on identifying those factors contributing to customer patronage of food trucks. So far, only a few studies (Isoni Auad et al., 2019a, b; Yoon and Chung, 2017) have examined factors that attract the millennials to food trucks, most of them using online panel data (i.e. MTurk or Qualtrics), while some international studies have used field studies to collect their data (e.g. Valente et al., 2020 in Italy; Gopi and Samat, 2020 in Malaysia; Isoni Auad et al., 2019a, b in Brazil, and Alfiero et al., 2017 in Italy again). Yoon and Chung (2017) used online panel data to examine hedonic and convenience benefits along with hygiene and environmental risks pertaining to food truck dining and how they impacted millennial choice behavior. Although these are important factors, there is still a need to identify specific food truck-related factors that create a positive attitude among millennials.
The current study contributes to the existing food truck research in three ways: (1) it supplements the knowledge gained from the Yoon and Chung (2017) study by identifying additional factors that foster the millennial customer’s patronage of food trucks in the US market, (2) it extends the stimulus–organism–response (S–O–R) theoretical framework that has been widely used in the traditional retail setting to a food truck context, and (3) it provides another approach to American food truck research by conducting a field study gathering insights from customers at food truck events/locations. Our research answers the call from Abrahale et al. (2019) about the need for more scientific research on consumption patterns pertaining to street food vendors like food trucks given their growing contribution to the economy, in general and the food service industry, specifically.
2. Literature review
2.1 The millennial customer
Those born between 1982 and 2000 are referred to as the “Millennials” or “Generation Y” (Brosdahl and Carpenter, 2011). Millennials are tech savvy with their early exposure to technology and thus make extensive use of apps and social media for their shopping decisions; and they are not shy about sharing their shopping experience with others (Peregrin, 2015; Barton et al., 2012). Healthy living is of particular importance to millennials since they prefer fresh and eco-friendly ingredients in the food they consume, which has led to the growth of new phrases such as “organic”, “farm to table” or the popularity of “locally grown and locally made” (Williams, 2016). Millennials are the largest US consumer segment for organic, locally grown food products and are very knowledgeable and conscious about ingredients listed on food labels, and are especially supportive of technologies that promote sustainability in food production (Printezis, and Grebitus, 2020). Existing academic research about the millennial customer and their retail behavior is very limited, while most of the available information is based on independent industry reports or US Chamber of Commerce survey data. Millennials are also known to try different ethnic foods, share their consumption experience with others through online and social media reviews, spend more money while eating out and consider the variety of menu items to be the deciding factor for restaurant choice (Okumus et al., 2021; Yoon and Chung, 2017). Seeking diverse tastes, millennials often order a variety of items from the same restaurant and have developed clear opinions regarding sugary and aerated drinks, artisan water, sugar alternatives and protein shakes (Saulo, 2016). Most existing studies published so far have either compared multiple generations or studied just the millennials to examine their preference for different retail attributes/formats, sources of product information, use of technology in shopping and even shopping channel preference (online versus offline) in a very broad retail context. Yoon and Chung (2017) surveyed American Midwest millennial students and found their perceptions of hygienic risks negatively impact their attitude toward food trucks while their hedonic value perceptions had a positive effect. Isoni Auad et al. (2019a, b) observed that most of the Brazilian food truck customers were millennials.
2.2 Food trucks: previous research
Shin et al. (2018) utilized goal directed behavior (Perugini, and Bagozzi, 2001) and concluded that emotional factors propelled by previous affective experiences played a prominent role behind the customers’ intention to patronize food trucks compared to cognitive factors like attitude and subjective norms. In a study on gourmet food trucks by McNeil and Young (2019), factors like service quality, brand personality, price/value and convenience were found to positively impact customer satisfaction with the food trucks. Interestingly, Shin et al. (2020) and Isoni Auad et al. (2019a, b) found that although consumers favored food trucks because of their convenient mobile locations, food taste and value, sometimes affordability of the food indicated that the food was “cheap” or “unhealthy”, and there were concerns about sanitation, limited seating and a reduced number of menu items, compared to traditional restaurants. Shafieizadeh, Alotaibi, and Tao (2021) examined ethnic food trucks operating in the United States and concluded that customer perceptions pertaining to food quality, delivery quality and food truck appearance significantly enhanced their dining experience, satisfaction and positive word of mouth (WOM) behavior. Valente et al. (2020) found that for Brazilian food truck consumers, good hygienic practices, service and food presentation were important in addition food price. In Malaysian-based food truck research, service quality dimensions significantly impacted customer satisfaction and loyalty but responsiveness had no impact (Gopi and Samat, 2020) nor did food truck reliability (Boon et al., 2018). Mohd-Ramly et al. (2019) surveyed Malaysian food truck patrons and observed that the customer’s hedonic and utilitarian value perceptions positively impacted their behavioral intentions pertaining to food truck patronage. Alfiero et al. (2017) studied food truck operations in Italy and concluded that food trucks can increase their effectiveness by sourcing quality raw materials, paying attention to hygiene, adopting biodegradable packaging and reducing sales price. Use of locally sourced and organic ingredients in food preparation, in spite of their availability challenges, led to an increase in consumer patronage, increased the novelty of menu items and improved the competitiveness of Toronto-based food trucks (Holmes et al., 2018). Dolberth Dardin et al. (2019) further developed an elaborate checklist comprising eight categories to evaluate hygiene practices in Brazilian food trucks.
2.3 Theoretical framework
Recent food truck research examined consumer intentions to visit food trucks under the Theory of Planned Behavior and the Theory of Reasoned Action frameworks (Yoon and Chung, 2017; Ajzen, 1985; Ajzen and Fishbein, 1975) where it was concluded that hygienic and environmental risks and hedonic value benefits pertaining to food truck dining significantly impacted the consumption experience (Yoon, and Chung, 2017). Using the model of goal-directed behavior (Perugini, and Bagozzi, 2001), Shin et al. (2018) observed that psychological variables such as subjective norm, perceived behavioral control, and past food truck-related behavior affects the consumers’ desire and intention to visit food trucks. Shafieizadeh, Alotaibi, and Tao (2021) further showed the positive impact of perceived ethnic food truck authenticity on the consumers’ dining satisfaction using the tenets of expectancy-disconfirmation theory (Oliver, 1980). The focus of our study is to understand how different cues related to food truck experience impact customers’ patronage intentions and adopts the S–O–R framework proposed by Mehrabian and Russell (1974) that posits that the different social and physical cues in an environment impact a person’s emotional orgasmic state that then affects their behavioral state. The S–O–R paradigm deals with the impact of environmental cues (i.e. service, atmospherics or crowding) on an individual’s approach or avoidance response (Vieira, 2013). This paradigm has been widely used in marketing studies on consumer reactions to pleasure and arousal from retail and service cues. For example, the pleasure derived from the physical environment in a retail store influenced store patronage intentions and spending (Baker et al., 1992), hedonic and utilitarian value perceptions (Babin and Darden, 1995), retail sales (Milliman, 1982), and store interaction and exploration (Ridgway et al., 1989). Wall and Berry (2007) utilized the S–O–R paradigm to illustrate the impact of the physical environment (mechanic clues) and employee behavior (humanic clues) in increasing the consumer’s quality perceptions in the context of fast-casual restaurants. In the context of the present study, factors such as employee friendliness, food truck image, perceived crowding and food quality would serve as environmental cues stimulating the emotional state of the millennial customers leading to positive behavioral responses.
2.4 Selection of study constructs
Past research on restaurants and tourism sectors have identified several factors to consider, including customer wait time, store image attributes, pricing, employee friendliness, hedonic and utilitarian shopping value, location, operating hours, food quality and nutrition value, and crowding (Gopi and Samat, 2020; Shin et al., 2020; McNeil and Young, 2019; Martin- Ruiz et al., 2012; Mattila and Wirtz, 2008; Sulek and Hensley, 2004; Kara et al., 1995; Baker et al., 1992). Our research design used a “phenomenological approach” to reduce this extensive list of factors to a more manageable number (Groenewald, 2004). The authors sought to further understand this “social and psychological phenomena” (Welman and Kruger, 1999, p. 189) by capturing the perspectives of those involved with the food truck industry and discovering an alternative theoretical framework. Following our review of comparable industry and contextual literature, we also conducted unstructured interviews with nine food truck vendors/owners in the United States to learn about the critical industry considerations, along with those factors deemed to be responsible for the unprecedented growth in popularity of food trucks. Based on that, we decided to study the following factors discussed in the next few sections.
2.4.1 Food truck image
Martineau (1958) originally conceived of the store image construct as a combination of functional and atmospheric retail attributes that formulates imagery in the mind of the customer. In the context of food trucks, image and psychological attributes include cleanliness, menu selection, checkout waiting time, price and service offered. Previous research has shown store image to have a significant positive impact on the consumers’ purchase intentions (Wu et al., 2011). Customers are known to evaluate a store by combining all of its image attributes to decide on how satisfied they are with the store (Pan and Zinkhan, 2006). Factors related to physical surroundings in a store such as aroma, temperature, cleanliness, internal/external store lighting, table layout and settings, and service, along with human aspects such as the demeanor of service/wait staff play a key role in formulating positive consumer attitude and store patronage intentions (Qin and Prybutok, 2008; Ryu and Jang, 2008). Research on food trucks further showed consumer preference for good hygienic practices, food presentation, biodegradable packaging and service over price (Shafieizadeh et al., 2021; Valente et al., 2020; Alfiero et al., 2017).
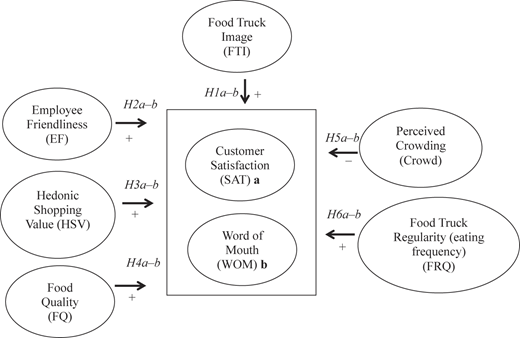
Food truck image has a direct positive impact on (H1a) customer satisfaction and (H1b) WOM behavior.
2.4.2 Employee friendliness
When it comes to generating customer satisfaction, the important role of frontline employees cannot be denied. The employee’s friendly behavior improves the service outcomes in a myriad of ways, especially by enhancing the customer’s perception of quality, and increasing customer satisfaction and loyalty (Kattara et al., 2008; Hartline and Farrell, 1996; Jones and Dent, 1994). The ability of the employees to meet customer needs improves the image of the business (Jang et al., 2015). Speed of service, attentiveness of staff, novelty and variability of menu items are some of the main reasons for a customer’s preference for a certain restaurant (Mattila and Wirtz, 2008; Kara et al., 1995).
Employee friendliness has a direct positive impact on (H2a) customer satisfaction and (H2b) WOM behavior.
2.4.3 Hedonic shopping value
Hedonic value refers to the multisensory, fantasy and affective aspects of a shopping experience. For the food truck experience, it includes the consumption rituals involved while visiting a food truck (e.g. standing in line at a food truck venue) and social consumption through chatting with fellow visitors about the menu, and even engaging with favorite food trucks in social media. Food truck vendors hope that the social media engagement means these are regular customers who post positive reviews and menu recommendations, and/or refer the food truck to others. The result is that food consumption from a food truck generates a consumption process that is more of a personal, fun and social affair (Arnold and Reynolds, 2012; Ryu et al., 2010). Findings from panel data studies related to global food truck consumption also provide evidence that customers derive hedonic value from their dining experience at food trucks which, in turn, increases their patronage intentions and loyalty toward those trucks (Mohd-Ramly et al., 2019; Shin et al., 2019; Yoon and Chung, 2017).
Hedonic shopping value has a direct positive impact on (H3a) customer satisfaction and (H3b) WOM behavior.
2.4.4 Food quality
Product quality is one of the key antecedents to customer satisfaction (Ziethaml et al., 1996). In the context of hospitality, food is the core product and thus, existing restaurant and tourism research has concluded that its quality is one of the most important factors of customer satisfaction that cannot be substituted by any other factors, (Qin and Prybutok, 2008; Law et al., 2004; Kivela et al., 1999; Johns and Howard, 1998). Quality of the food, indicated by its freshness, visual appeal, aroma, novelty, serving size and with today’s millennial customer – responsibly sourced and preferably organic ingredients, can foster consumer patronage and WOM behavior in both fine and casual dining restaurants (Parsa et al., 2012; Clark and Wood, 1998).
Han and Hyun (2017) examined hotel-restaurants and observed that the positive image of the restaurant not only affected consumer behavioral intentions but also had an impact on the food quality perceptions, which in turn also contributed to consumer patronage of the business. The food truck evolution in the American market is not just about offering convenience to lunch customers, but owners also thrive on being innovative by providing novelty and variability in their menu items in a very competitive market. Thus, based on existing hospitality research findings and existing trends related to food truck menus that are fresh and healthy, we propose a positive relationship between the quality of food served by the food trucks and consumer satisfaction and their WOM behavior.
Food quality has a direct positive impact on (H4a) customer satisfaction and (H4b) WOM behavior.
2.4.5 Perceived crowding
Perceived crowding is conceptualized as spatial crowding, dealing with the lack of physical space in a venue, and social crowding that pertains to the human aspect of crowding (i.e. the number of customers present inside a venue and their rate of interactions) (Jang et al., 2015). Food service industry research has shown that a restaurant’s lack of efficient wait time management may cause disgruntled customers who make a hasty exit, may create negative WOM publicity, and under normal circumstances, likely would not consider a revisit (Choi and Sheel, 2012; Lee and Lambert, 2006). When it comes to food trucks, it is quite common to see a long line of customers during lunch/dinner hours. The average wait time observed in the current study was around 8–10 min, which included time standing in the line to order through the point that the customer received their food. Wait time varies depending on how many customers show up together and on the complexity of the order given; however, the customers seem to appreciate the made-to-order concept since freshness and flavor cannot be pre-packaged. Crowding due to waiting customers drastically increases at food truck events especially during peak service hours.
Perceived crowding has a direct negative impact on (H5a) customer satisfaction and (H5b) WOM behavior.
2.4.6 Food truck regularity
Every business would love to have loyal customers who regularly patronize the business, and restaurants are no exceptions. Restaurants offer loyalty programs to entice customers to visit them regularly. An example is the successful Starbucks loyalty program, which awards “stars” for each purchase, which can be used for future purchase discounts. In an online business setting, Kim et al. (2004) examined business trust and found that repeat customers and customer satisfaction levels had a significant impact.
Food truck regularity (eating frequency) has a direct positive impact on (H6a) customer satisfaction and (H6b) WOM behavior.
2.4.7 Customer satisfaction
Oliver (1981) defines satisfaction as “the psychological state arising from an emotional state applied amidst an expectation by virtue of an acquisition that comes to compound with the feelings of the consumer.” Satisfaction has been showed to impact firm profitability such that higher levels of satisfaction lead to increased levels of profitability (Rossi and Slongo, 1998). Researchers found that food quality and variety, restaurant ambience and wait time significantly impacted customer satisfaction (Okada and Hoch, 2004; Dube et al., 1994), and Tripathi (2017) argues that customer satisfaction is the core of creating sustainable competitive advantage for firms.
The marketing literature considers satisfaction as a central concept (Oliver, 1997). Rust and Oliver (1994) view satisfaction in evaluative terms as a customer’s expectations being fulfilled by the organization. Customers have expectations about service and products from the firm. They get dissatisfied and stop patronizing the organization if the organization fails to meet those expectations. Hence, the marketing literature gives paramount importance to customer satisfaction. Geyskens et al. (1999) view customer satisfaction as an important antecedent variable for developing long-term marketer customer relationships. Hence, food trucks that want to build a loyal customer base cannot ignore customer satisfaction. They have to do their level best to satisfy their customers and to retain them.
2.4.8 Word-of-mouth behavior
Arndt (1967) defines WOM as “oral, person-to-person communication between a receiver and a communicator.” Since Internet marketing and social media marketing have had phenomenal growth in recent years, businesses are increasingly focusing on online/electronic WOM (Babic Rosario et al., 2016). WOM has been found to have a big impact on firm revenue. For example, Duan et al. (2008) found that Yahoo movie reviews have a significant impact on a movie’s box office sales.
WOM and electronic word of mouth (e-WOM) have emerged as a very critical factor in determining customer attitudes and behavior toward restaurants (Lu et al., 2013). Trusov et al. (2009) report that when a firm gets its customers through e-WOM, they are more profitable to the firm in the long run than those customers who were recruited through traditional marketing channels. In a “fine dining with wine” restaurant setting, Cassar et al. (2020) argue that reviews of satisfied customers that are posted in social media sites like Tripadvisor.com are becoming a major factor in influencing the decisions of other potential patrons, both locals and tourists. In a restaurant setting, Tripathi (2017) found that customer satisfaction leads to WOM in the sense that satisfied customers provide positive WOM about the restaurants to other potential customers.
Based on our discussion of the chosen study constructs, we propose and test the following hypotheses that examine the impact of the aforementioned constructs on customer satisfaction and WOM behavior (see Figure 1).
3. Methodology and hypothesis testing
A major mid-western American city was the setting for data collection with the active support of the local food truck association, which helped to secure permission from most food truck owners operating in the city for data collection at their food truck (i.e. intercept and collect data from patrons waiting to initiate or receive their order). There were 16 food trucks in operation during the time of data collection. The association also organized food truck events monthly and the researchers used these events to ask customers to complete our survey which was a self-administered survey instrument. Respondents who fit the profile of a millennial customer were visually targeted.
At final count, the authors had 247 usable surveys, of which 62% were females with an average respondent age of 20.84 years (due to larger number of younger participants that completed surveys at food truck events); and 56.7% of our respondents had an annual income of less than $50,000. When the authors asked about how often the customer ate at a food truck, 24.1% of respondents said once a week and 57.9% of respondents ate at food trucks twice a week. The internal reference price of the respondents for a food truck meal was $6.50 with a standard deviation of $1.95.
3.1 Measures
Measures for the five antecedent factors were adopted and modified from the existing literature on the hospitality and food industries. The items used in this study were assessed using a 7-point Likert scale with end points of Strongly Disagree to Strongly Agree (See Table 1 for each construct’s items).
Study scales: reliability and validity test results
| Items | t-value | Standardized coefficient | |
|---|---|---|---|
| Customer satisfaction (Ryu et al., 2010) (AVE = 0.74, α = 0.85) (Mean = 6.35, SD = 0.77) | |||
| SAT1 | I was delighted with the service provided | 17.43 | 0.86 |
| SAT2 | I was happy with the service provided | 31.33 | 0.86 |
| SAT3 | I was satisfied with the service provided | 47.63 | 0.91 |
| Food truck image (Theodoridis and Chatzipanagiotou, 2009; Wu et al., 2011; Min and Min, 2011) (AVE = 0.56, α = 0.84) (Mean = 5.88, SD = 0.83) | |||
| FTI1 | Food truck cleanliness | 12.43 | 0.72 |
| FTI2 | Variety and selection of food | 7.92 | 0.66 |
| FTI3 | Checkout waiting time | 9.30 | 0.70 |
| FTI4 | Everyday overall food quality | 20.98 | 0.80 |
| FTI5 | Everyday overall food prices | 18.87 | 0.78 |
| FTI6 | The quality of service offered by the food truck | 32.31 | 0.82 |
| Food quality (Qin and Prybutok, 2008; Kara et al., 1995) (AVE = 0.53, α = 0.72) (Mean = 4.05, SD = 1.08) | |||
| FQ1 | This food truck provides a nutritionally balanced diet | 9.03 | 0.73 |
| FQ2 | This food truck uses fresh ingredients | 12.90 | 0.78 |
| FQ3 | This food truck uses natural/organic ingredients | 5.16 | 0.73 |
| FQ4 | This food truck uses a healthy cooking method | 5.51 | 0.67 |
| Hedonic shopping value (Ryu et al., 2010; and Yu et al., 2011) (AVE = 0.45, α = 0.78) (Mean = 4.31, SD = 1.35) | |||
| HSV1 | This trip to the food truck was truly a joy | 17.94 | 0.84 |
| HSV2 | This trip to the food truck truly felt like an escape | 7.71 | 0.76 |
| HSV3 | I enjoy eating exciting foods | 5.16 | 0.57 |
| HSV4 | During the trip, I felt the excitement for the hunt for a bargain | 2.02 | 0.36 |
| HSV5 | While dining, I was able to forget my problems | 6.18 | 0.72 |
| HSV6 | While dining, I felt a sense of adventure | 5.15 | 0.65 |
| Perceived crowding (Mattila and Wirtz, 2008) (AVE = 0.85, α = 0.71) (Mean = 3.00, SD = 1.27) | |||
| Crowd1 | This food truck dining location seemed very crowded to me | 3.03 | 0.74 |
| Crowd2 | This food truck was a little too busy | 6.05 | 0.96 |
| Employee friendliness (Kara et al., 1995; Kattara et al., 2008) (AVE = 0.82, α = 0.79) (Mean = 6.39, SD = 0.80) | |||
| EF1 | Friendliness of employees | 22.20 | 0.90 |
| EF2 | How well the food truck’s employees listen to my needs | 54.51 | 0.92 |
| Word of mouth (Li, 2013) (AVE = 0.83, α = 0.90) (Mean = 6.41, SD = 0.77) | |||
| WOM1 | I would recommend this food truck to someone who seeks my advice | 55.62 | 0.92 |
| WOM2 | I Say positive things about this food truck to other people | 38.22 | 0.91 |
| WOM3 | I would recommend this food truck to others | 24.49 | 0.90 |
Note(s): FRQ is a single item construct, so is not included in this table
We examined works that have been referenced extensively in various Hospitality, Tourism, and Marketing-related journals. Below we briefly address key sources for our survey items using already validated scales. For example, a modified versions of the customer satisfaction and hedonic shopping value scales were sourced from Ryu et al. (2010) who used it for their fast-casual restaurant study. A modified version of the food truck image scale was sourced from Theodoridis and Chatzipanagiotou (2009) who used it to measure store image in a supermarket setting. Generally it is used to measure store image in varied settings like drugstores (Wu et al., 2011) and fast-food restaurants (Min and Min, 2011). A modified version of the food quality scale was sourced from Qin and Prybutok (2008) who used it to measure food quality in a fast food restaurant setting. The perceived crowding scale was sourced from Matilla and Wirtz (2008). This scale was used in a variety of retail outlets like cosmetics shops and big furniture stores like IKEA. The modified version of the employee friendliness scale was sourced from Kattara et al. (2008) who used it in a five-star hotel setting. The modified version of the WOM scale was sourced from Li (2013) from a study in a higher education setting.
We tested the reliabilities of study constructs using Cronbach alpha and all were above the 0.7 level recommended by Nunnally (1978). Additionally, correlation analysis indicated that the study variables are correlated in the hypothesized direction. In particular, the correlations between the dependent variables (e.g. satisfaction and WOM) and the independent variables food truck image and employee friendliness are above the 0.60 level and are significant. The correlation between the other independent variables (except crowding), are in the 0.24–0.88 range, but is still significant (See Table 2). The correlation between crowding and employee friendliness, hedonic shopping value, WOM, and food quality were not significant. It had significant correlations with other study variables like food truck image, food truck regularity and satisfaction (see Table 3).
Inter-correlations of study variables
| FTI | EF | HSV | FQ | Crowd | SAT | WOM | FRQ | |
|---|---|---|---|---|---|---|---|---|
| FTI | ||||||||
| EF | 0.66* | |||||||
| HSV | 0.41* | 0.41* | ||||||
| FQ | 0.41* | 0.30* | 0.34* | |||||
| Crowd | 0.17* | 0.00 | 0.03 | 0.03 | ||||
| SAT | 0.73* | 0.74* | 0.33* | 0.33* | 0.77* | |||
| WOM | 0.68* | 0.70* | 0.28* | 0.26* | 0.01 | 0.88* | 0.31* | |
| FRQ | 0.32* | 0.24* | 0.02 | 0.27* | 0.57* | 0.25* | 0.31* |
Note(s): FTI = Food Truck Image; EF = Employee Friendliness; HSV = Hedonic Shopping Value; FQ = Food Quality; Crowd = Perceived Crowding; FRQ = Food Truck Regularity; SAT = Customer Satisfaction; WOM = Word of Mouth Behavior
*Correlations were significant at the p < 0.05 level
Hypotheses testing: regression equation beta and t-values
| Hypotheses | Satisfaction (a) | Word of mouth (b) | |||
|---|---|---|---|---|---|
| β | t | β | t | ||
| H1 | Food truck image | 0.30 | 3.06* | 0.24 | 2.33* |
| H2 | Employee friendliness | 0.44 | 5.08* | 0.31 | 3.36* |
| H3 | Hedonic shopping value | −0.06 | −0.34 | −0.03 | −0.70 |
| H4 | Food quality | −0.09 | −1.48 | −0.06 | −0.50 |
| H5 | Perceived crowding | −0.06 | −0.74 | −0.08 | −0.81 |
| H6 | Food truck regularity | 0.09 | 0.28 | −0.15 | 2.14* |
| R square | 0.49 | 0.42 | |||
Note(s): *significant at p < 0.05 level
Study measures were evaluated for convergent and discriminant validities using Fornell and Larcker’s (1981) criteria. Confirmatory Factor Analysis is a procedure to validate the study constructs. The validation procedure includes two validity tests, namely convergent and discriminant validity. Convergent validity is defined as the evidence that different methods or tests developed to measure the same trait all measure the same construct (Zhu, 2000). Discriminant validity ensures that the measures used in the study are unique and represent the construct of interest that other measures in the study model do not capture (Hair et al., 2010).
The average variance extracted (AVE) of all the constructs except hedonic shopping value (AVE = 0.45) was higher than the 0.50 threshold recommended by Fornell and Larcker (1981) indicating that except for hedonic shopping value, all constructs exhibit convergent validity. To assess discriminant validity, each construct’s AVE was compared to its squared correlations with other variables in the model. This indicated that except for Satisfaction and Food Truck Image, all other constructs exhibit discriminant validity.
3.2 Hypotheses testing
The authors used OLS regression analysis to test the study hypotheses over two models each with a different dependent variable. Ordinary least squares regression (OLS) estimates the relationship between one or more independent variables and a dependent variable. It estimates this by creating a line that best fits the given data by minimizing the residuals (Wilson et al., 2015).
Regression model 1 (DV: Customer Satisfaction (SAT)) results indicated that the study variables explained 49% of the variance in the dependent variable. H1a which hypothesized that food truck image had a positive impact on satisfaction was supported (t = 3.06, p < 0.05). H2a which hypothesized that employee friendliness had a positive impact on customer satisfaction was supported (t = 5.08, p < 0.05); however, the other hypotheses were not supported.
Regression model 2 (DV: WOM) results indicated that the study variables explained 42% of the variance in the dependent variable. H1b which hypothesized that food truck image had a positive impact on WOM was supported (t = 2.33, p < 0.05). H2b which hypothesized that employee friendliness had a positive impact on WOM was supported (t = 3.36, p < 0.05). H6b, which hypothesized that food truck regularity had a positive impact on WOM was significant, but not in the direction hypothesized; and the other hypotheses were not supported.
4. Discussion of results
Food truck image, employee friendliness and food truck regularity were the three factors that were found to impact the dependent variables of millennial customer satisfaction and WOM behavior based on the results of the current study. Our findings draw support from the S–O–R theoretical framework since a combination of humanic clues (employee friendliness) and functional-mechanic clues (food truck image) emerged to be deciding factors for millennial patronage of food trucks. Millennial customers reacted positively to employee friendliness, which was found to impact both customer satisfaction and WOM behavior. This finding is in line with existing retail and hospitality research where employee behavior, especially their friendliness, helpfulness and courtesy positively impacts the customer’s behavioral intentions (Boninsegni et al., 2021; McNeil, and Young, 2019; Liu and Tse, 2018). Food truck image had a significant positive impact on both consumer satisfaction and WOM which agrees with the existing research (Shafieizadeh et al., 2021; Liu and Tse, 2018; Alfiero et al., 2017; Qin and Prybutok, 2008). Those new to food trucks use observable signals related to food truck image in the lines of S–O–R framework to form their perceptions along with factors such as cleanliness, food variety, service quality, food cost and service speed when selecting a restaurant (Okumus et al., 2021). Finally, frequent food truck diners were found to have a negative impact on WOM behavior, which means as customers become more familiar with a food truck, they stop referring to it in their social circle. This finding was surprising but gets support from the seminal study by Anderson (1998) which concluded the customers engage in WOM when they are either highly satisfied or highly dissatisfied. The food truck regularity construct had no significant impact on customer satisfaction. This observation may indicate that after their initial excitement and the affective reaction to this novel dining experience, their feelings plateaued, as is evident in our results, in spite of their frequent food truck visits.
Three of the study constructs (e.g. food quality, hedonic shopping value and perceived crowding) were not significant for either of the dependent variables. There was no negative impact of crowding which indicates that the millennial customers expected and accepted crowding at food truck service locations, including special events. The customer acceptance of crowding with no negative consequences can be best explained using attribution theory (Bitner, 1990; Weiner, 1985), which indicates that food truck customers have concluded that food truck vendors are not responsible for the wait time or the crowding that might occur. Hedonic shopping value was not significant for either dependent variable. This is contrary to findings related to food truck services which found a positive impact of hedonic value on consumer behavioral intentions (Mohd-Ramly et al., 2019; Shin et al., 2019; Yoon and Chung, 2017). However, this study’s results are consistent with the Okumus et al. (2021) study, which concluded that restaurant attributes like ambience, having a new experience, noise and crowd level are inconsequential for the millennial diner when choosing a restaurant. Surprisingly, just like hedonic shopping value, food quality did not have any impact on consumer behavioral intentions, contrary to the existing hospitality literature, which establishes a strong relationship between the nature of food served and consumer satisfaction (e.g. Ryu and Han, 2010). McNeil and Young (2019) did observe a similar relationship where food quality did not impact consumer satisfaction with gourmet food trucks, which was again reinforced by our findings pertaining to millennial preferences.
5. Implications
Findings from our study identified food truck image as one of the factors important to millennials regarding their food truck dining decision. Thus, it is essential for food truck operators to not only maintain the image attributes but also monitor the millennial customers’ existing perceptions about their truck for any undesirable changes and/or opportunities for improvement. Several food truck studies have identified cleanliness and hygiene practices as important parameters for evaluating the food truck dining experience. Food truck vendors should adhere to the different hygiene codes not only for renewal of operating license but also to reassure their millennial customers that their initiatives are not only hygienic but environmentally friendly. Other sustainability strategies such as the use of recycled packaging/cutlery would also shed a positive light on the food trucks and could be further promoted on the food truck’s website or social media platforms to advertise their environmental initiatives.
A food truck employee, just like any frontline retail employee, plays a significant role in creating a connection with the customer that contributes to the survival and growth of the business. Typically no more than two or three employees work in a food truck, so there is a high degree of frontline employee–customer interaction. This helps nurture familiarity and trust; and in the case of food truck “regulars”, the employees often called them by name and remembered their food preferences. With this high degree of personal attention, customers feel both special and satisfied as is evident in our findings. To improve customer satisfaction, food truck owners should invest in training to encourage employee friendliness, thus impacting WOM favorably along with encouraging staff to use social media to continue that engagement after service hours. It is also important for the food truck owners to reduce employee turnover since that will impact the relationships already in place.
Food truck operators should nurture a continuous relationship with their customers by providing consistent menu offerings, service and attention in order to positively impact their feeling of satisfaction along with patronage intentions, and further encourage them to indulge in positive WOM publicity. This could be achieved by offering incentives like discounts, loyalty programs or even recognition of loyal customers in official social media channels which might motivate customers to continuously promote their favorite food trucks. It would also be wise for food truck vendors to investigate crowd management techniques and reduce wait time as food trucks become more common, leading to a change in the crowding perceptions of customers who might have a negative reaction to long wait times.
Finally, studies like Shin et al. (2020), Valente et al. (2020), Isoni Auad et al. (2019a, b) and Yoon and Chung (2017) also support the importance of quality-related factors like freshness and organic sourcing. Thus, it is important for the food truck owners to promote the ingredients used, while maintaining safe food handling practices. Occasional collaboration with local farmers and offering “seasonal” menu options while being parked at a farmers market or at a festival would generate a lot of “buzz” among local enthusiasts of “farm to table” movement and help draw a steady inflow of diners looking for fresh, organic gastronomic options and help support local businesses.
6. Limitations and future research
Food trucks are a relatively new phenomenon, and our study was an attempt to uncover some of the behavioral antecedents that resulted in the growing popularity of this phenomenon among millennial customers. One limitation of our study is that the average variance explained for the hedonic shopping value construct (AVE = 0.45) was not up to the 0.50 threshold specified by Fornell and Larcker (1981). We acknowledge this is a limitation to our study results. Another limitation is that our findings are based on millennial customers from one American city and might lack generalizability. There is a need to conduct more field studies across other American markets to observe the trends of millennial customers and their benchmarks in evaluating food trucks. Established retail research areas such as service convenience (Berry et al., 2002), retail branding and promotion strategies, atmospherics, wait time management and strategic supply chain management issues should be examined in the context of food trucks to complement existing food truck benchmarking studies in European and Latin American. Furthermore, researchers should also evaluate other food truck improvement opportunities. For example, Ferraris et al. (2021) argued that food companies (e.g. food trucks) can improve their performance by capitalizing on innovative practices/offerings, which can be accomplished most effectively when the food truck entrepreneur’s own ideas are combined with external market knowledge (Bresciani et al., 2017; Santoro et al., 2017). Therefore, future research may also evaluate the market information that the food truck entrepreneurs could employ to make decisions regarding food choice or selling locations.
The success of the food truck phenomenon has brought about additional opportunities for food truck owners (e.g. adding trucks or expanding into a brick-and-mortar facility in addition to their food truck). It has also been observed that many restaurant chains and family-owned fine/casual dining restaurants have added a food truck to their retail portfolio to capitalize on this fast-growing retail food service market. It will be interesting to see if consumers react favorably to a brick-and-mortar extension of a food truck brand or vice versa, especially if the brand equity generated from a mobile/brick-and-mortar presence can extend to a new retail format. Future research can examine whether the brick-and-mortar extension of a food truck brand can hurt its organic/novel identity that so strongly appealed to the millennials.
The authors would like to thank Brian Hardesty, Joel Crespo, Jeff Pupillo, Bob Komanetsky, Nadia Tenorio, and St. Louis Food Truck Association for their continual support and assistance for this research project.

