

Notation
1 Introduction
The risk of subsidence after the realization of large subway systems represents a relevant economical issue for the construction industry. A systematic damage assessment is essential to protect all the structures and services near the excavation, with a special attention to heritage buildings. In order to perform a rational assessment of the properties potentially affected by tunnelling operations, buildings are traditionally monitored by means of expensive in-situ installations. Examples of monitoring systems are Precise Levelling Prisms (PLP), British Research Established (BRE) sockets and Robotic Total Stations (RTS) (Burland et al., 2001; González Martí et al., 2015; Korff and Kaalberg, 2014). Due to the high cost for the installation and the maintenance of these instruments, only a limited number of points on buildings are typically monitored (DeJong et al., 2019). As a consequence, the first level of the assessment is conventionally based on a greenfield assumption for the settlement profile (Burland, 2012; Crossrail, 2011) and the final damage prediction tends to overestimate the actual damage level.
Over the last two decades, radar scientists have been developing advanced algorithms to process Interferometric Synthetic Aperture Radar (InSAR) data, enabling measurement of the temporal evolution of different events, like earthquakes, Volcanoes eruptions (Salzer et al., 2017), landslides and human-induced processes (Di Martire et al., 2014; Milillo et al., 2016; Yun et al., 2015). Among this new generation of InSAR techniques, the Multi Temporal InSAR (MT-InSAR) approach is capable of providing information about the deformations in time for a high density of points located on structures and ground surfaces (Ferretti et al., 2001), with a level of resolution suitable for damage assessment applications. Several studies (Arangio et al., 2014; Cerchiello et al., 2017; Peduto et al., 2017; Tapete and Cigna, 2012) have demonstrated the capability of these techniques to detect the spatial and temporal distribution of displacements in urban areas. Milillo et al. (2018), Perissin et al. (2011) and Pratesi et al. (2015) have recently shown that multi temporal measurements provide a dense set of displacements not accessible with traditional precise levellings. Giardina et al. (2019) compared ground scatterers displacements with the measurements acquired by PLP to verify the quality of MT-InSAR data, validating an assessment approach based on the MT-InSAR measurements.
This paper presents a semi-automatic procedure utilizing InSAR-measured displacements for assessing the potential damage of buildings affected by the tunnel excavation. COSMO-SkyMed SAR data have been used to evaluate the settlement-induced deformations of 416 buildings along the Crossrail twin tunnels in London. The assessment highlights the benefits of this approach for investigating the building influence on the structural deformations induced by tunnelling.
2 Methodology
2.1 Multi-Temporal InSAR
The Multi-Temporal InSAR (MT-InSAR) is a remote sensing technique, developed in the late 1990s to improve the traditional SAR Interferometry. By using long stacks of SAR images, this technique allows to measure the temporal and spatial evolution of deformations affecting ground surfaces and structures (Crosetto et al., 2005; Ferretti et al. 2000). The processing technique used for retrieving relative displacements from the large set of SAR acquisitions is called Persistent (or Permanent) Scatterer Interferometry (PSI) and it is based on the identification of pixels showing amplitude stability over a sequence of interferograms (Ferretti et al., 2001). By searching elements on the ground (referred to as Permanent Scatterers, PS) which provide stable radar reflections back to the satellite, the PSI techniques allow mapping of superficial deformations over wide areas with a high spatial resolution. The possibility of this technique to achieve a millimeter sensitivity on a single displacement measurement has been proved by Ferretti et al., 2007 and Fornaro et al., 2013. In addition, the physical nature of persistent scatterers makes the PS techniques especially effective in urban areas.
In this work, the monitoring of building displacements due to the Crossrail tunnelling project in London was performed exploiting a set of spaceborne SAR data acquired through the COSMO-SkyMed system (Milillo et al., 2018). A total of 72 SAR images from April 2011 to December 2015 were processed with a MT-InSAR technique using the SARPROZ software package (Perissin et al., 2011). The available dataset focuses on a 25 km2 area in the central London, between the stations of Paddington and Farringdon, and was used to generate the cumulative displacements map shown in Figure 1. Negative values, indicating subsidence, correspond to the PS moving away from the space-borne sensor, while positive values refer to displacements towards the satellite. In the presented case, orange and red scatterers highlight the ground settlement above the twin tunnels.
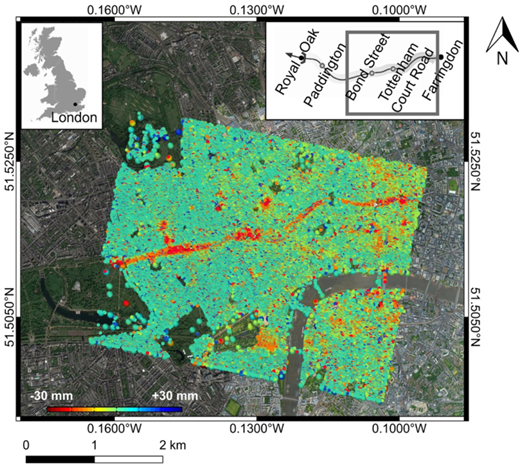
Cumulative displacement map over the Crossrail alignment in central London. The monitored area, between Paddington and Farringdon stations, corresponds to a sub-area of the Drive X section.
Cumulative displacement map over the Crossrail alignment in central London. The monitored area, between Paddington and Farringdon stations, corresponds to a sub-area of the Drive X section.
2.2 Semi-automated assessment procedure
This section presents a semi-automated procedure exploiting the MT-InSAR approach for analyzing the settlement-induced damage to buildings adjacent to excavations. The procedure is based on a multidisciplinary approach involving the use of satellite radar interferometric data, geotechnical information and databases of building features.
The Crossrail alignment is characterized by two tunnels of 7.18 m diameter and a variable depth reaching a maximum of 40 m. Values of the tunnel depth z and soil parameters have been linearly interpolated in order to establish a precise correspondence between the monitored structures and the local geometry of the tunnels. A volume loss of 0.7% has been adopted across all the analysis, according to the observations presented in DeJong et al. (2018). Figure 2 shows the tunnel geometry and deformation parameters for a typical settlement trough.
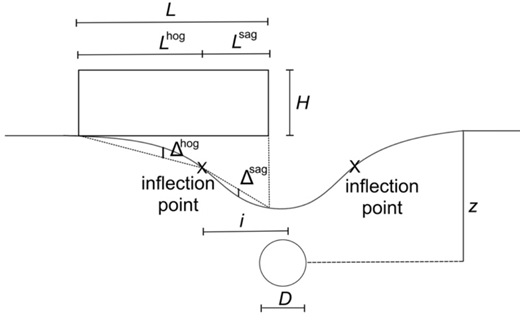
Typical profile of a tunneling-induced settlement trough.
The building data used in the analysis have been obtained from the inventory maps provided by Crossrail. The database shows the construction material, the foundation type and the age of construction of most of the edifices along the Crossrail route. Based on this information, different classes of residential structures have been identified and recorded in the form of different layers in a Geographic Information System. Then, an overlay-based procedure has been implemented to merge the different building features and identify structural aggregates.
The developed tool receives as an input any information related to the tunnel geometry, building properties and the set of InSAR measured displacements. The algorithm is able to relate the diverse information and to implement the damage assessment for the structural aggregates within the monitored area. According to the semi-empirical model proposed by Burland and Wroth (1974), each block of connected buildings is schematized as a linear elastic beam of length L, height H and unit thickness. A unique value for the material parameter (E/G = 2.6) has been adopted for all the structures, but more detailed procedures could be implemented in the future.
The procedure consists in two main steps. The first part of the algorithm is based on a greenfield assumption (i.e. the tunnelling-induced settlement profile is evaluated disregarding the influence of surface structures). The Gaussian settlement trough proposed by Peck (1969) is applied to the building equivalent linear elastic beam to calculate the deflection ratios Δ/L in hogging and sagging (Figure 2). Since most of the monitored buildings are affected by two tunnels, each tunnel is assumed to generate a Gaussian shaped settlement, and their effect is then combined (Crossrail, 2011). The possible configurations given by the combination of the two tunnels are shown in Figure 3. Then, according to Burland and Wroth (1974), Timoshenko’s equations (Timoshenko, 1957) are used to calculate the bending strain, ɛb, and the shear strain, ɛd, of the beam, distinguishing between the sagging and hogging deformation. In the end, critical strains, ɛ, are determined for each structure. The critical strains provide an indication of the damage potentially affecting the building.
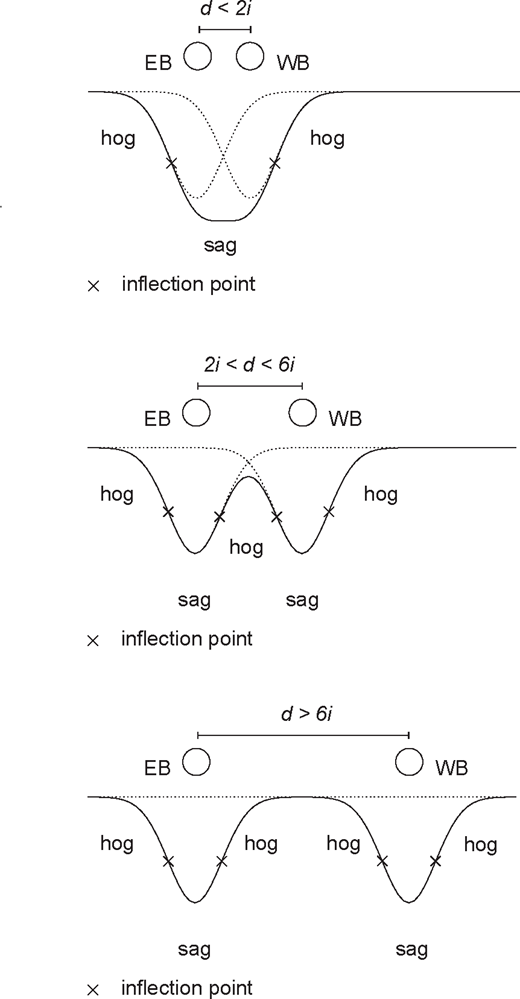
Settlement trough combinations for two tunnels (Crossrail, 2011; after Giardina et al., 2019).
Settlement trough combinations for two tunnels (Crossrail, 2011; after Giardina et al., 2019).
The second part of the algorithm exploits the building displacements measured by means of the MT-InSAR technique. Permanent scatterer points are interpolated and used to generate the settlement trough for each building, based on a modified Gaussian function (see Giardina et al., 2019, for further details). Then, the building settlement trough is used to calculate deflection ratios and critical strains, adopting the approach proposed by Burland and Wroth (1974). This curve, derived from the MT-InSAR building displacements, contains information about the soil-structure interaction and allows a more direct approximation of the maximum strains of the building using the collected data and an equivalent beam model. Finally, the tool interfaces with a Geographical Information System and results are visualized in the form of damage maps.
3 Results
The monitored area includes 1036 edifices, consisting of load bearing masonry buildings and concrete framed structures, built in different ages and relying on different foundation types. Figure 4 shows the distribution of these features for the buildings along the route.
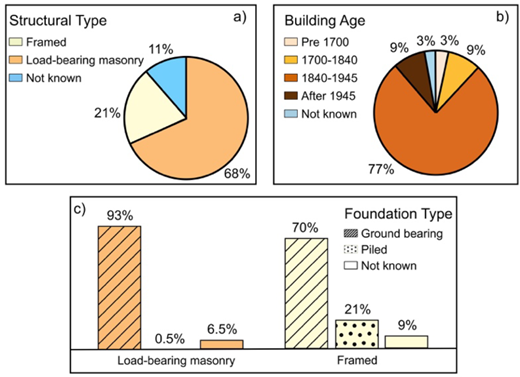
a) Structural typologies for the buildings in the monitored area; b) Age of construction-based classification; c) Foundation types intersected with the structural typology.
a) Structural typologies for the buildings in the monitored area; b) Age of construction-based classification; c) Foundation types intersected with the structural typology.
Figure 4(a) highlights that most of the buildings in the monitored area are load bearing masonry structures (68%), while 21% are framed structures. If this information is intersected with the foundation type (Figure 4(c)), it is evident that the majority of buildings are resting on shallow foundations (about 93% for load-bearing masonry and 70% for framed structures), and 21% of framed structures are built on piles. Building construction periods have been categorized according to the criteria adopted by the DDCMS (2010) for the identification of historical value buildings, distinguishing between the five categories shown in Figure 4(b). The classification indicates that most of the buildings in the area (about 77%) were built between the second half of the 19th century and the war period. These consist of independent buildings and houses organized in terraces. Georgian houses and more ancient buildings represent 9% and 3% of the total buildings, respectively. Post-war buildings represent 9% of the case studies and they mainly consist of big concrete framed structures, relying on piles or deep foundations.
By exploiting an overlay-based procedure, the different building features have been intersected and used to identify edifices behaving as a unique structural block. After this process, 776 building aggregates (i.e. independent structures) have been recognized and their geometries were used as input in the algorithm. The assessment has been successful carried out over 416 buildings, for which the available number of PS allowed a reliable fitting to be performed (Giardina et al., 2019).
The calculation of the actual maximum strains has shown that the settlement did not have significant consequences on the buildings in the monitored area. In order to establish a correlation between the maximum deformations and the potential damage, three levels of severity, identified by letters A, B and C, have been defined. These categories, adapted from the classification proposed by Boscardin and Cording (1989) and Burland et al. (1977), all relate to a negligible risk of damage and correspond to three different ranges of the maximum strain ɛ, with increasing values from A to C. Note that the effect of horizontal strains have been neglected in this study. Figures 5 and 6 show the distribution of the level of damage for the buildings in the monitored area. Figure 5 shows damage predictions based on the MT-InSAR-derived displacements, while Figure 6 shows damage predictions based on the greenfield assumption, respectively.
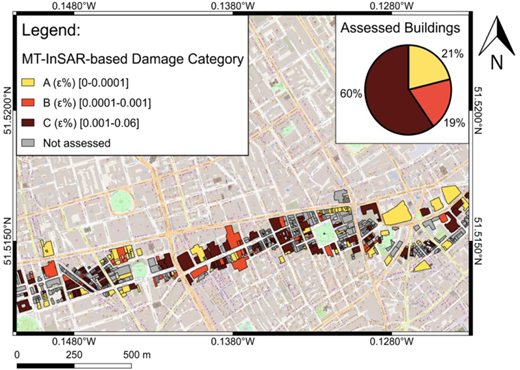
Damage map based on the InSAR-measured displacements for the buildings in Drive X.
Damage map based on the InSAR-measured displacements for the buildings in Drive X.
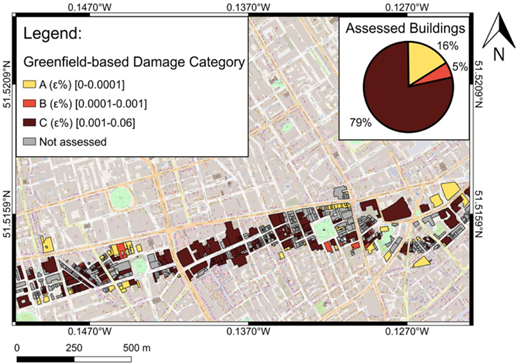
Damage map based on the greenfield displacements for the buildings in Drive X.
Results based on MT-InSAR measurements show that 60% of buildings fall into damage category C, 19% in B and 21% in A (Figure 5). Results based on the Gaussian settlement profile indicate that the 79% of the assessed buildings are assigned to the highest category of damage C, while 5% and 16% of the structures fall into categories B and A, respectively (Figure 6). The comparison between the two maps confirm that the greenfield-based prediction is more conservative.
The availability of MT-InSAR-based results for such a large database of structures enable to analyse the correlation between building deformation and building geometries. In order to compare the results obtained from the MT-InSAR-based and greenfield-based displacements, the ratio between MT-InSAR-based and greenfield-based critical strains has been related to the building aspect ratio H/L, obtaining the distribution presented in Figure 7.
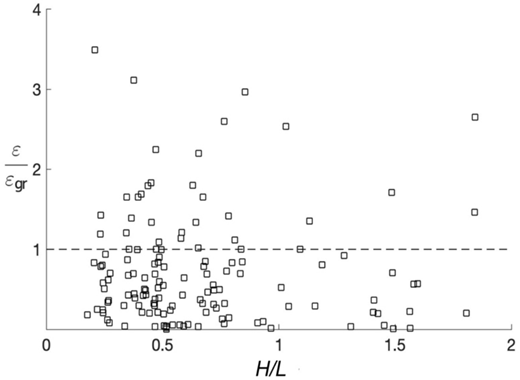
MT-InSAR/greenfield critical strain ratio vs the height-to-length ratio.
The results show that for most of the building aggregates the greenfield assessment overestimates the induced deformation. This means that the presence of the structure usually reduces the curvature of the settlement profile, confirming that the approach neglecting the soil-structure interaction is generally conservative. Most of the cases in which the MT-InSAR-based strains are larger than the greenfield strains correspond to structural blocks with an aspect ratio smaller than one. In addition, it has been observed that the majority of the cases exceeding the dotted line correspond to buildings located in the pure hogging region or located above the tunnel centreline.
The ratio between actual and greenfield strains has been also investigated separately for bending and shear, as defined by Burland and Wroth (1974), in relation with the height-to-length ratio (Figures 8 and 9). Then, MT-InSAR-based strains have been used to evaluate the bending over shear strain ratio (Figures 10 and 11). In both cases the sagging and the hogging regions are analysed separately. Thus, while in Figure 7 H/L considered the total length L of the structure, in Figures 8 to 11 the aspect ratio refers to the part of the building located in the hogging or sagging region.
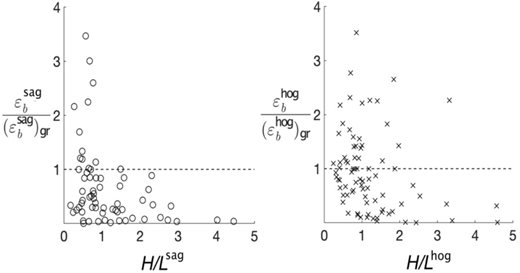
Bending strain ratio in sagging (a) and hogging (b) vs the aspect ratio.
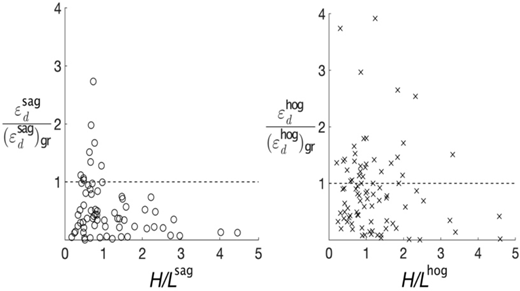
Diagonal strain ratio in sagging (a) and hogging (b) vs the aspect ratio.
Figure 8(a) shows that MT-InSAR-based bending strains calculated for the part of the building located in the sagging zone are usually smaller than the greenfield strains, except for a few cases with H/L < 1. In the hogging zone (Figure 8(b)) a larger number of cases exhibit MT-InSAR-based bending strains larger than greenfield strains. A similar observation can be made for the shear strains (Figure 9).
Figures 10 and 11 show the bending-shear strain ratio for the hogging and sagging deformation, respectively. Both the plots show that there is an inverse relation between the bending-shear ratio and the aspect ratio. In detail, in the sagging configuration the bending deformation mode is prevalent for aspect ratios smaller than one, while buildings with values of H/L > 1 tend to be more susceptible to deformations in shear. In the hogging configuration the trend is almost the same, but the shear component starts to be prevalent before the unit value of the aspect ratio.
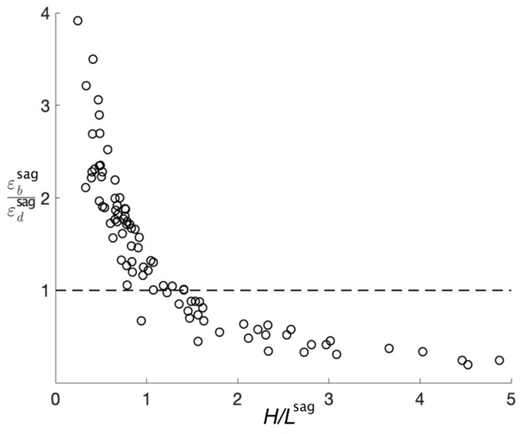
Bending-diagonal strain ratio in sagging vs the aspect ratio.
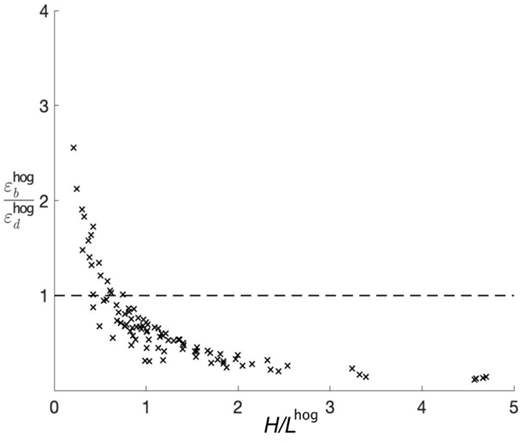
Bending-diagonal strain ratio in hogging vs the aspect ratio.
4 Conclusion
This work presents a methodology that exploits MT-InSAR monitoring for assessing the settlement-induced structural damage to buildings near large underground systems. The study has been performed on a test area in central London, along the Crossrail twin tunnels. Cumulative displacements retrieved from a MT-InSAR analysis of the COSMO-SkyMed dataset have been adopted for generating the tunnelling-induced settlement profile of hundreds of buildings, and the corresponding damage assessment. Information related to the construction material, the foundation typology and the age of construction has been used to identify independent blocks of buildings, modelled in the algorithm as equivalent elastic beams. Damage maps have been created to compare the outcomes obtained from the InSAR-measured displacements and the greenfield-based displacements.
The proposed methodology allowed assessment of many structures with a spatial resolution typically not achieved by traditional BRE Sockets. The tool has provided a direct measurement-based estimate of the level of damage on more than 400 structures, confirming that the greenfield prediction is generally conservative. The application of this procedure to post-tunnelling scenarios has the potential to provide a quasi-real time identification of vulnerable buildings, with an excellent compromise between accuracy and economic constraints.
The large amount of empirical data available from the SAR Interferometry allows investigation of the actual structural response to settlement for diverse classes of buildings. This opens the possibility of identifying various empirical trends, e.g. related to the construction and foundation typology, that could be used to improve methods of predicting damage for future excavation projects.
