

1 Introduction
Many bridges are built to last the intended working lifespan of 100 years (BSI, 2002). To prevent serious bridge failure, especially old bridges, it is necessary to have proper design records, regular inspection, and rehabilitation works. Bridge monitoring has emerged as an essential tool to assess the structural health condition of existing bridges.
There are various monitoring equipment and techniques that can be used to measure the bridge responses (such as relative strain and frequency) under static, dynamic or cyclic loadings. Computer modelling software such as Finite Element Analysis has become a popular approach to simulate the structural behavior and the theoretically computed results are validated by comparing to the field measurements. Conventional strain measuring methods such as vibrating wire strain gauges complemented with accelerometers are well reported (Ko and Ni, 2005; Shepherd, 1964; Wong, 2004).
The advancement in the optical fibre technology offers an additional option for strain measurement. Fibre optic technology has been widely used in many areas such as telecommunication, medical and security (Allwood et al., 2016; Goldman et al., 1965; Krohn et al., 2014). In recent years, the fibre optic strain sensors have emerged as an alternative to the conventional strain gauges as well as opening potential new markets where the conventional sensors with comparable capability do not exist. Optical fibre strain sensing has numerous advantages over the traditional sensors. This includes the sensors being small and lightweight, high temperature performance, immunity to electromagnetic interference, resistance to chemical and corrosion, and high sensitivity (Spillman Jr, 2010).
This paper presents the structural assessment of an old steel bridge under static and dynamic load tests. Two types of optical fibre sensors were used to measure the relative strain during the load tests, i.e. the Fibre Bragg Grating strain sensors and the Distributed Fibre Optic Strain sensors. The results from the two types of fibre optic sensors were compared and used to assess the structural health condition of the old bridge. The field measurements were used by the design engineers.
2 Literature Review
2.1 Bridge Health Assessment Techniques
Conventional strain gauges such as vibrating wire strain gauge and semiconductor strain gauge are widely used for strain measurements due to the ease of installation and cost-effectiveness. The measured strain values can be converted into force or stress which can assist the design engineer to evaluate the structure’s performance or condition. Many literature described the implementation of strain gauges for bridge monitoring works, such as on truss bridges (DelGrego et al., 2008), girder bridges (Sousa, 2013) and arch bridges (Malinowski, 2016). Despite the aforementioned advantages of conventional strain gauges, these discreet sensors are designed to measure the relative strain in one discreet point and may potentially omit some degradation at un-instrumented locations along the structures. To install conventional gauges continuously so that more data points can be captured is not practical and too expensive. Besides, the conventional strain gauges are susceptible to electromagnetic interference and significant signal reduction when the cable is long.
Fibre optical sensors have been widely adapted for Structural Health Monitoring and non-destructive assessment of structures such as tunnels, bridges, buildings, pipelines, etc. The fibre optic can be integrated into structural components, survive harsh environments and form sensor chains with a single fibre (Habel and Krebber, 2011). There are many ways to classify optical sensors depending on the property of interest. This paper focuses on grating-based sensors and distributed sensors, namely Fibre Bragg Grating (FBG) and Brillouin Optical Time Domain Analysis (BOTDA).
2.2 Optical Fibre Technology
Distributed Optical Fibre Sensors (DFOS) consist of injecting a laser pulse within an optical fibre and measuring the backscattered variation along the fibre length. Kechavarzi (2016) described the three types of scattering, namely Rayleigh, Raman and Brillouin scattering in detail. Rayleigh is an elastic scattering where there is no frequency shift in the backscattered photons while Raman and Brillouin are inelastic where there is a frequency shift. Raman scattering is greatly dependent on temperature of fibre and have been used in other areas. Rayleigh and Brillouin scattering are more commonly applied in structural health monitoring, and the paper will focus more on the later.
Brillouin scattering based sensors were first investigated in 1989 and has grown rapidly for commercial use ever since (Horiguchi and Tateda, 1989). Two of the most used types are Brillouin Optical Time Domain Reflectometry (BOTDR) and Brillouin Optical Time Domain Analysis (BOTDA), of which the latter technology is used in this paper. BOTDR requires launching a light pulse from one end whereas BOTDA is stimulated by two counter propagating light waves. Several literatures have employed one or either of these techniques for bridge monitoring (Matta et al., 2008; Minardo et al., 2012; Webb et al., 2017). Comparing both techniques, BOTDA has a better signal to noise ratio which leads to higher measurement accuracy and requires less time. However, it requires access to both ends of the fibre, hence it is not possible to record measurements if a section of the fibre is broken (Iten, 2012)
FBG uses the principal that ultraviolet light with a wavelength corresponding to the grating period will be reflected at the grating while other wavelengths will pass undisturbed. The grating is strain and temperature dependent, hence FBG strain sensors can be used to obtain change in strain of a structure under static and dynamic loads (Kang et al., 2007). FBG are single point sensor that can be multiplexed to fit tens of sensors on a single fibre to form quasi-distributed system (Majumder et al., 2008). FBG have high spatial resolution of 2mm and can measure up to 10km with measuring speeds of up to 10kHz.
FBG can replace traditional strain gauge and have been successfully employed in many Structural Health Monitoring SHM of bridges under dynamic and static loads (Maaskant et al., 1997). FBG has also been applied in railway tracks to monitor status of running trains such as its position, speed acceleration and detect unwanted intrusion on the tracks (Tam et al., 2005). One of the limitations of FBG is that it is a discrete sensor and increasing the number of sensors through multiplexing will increase the cost and only allow measurements at points where the sensors are attached. He et al. (2013) combined FBG and BOTDA into a multiscale fibre optical sensor and installed it on a cable bridge. This allowed potential damages of the bridge to be detected by the distributed BOTDA data which has improved accuracy due to the precise local FBG sensor.
3 Methodology
3.1 Project Background
The paper describes a structural health and performance assessment on an old steel railway bridge in Malaysia. As shown in Figure 1, the superstructure of the bridge is a pratt-typed truss with unbraced compression chords while the decking is an open type system. Four spans consist of 31.4m each which sit simply supported over the masonry abutment.
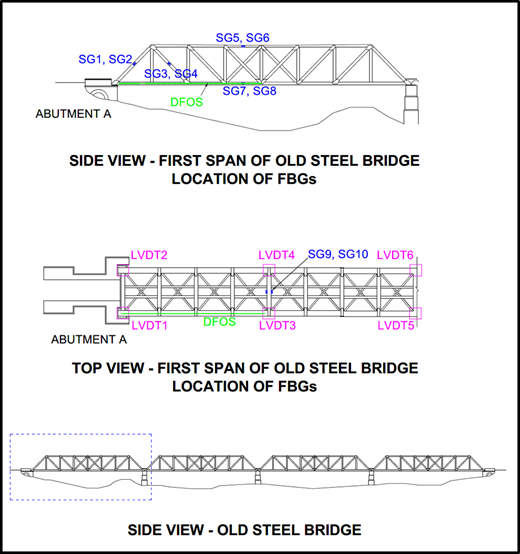
Position of Optical Sensors on Steel Bridge: (a) side view of steel bridge, and (b) close up view of steel bridge and sensor locations
Position of Optical Sensors on Steel Bridge: (a) side view of steel bridge, and (b) close up view of steel bridge and sensor locations
This old steel railway bridge was built more than 100 years ago, and the documentation of the bridge were lost over the years. The absence of documentation on the bridge design has resulted in the locomotive being limited to a 40km/hr as it travels on the bridge.
Keretapi Tanah Melayu Berhad (KTM) or Malaysian Railway Limited, the railway operator is well aware that the bridge might be subjected to undetected structural health deterioration or fatigue over the long service period.
In 2017, KTM embarked on the rehabilitation project for this bridge, which aims to allow heavier locomotives to travel on this old steel bridge at a normal speed of not more than 90 km/hr. A consultant was engaged to conduct condition and structural assessment as well as assessing the bridge actual responses under static and moving loads. The comprehensive inspection and assessment reported minor surface corrosion and no major structural damage. In order to verify the simulation results, sensors were utilized to measure the change in strain under static and dynamic loads, and compare it with the theoretically computed results.
The focus of this paper is the application of fibre optic sensors in measuring the bridge responses under dynamic and static loads, in term of relative strains. Two types of fibre optic sensors were used for the load test, i.e. Distributed Fibre Optic Strain (DFOS) sensors and Fibre Bragg Grating (FBG) sensors. FBG sensors, the discrete optical fibre sensors, were used to collect data during dynamic and static load tests. While the distributed sensors, DFOS sensors were used during static load test. Measured results from FBG and DFOS sensors are then compared and used by the engineers to verify the theoretical computed values, the simulation result is not the focus of this paper.
3.2 Equipment and Instrumentations
The consultant had modelled the bridge and simulate static and dynamic load tests based on closest measured physical properties of the steel bridge and locomotives. Several critical locations of the steel members were identified and instrumented with 10 FBGs and 1 loop of DFOS strain sensors as shown in Figure 1. Besides, 6 Linear Variable Displacement Transducers (LVDT) were installed to monitor the bridge vertical displacements especially at the mid span.
The FBG sensors are placed at the neutral axis as proposed by the bridge engineers as shown in Figure 2. Temperature compensation was also considered during the analysis. During the load tests, there was a significant temperature variation on steel bridge throughout the test. Therefore, the effect of the temperature has to be eliminated in order to obtain the actual relative change in strain due to static or moving loads.
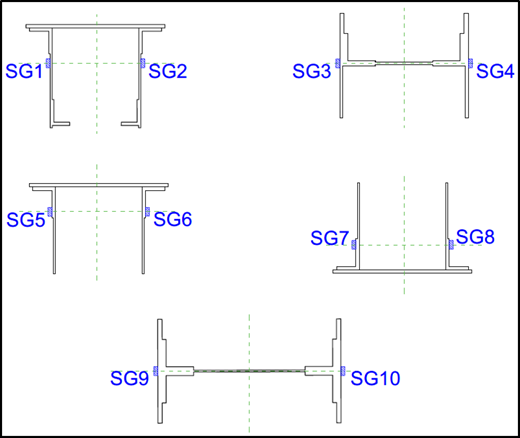
Position of FBG sensors on neutral axis
There were ten FBG sensors, i.e. the optical strain gauge (os3155) with a gauge length of 50 mm, installed on the smooth surface of the uniform steel components (Figure 3). A loop of DFOS sensor was instrumented on the bottom chord of the steel bridge with a total length of 31.4 m on both strain and temperature sensing cables. The DFOS readings were set to 5 ns spatial resolution (that is equivalent to 0.5m), 65,000 averaging numbers/measurements. Table 1 shows the specifications of FBG and DFOS sensors.
Specifications of FBG and DFOS sensors
| Sensor | Optical Strain Gauge os3155 | Geotextile DFOS |
|---|---|---|
| Strain Limit | ±2500με | ±15000 με |
| Strain Sensitivity | ~1.2 pm/pe | 0.05 MHz/ με |
| Gauge Length | 50 nun | - |
| Operating Temperature | -40 to 80°C | 40 to 60°C |
| Measure Tempera true | Yes | Yes |
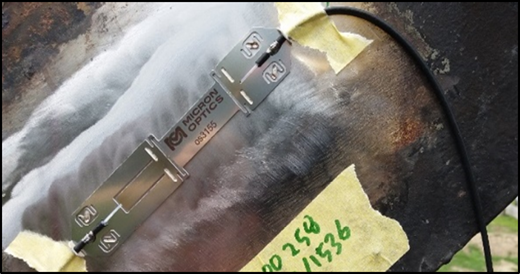
Optical Strain Gauge (os3155) installed on the neutral axis of steel bridge components
Optical Strain Gauge (os3155) installed on the neutral axis of steel bridge components
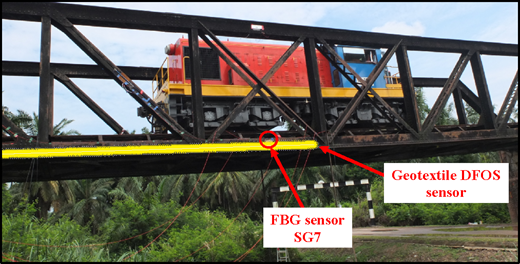
DFOS sensor mounted at the bottom chord of the old steel bridge and the FBG sensor SG7 is mounted very close to it at 14m from Abutment A, in order to compare the strain results obtained from different type of sensors.
DFOS sensor mounted at the bottom chord of the old steel bridge and the FBG sensor SG7 is mounted very close to it at 14m from Abutment A, in order to compare the strain results obtained from different type of sensors.
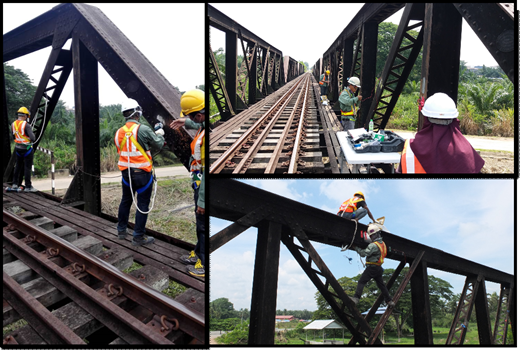
Installation of sensors
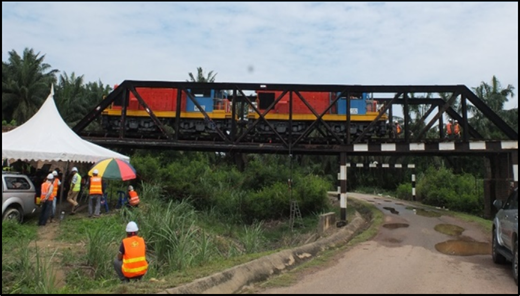
Example of Load Test Arrangement: Case 13 -Double Locomotive Static Test 25 m from Abutment A
Example of Load Test Arrangement: Case 13 -Double Locomotive Static Test 25 m from Abutment A
3.3 Load test Schedule
The test was conducted by loading the steel bridge with single and double locomotives, under static and dynamic conditions as summarized in Table 2. Strain measurements were collected along main trusses, cross beams, rail supporting beams and piers of existing bridge via fibre optics strain sensors.
Load Test Schedule
| Case | Test | Descriptions | Locomotive Typeab | |
|---|---|---|---|---|
| Location from Abut. A | Locomotive Speed | |||
| 1 | Static | 11 m | - | SAL |
| 2 | Static | 15 m | - | SAL |
| 3 | Static | 17 m | - | SAL |
| 4 | Static | 19 m | - | SAL |
| 5 | Moving | - | 40 km/hr | SAL |
| 6 | Static | 21 m | - | DAL |
| 7 | Static | 24 m | - | DAL |
| 8 | Static | 25 m | - | DAL |
| 9 | Moving | - | 10 km/hr | DAL |
| 10 | Moving | - | 20 km/hr | DAL |
| 11 | Moving | - | 30 km/hr | DAL |
| 12 | Moving | - | 40 km/hr | DAL |
| 13 | Static (8 hour) | 25 m | - | DAL |
| aSAL = Single Axle Locomotive (16 tonnes) | ||||
| bDAL = Double Axle Locomotive (32 tonnes) | ||||
FBG strain gauges were able to capture strain readings at frequency of up to 1000 Hz (1000 measurement per second). Maximum strain measurements from dynamic load test were compared with the results from static load test to identify the influence of train’s speed to bridge structure. Table 2 summarized the load testing schedule.
Linear Variable Displacement Transducer (LVDT) were used to measure deflection of the bridge throughout the load tests. Ruler were also installed at all LVDT points and monitor using precise level to verify the LVDT readings. The deflection readings were then analysed to determine the bridge deformation and rebound after the load test.
The bridge superstructure was modelled as a single span of space truss bridge with pinned support at Abutment A and roller support at Pier 1. The bridge model exhibits truss behaviour for vertical plane members comprising top chord, bottom chord, vertical and diagonal members on either side of the bridge with axial load being the dominant effect. The horizontal plane members such as floor beams and longitudinal stringer beam members, which support the rails, exhibits beam behaviour with bending moment and shear forces being the dominant effect. Critical members were selected for verification of the theoretical results for the load test.
The ultimate goal of the test stated in Table 2 is to explore the possibility of increasing the speed of locomotives in the near future, to a speed of 90 km/hr, more than double of the current speed and also to test the bridge capacity subject to future load. Long term inspection and structural assessment will continue to be carried out after the completion of this test. The FBG sensors were covered with aqua seal and protector, thus will be used for future measurement if there is a need.
4 Results
4.1 Strain Measurement of Static Load Test
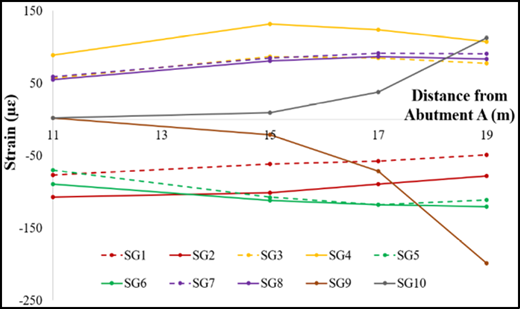
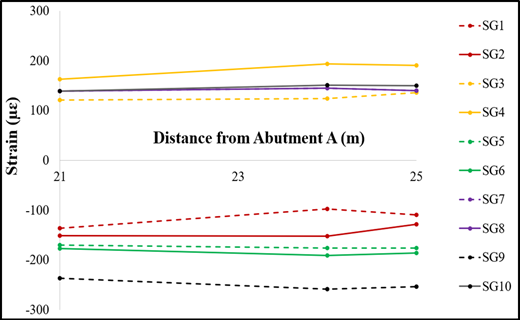
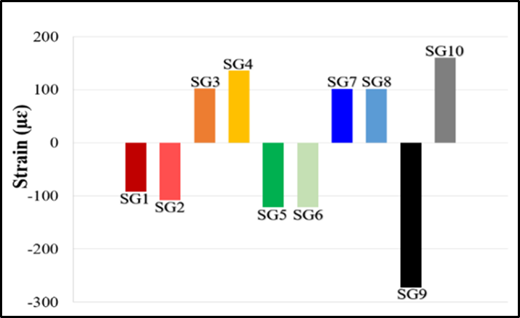
Figures 7-9 show the measurements of strain using FBG sensors when the locomotives were placed at different distance from Abutment A.
Strain measurements (static test single locomotive)
Strain measurements (static test double locomotive)
Strain measurements (8 hours static test double locomotive)
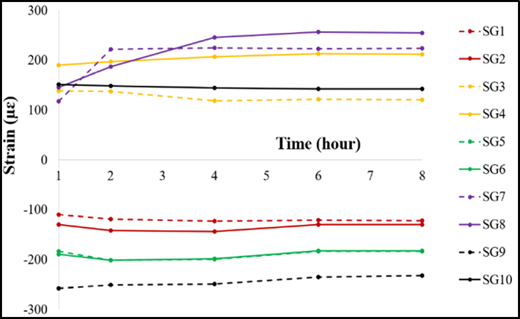
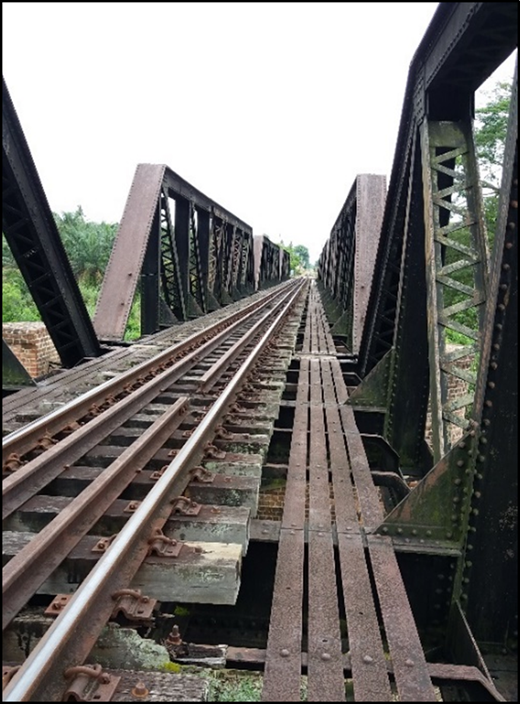
As the strain gauges were placed at different sides of the steel members, the strain values are not the same but of very close magnitude. Generally, the inner components of the steel bridge (SG2, SG4, SG6 and SG8) experienced higher strain as compared to the outer members (SG 1, SG3, SG5, SG7). This may be due to the slightly uneven load distribution which may be caused by the difference in joint and connection system at both sides of the steel components (Figure 10). For single locomotive static load test, the maximum strain recorded was 132µɛ at SG4 (Case 2).
The connection and jointing system at the inner truss is more complicated than outer truss
The connection and jointing system at the inner truss is more complicated than outer truss
Whilst SG 9 and SG10 are placed at top and bottom of the middle components (Figure 1), the strain values indicated compression at top (SG9) and tension at bottom (SG10). The strain at SG9 and SG10 increased when the single locomotive moved closer towards them. However, SG9 constantly recorded higher strain values as compared to SG10. The strain has similar trend for double locomotive static load test. The maximum strain value 192.9|us was captured by SG4 during Case 7.
4.2 Strain Measurement of Moving Load Test
Figures 11-12 shows the measurements of strain using FBG sensors when the locomotives were placed at different distance from Abutment A.
Strain measurements (static test single locomotive)
Strain measurements (moving test double locomotive)
For single locomotive, the locomotive moved at a speed of 40km/hr across the old steel bridge. As shown in Figure 11, the FBG sensors which placed on the same steel components but different sides showed similar readings. SG3 and SG4 showed a relatively higher difference in strain measurement of approximately 33%. SG4 produced the highest strain of 192 µɛ amongst the vertical truss member. While, the horizontal FBG sensors SG9 and SG10 showed similar trend as Figure 7 due to their placement at top and bottom of horizontal chord.
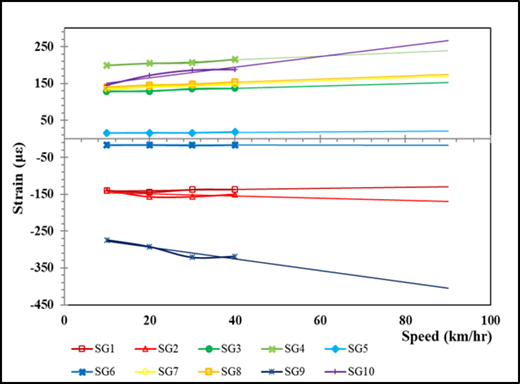
For double locomotive, the moving speeds were 10, 20, 30 and 40 km/hr. However, the strain measurements showed nearly constant strain values for all FBG sensors, under different moving speeds. SG4 again had captured the highest strain of 206.4 µɛ at 40 km/hr moving speed.
Figure 12 shows the maximum measured strain at different speeds and extrapolated to strain effect at 90 km/hr. The results showed that the moving load did not imposed significant impact to the steel truss members. The maximum strain reading at SG 9 is about 400µɛ which equivalents to 54.7 kN bending effect to floor beam member. The predicted strain is considerably lower than the design capacity of floor beam calculated at 1760 kN.
4.3 Eight Hours Static Load Test
Figure 13 shows the result obtained from DFOS for Case 13. The double locomotive was placed at 25 m from Abutment A for eight hours. Strain was measured once the locomotive parked at the exact location, and readings were taken at an interval of two hours. From Figure 13, it is noticeable that while time passed, there is no significant change in strain pattern or trend. However, the magnitude of strain slightly increased. This is due to the creep effect experienced by the old steel bridge over the 8 hours. Table 3 shows the maximum strain collected during the static load tests of different load applied. Measurement were taken at an interval of two hours, i.e. 2nd, 4th, 6th and 8th hour. The DFOS captured a maximum strain reading of 237µɛ, which was mainly due to the creep effect.
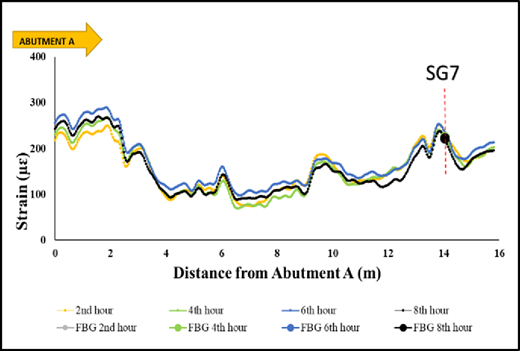
Strain measurement using DFOS and comparison to strain value obtained using FBG sensor
Strain measurement using DFOS and comparison to strain value obtained using FBG sensor
Maximum strains of FBG and DFOS sensors
| Case | DFOS (μ ε) | SG7 (μ ε) | Percentage Difference (%) | |
|---|---|---|---|---|
| 1 | 55.2 | 59.1 | 6.52 | |
| 2 | 85.1 | 84.9 | 0.21 | |
| 3 | 85.4 | 91.2 | 6.34 | |
| 4 | 98.6 | 90.4 | 9.04 | |
| 6 | 117.9 | 130.2 | 9.41 | |
| 7 | 130.7 | 133.5 | 2.10 | |
| 8 | 136.1 | 130.7 | 4.19 | |
| 13 | 2nd hour | 229.5 | 221.9 | 3.44 |
| 4th hour | 221.9 | 224.8 | 1.29 | |
| 6th hour | 236.6 | 223.2 | 6.04 | |
| 8th hour | 221.3 | 224.2 | 1.28 | |
| Average Difference (%) | 4.53 | |||
4.4 Comparison between FBG and DFOS Results
Table 3 summarized the maximum strain obtained during the static load test using FBG sensors (SG7) and DFOS. The SG7 was placed very close to the DFOS geotextile sensor, assuming the two sensors should be able to capture similar data. It can be observed that the maximum strain obtained during the static load test is not more than 250 µɛ which is far from the failure limit of steel. On average, the percentage difference between the results obtain using FBG and DFOS is only 4.5%.
Therefore, for the application of static measurement, the DFOS and the FBG results are in close agreement. The difference between the two systems, even though minor, could be due to (1) the slight difference in the location (FBG welded on neutral axis but the DFOS is slightly away from the neutral axis) and (2) inherited measurement errors (e.g. DFOS averaged spatial resolution 50 cm in comparison to 5 cm for FBG, and quality of signal to noise ratio).
4.5 Temperature Compensation
Effect of temperature is negligible if the test is conducted in a temperature-controlled room or the test duration is short/dynamic. Temperature change induced strain to the substrate and contributed error in measurement. For case 1 to case 12, the temperature change is negligible as the measurement period were short and the temperature did not vary significantly. However, it is necessary to carry out the temperature compensation on case 13 as the monitoring period was 8 hours, started from 2pm to 10pm, where the temperature of steel bridge changed significantly. The maximum temperature difference of the steel bridge structure during the 8 hours of test was 23.65°C.
To minimise the error due to temperature induced strain, the strain measurement in this test was compensated by considering effect of thermal expansion of the steel structure and the thermally induced index of refraction changes in the FBG. Thermal expansion effect of steel structure was compensated by adopted coefficient of thermal expansion (CTE) as 13 µɛ/°C. Thermally induced index of refraction for the FBG was compensated based on gauge factor (at 22°C) varies from 0.806 to 0.822 and temperature sensitivity as 1.833x10⁻⁵. Result shown in Section 4.4 were temperature compensated.
4.6 Vertical Displacement
Vertical deflections of bridge were measured during all static load tests. Figures 14 and 15 showed the maximum deflection measured when the bridge was loaded by single and double locomotives. Maximum displacement occurred at the middle of span (LVDT3 and LVDT4).
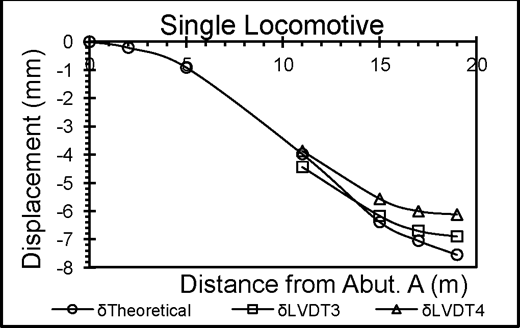
Deflection of bridge (single locomotive)
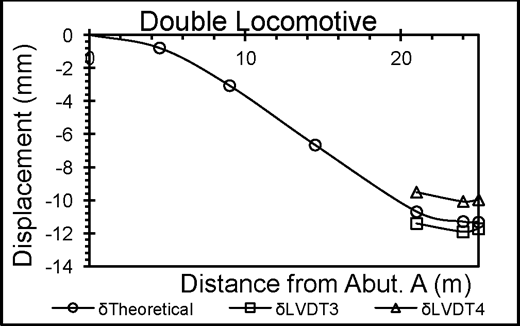
Deflection of bridge (double locomotive)
From Figure 14, maximum measured vertical displacement is 6.52mm or 13.7% less than theoretical computed deflection, when the single locomotive stopped at 19.5m from Abutment A. While, Figure 15 illustrates the maximum deflection occurred when double locomotive is 24.0m away from Abutment A, with a measured average displacement of 11.0mm or 3% more conservative as compared to theoretical value.
Deflection measurements after the locomotives were removed from the bridge were approximately 0mm, which indicated that the bridge did not experience permanent deformation after the tests.
5 Conclusion
Load tests were carried out on an old steel bridge in order to assess the bridge performance. Several critical components were studied and the measured strain showed that all the critical components remain elastic during different conditions of load applications.
Maximum average mid span deflection measured was 11.0 mm as compared to the theoretical computed value of 10.7 mm. The maximum measured strain is approximately 400 µɛ, or 23% of the allowable design strain value of 1738 µɛ in accordance to the design code BS 5400. The load test proved that travelling speed of the locomotives have insignificant impact on the limiting strain of the steel bridge; which suggested that the test on a moving load of maximum speed 40 km/hr may well apply to that of 90 km/hr.
Comparison of the FBG and DFOS results shows that both systems are able to obtain strain measurement during static load test. The results obtained has an insignificant discrepancy of 4.5%. The minor difference in the reading is potentially caused by the slightly different location of installation and the different spatial resolution of the fibre optic sensors.
The test results have successfully validated the simulation results and confirmed that the old steel bridge has a sufficient capacity for the increase of locomotive speed to 90 km/hr and able to sustain future load. Minimal maintenance work will be carried out and long-term monitoring work will be carried out to ensure the safety of the bridge if necessary.
In a nutshell, the optical fibre strain sensing technology has great potential in structural health monitoring as it can measure both the static and dynamic strain precisely and was able to assist in the validation of the theoretically computed results. Without vandalism, future data collection is possible as the FBG and DFOS are immune to corrosion and have comparatively longer lifespan than the conventional strain gauges.
6 Acknowledgements
The authors would like to express their utmost gratitude to KTM and Jabatan Kerja Raya Malaysia (JKR) for the assistance and cooperation that has enabled this structural assessment to be carried out successfully. The authors also would like to acknowledge the permission from KTM and JKR for using the data from this structural assessment to be presented in this paper.
