


The construction industry is undergoing a digital transformation and now holds large volumes of digital building defects data collected during inspections. This study aims to suggest an artificial intelligence-based method for analysing such building defects data to provide insights and knowledge faster than with traditional manual methods.
This research explores a data set containing over 34,000 defects from hospital projects performed in Sweden from 2018 to 2021. The data mining uses keyword extraction based on both TF-IDF vectorisation and k-means clustering, the Mistral 7B model and KeyLLM. The results are compared with a content analysis using the GPT 3.5 turbo model. The analysis is performed both on an organisational and project level.
The paper presents a combination of methods for analysing building defects data. The result shows that the most common problems reported during the inspections concern missing fire sealing, jointing and subceiling problems. Using k-means clustering gives fast insights into the main defect categories of the data set but requires domain knowledge. Keyword extraction using an LLM requires longer computational time but creates a deeper understanding of subcategories of defects. Finally, GPT-based content analysis is a complement to provide project-specific insights and allow user-specific requests.
The study is performed using data digitally collected in Swedish hospital projects. However, the results and methodology can be applied on other project data, such as safety inspections and warranty data. The analysis focused solely on text data.
The method suggested in this paper uses clustering techniques and Large Language Models for analysing building defect data. The value of the proposed method is a faster process for leveraging knowledge from large amounts of unstructured text data, such as building defect reports, safety and moisture inspections and warranty issues.
1. Introduction
Many construction companies are project-based, relying on individuals’ implicit knowledge rather than documented information (Prencipe and Tell, 2001). This reliance complicates feedback and knowledge transfer, as insights are often lost when personnel leave or projects end (Teerajetgul and Charoenngam, 2006). While increased use of production data can improve knowledge transfer, digital adoption in construction has been slow (Agarwal et al., 2016). However, the industry is undergoing a gradual but crucial digital transformation, giving new opportunities regarding knowledge dissemination, productivity and decision-making (Rinchen et al., 2024; Borozovsky et al., 2024).
One important category in this shift is verification and validation data collected through checklists and inspections. These data sets contain information regarding building defects and production issues discovered during construction. The defects and problems were traditionally collected on paper or voice recorders and later transferred to formats like Word or PDF, making the collection time-consuming (Cox et al., 2002). Data collection has become more efficient with the advent of building information models in production, digital issue-reporting software, and mobile devices (Luo et al., 2022). Along with improved digital literacy and cloud storage, these advances have addressed past challenges like specialised training, limited storage and equipment needs (McCullouch, 1997; Cox et al., 2002; Kopsida et al., 2015).
Despite the availability and value of inspection data, many construction companies fail to fully use it due to a lack of standardisation and automated analysis processes (Cabena et al., 1997; Soibelman and Kim, 2002; Yan et al., 2020; Lundkvist et al., 2010). Moreover, while machine learning and data mining techniques are increasingly being applied to large data sets in construction, their use in analysing quality inspection data has not been thoroughly explored. Identifying frequent defects can support decision-making regarding quality improvements.
Therefore, this study proposes an artificial intelligence-supported process to analyse digital inspection data, focusing on building defects in seven hospital projects. By addressing the current gap in using large language models and machine learning for analysing inspection data, this research aims to demonstrate how data-driven insights can be achieved faster than with previous manual methods.
2. Background
Building defects are causing increased project costs and time delays for addressing them, increased construction waste and decreased customer satisfaction (Olanrewaju and Lee, 2022; Equity Economics, 2019; Shooshtarian et al., 2023). Rework accounted for about 5% of the total construction costs in the USA in 2004 (Olanrewaju and Lee, 2022). Similar numbers of 5% and 4% are found in Sweden and Australia (Josephson and Hammarlund, 1999; Mills et al., 2009). Causes include poor workmanship and design faults (Sandanayake et al., 2021), lack of knowledge, motivation and responsibility (Josephson and Hammarlund, 1999), lack of supervision and poor leadership (Yaman et al., 2022) and lack of communication (Gurmu and Mahmood, 2024).
Most quality issues in construction are identified during production through inspections by supervisors and inspectors (Lambers et al., 2023). In this study, quality issues refer to building defects in terms of a flaw in the performance of elements of a building (Georgiou et al., 1999). Common analysis methods include categorising issues into defect types and examining their frequency and location (Gurmu et al., 2023). However, crucial information regarding affected building elements and causes is often missing despite digital collection (Cusumano et al., 2024).
Even though building defects data is considered useful information, the present use in the construction industry, other than for addressing issues one by one in a specific project, is limited (Soibelman and Kim, 2002). Three main reasons are:
Construction managers do not have sufficient time for data analysis (Soibelman and Kim, 2002; Cabena et al., 1997).
The data analysis process is rather complex (Dang et al., 2019; Soibelman and Kim, 2002; Cabena et al., 1997).
Lack of well-defined automated methods for extracting, preprocessing and analysing data (Dang et al., 2019; Lundkvist et al., 2010; Soibelman and Kim, 2002).
Lundkvist et al. (2010) surveyed the use of inspection data and discovered that while over 80% of respondents considered it a valuable source of knowledge, more than 50% of companies did not use it. They also found that even when inspection data is stored, it is rarely shared across projects. Dang et al. (2019) highlighted the importance of establishing organisational procedures that facilitate knowledge sharing and feedback loops, enabling capitalisation of digital data resources. Therefore, more automated ways to analyse the text content to perform the classification would be beneficial.
Along with the digitalisation of defect reporting and access to large data sets, data mining and machine learning techniques are emerging trends in the construction industry (Yan et al., 2020; Pan and Zhang, 2021). Inspection data consists extensively of text, making the text processing field within artificial intelligence, natural language processing (NLP), particularly interesting.
Applying artificial intelligence and NLP techniques to building defect data is an increasing research field (Shooshtarian et al., 2023). A summary of recent NLP-based research on production issues and building defects is presented in Table 1. Cheng et al. (2015) used genetic algorithms to generate association rules and discover multi-level patterns of defects in the Chinese construction industry. Their research indicated that understanding the relationships between defects and causes enables managers to make strategies for reducing them. Gurmu et al. (2023) analysed many defect reports from a consulting company using various NLP-based data mining methods. Their research developed dashboards for analysing and visualising defects in multi-storey residential buildings.
Recent NLP-based research concerning production issues and building defects
| Authors | Year | Focus | Method | Purpose |
|---|---|---|---|---|
| Ren et al. | 2024 | Concrete dam quality records | Rule syntax parsing and phrase semantic distance | Checking specifications |
| Wang et al. | 2024 | Daily quality defect reports | CNN + RF | Keyword extraction |
| Wang et al. | 2024 | Quality defects | TDA-WV-TextCNN | Text categorisation |
| Bazzan et al. | 2023 | Costumers’ complaints | NLP recommendation system | Improve quality in customer complaint data |
| Gurmu et al. | 2023 | Defect reports and their location | Various NLP | Identify locations, understand the association between defects, and predict the rectification period |
| Noh et al. | 2023 | Apartment occupants complaints | NLP, TF-IDF and SNA | Identification of dissatisfaction factors |
| Shooshtarian et al. | 2023 | Australian court cases | KeyBert | Identify defects, causes and stakeholders |
| Jeon et al. | 2022 | Resident building defect complaints | NER and BERT | Extracting defect information from noisy text |
| Yang et al. | 2022 | Residential buildings | NLP | AutoDefect, text classification. Identify work, location, defect and element |
| Tian et al. | 2021 | On-site weekly reports | CNN+Word2Vec CNN+onehot | Classify text to understand on-site conditions and problems |
| Yang et al. | 2021 | Building defects in lawsuits | CNN | Text classification. Identify work, location, defect and element |
| Jallan et al. | 2019 | Building defect in legal lawsuits in the USA | NLP, unsupervised learning +latent Dirichlet allocation | Keywords-based frequency analysis |
| Zhong et al. | 2019 | Building quality complaints | CNN | Classifying complaints |
| Cheng et al. | 2015 | Defects in China | GA | GA for generating association rules |
Zhong et al. (2019) explored using Convolutional Neural Networks (CNN) for data mining quality flaws by developing an automatic building quality complaint classification model. Another example of using CNNs is Tian et al. (2021), using a combination of CNN, Word2vec, and one-hot encoding to classify text from weekly on-site problem reports. Further, Wang et al. (2024b) applied TF-IDF, Naïve Bayes, CNN and Random Forest to analyze and classify daily construction defect reports in China. Additionally, Wang et al. (2024a) used text data augmentation, Word2vec and CNN for classifying quality defects.
Court cases are another source of building defects data. Shooshtarian et al. (2023) analyzed 29 residential building complaints using KeyBert and clustering to identify defects, causes, and stakeholders. Yang et al. (2021, 2022) developed an NLP and CNN-based multi-task model to classify quality problems in lawsuit texts, identifying work, location, defect type and affected elements. Similarly, Jallan et al. (2019) applied NLP techniques, unsupervised learning and Latent Dirichlet Allocation to analyze US court cases on building defects.
Occupants’ complaints can provide valuable defect data for residential buildings. Noh et al. (2023) used TF-IDF for keyword extraction from apartment occupants’ complaints and then applied semantic network analysis to find relationships between keywords. Similarly, Jeon et al. (2022) used named entity recognition and the BERT model to extract defect information from online complaints containing linguistic errors and slang.
Ren et al. (2024) added a compliance-checking step in their research investigating the quality of concrete dam constructions. Their research mined text quality records from concrete dam inspections and used ruled syntax paring for automatic quality compliance checking.
Since building defect data, particularly from inspections and customer complaints, consists of short incomplete sentences, slang, abbreviations and sometimes missing essential information (Wang et al., 2024a; Jeon et al., 2022, Cusumano et al., 2024), research has also targeted the data input. Bazzan et al. (2023) used NLP techniques to build a word menu for customers to lodge complaints to improve data quality. Their research also created a recommender system assisting warranty service teams in prioritising problems.
Most previous research using AI models to classify building defects has sorted the defects into predefined categories. Therefore, the study presented in this paper explores methods to let the AI model determine the categories and further explore subcategories of defects for deeper insights.
3. Methodology
The methodology section follows Saunders’s “research onion” (Saunders et al., 2019). The first sub-section covers the first three layers of the onion research design. The second and third sub-sections cover the more hands-on layers in Saunders’s research onion – method choices, research process and data collection and analysis.
This research uses the Knowledge Discovery in Databases (KDD) framework to extract valuable patterns and insights (Fayyad et al., 1996; Usama et al., 1996; Cabena et al., 1997; Soibelman and Kim, 2002). The study follows the simplified five-step KDD model by Yan et al. (2020): data collection and preparation, preprocessing, data mining, pattern evaluation and knowledge generation.
3.1 Research design
The research was designed as an explorative study investigating how NLP techniques can generate insights and knowledge from digitalised quality inspection data. The explorative approach was motivated by the potential and data mining process for digital quality inspection data being sparsely investigated (Singh, 2021). The approach also allowed for flexibility in the case selection and data examination before choosing a more targeted analysis (Tukey, 1977). The study’s outcome mainly focuses on explorative learning in the construction industry, such as identifying new patterns and information (Brady and Davies, 2004).
3.2 Research process
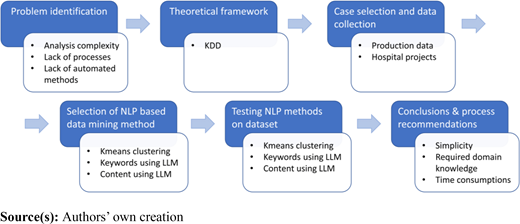
The research began with understanding why quality inspection data is not further used for knowledge generation. The previously mentioned KDD model was used as a theoretical framework. Then, an explorative approach was used to select a case and find a proper data set. The case selection was followed by selecting NLP-based data mining methods and testing the chosen methods on the data set. Finally, conclusions and process recommendations were made. The research process is explained in Figure 1, and the steps are described in more detail in the following sections.
3.2.1 Case selection and data collection.
This study analysed production issues and building defects recorded in Dalux Field (Dalux Field, 2024), a widely used construction defects reporting software in Scandinavia. The data examined came from seven Swedish hospital projects, with budgets between 200m and 1,740m SEK, built by a major Swedish contractor from 2018 to 2021. Hospital projects were chosen for their size and complexity, leading to a high volume of production issues, and their consistent problem reporting methods.
The data set was collected via an application programming interface (API) and included 34,069 inspection remarks collected with tablets or mobile phones. The data contained information such as title, description, discipline, responsible company and the type of inspection during which the problem was identified. The data underwent preprocessing, which included cleaning, integration, enrichment and reduction (Witten and Frank, 2005; Giudici, 2009).
3.2.2 Selection of natural language processing-based data mining methods.
Previous research highlights inspection data as a valuable knowledge source (Lundkvist et al., 2010), but project managers lack time and processes for data mining (Soibelman and Kim, 2002). Therefore, fast and simple data mining methods were selected for the analysis. As the qualitative information in the data set was found in unstructured text, such as titles and descriptions, NLP methods focusing on keyword extraction were prioritised. The final methods selected were statistical keyword extraction, K-means clustering, KeyLLM keyword extraction, and GPT 3.5-turbo keyword extraction.
3.2.3 Testing of natural language processing methods on the selected data set.
The selected NLP methods were tested on the hospital data set in four steps to generate organisational and project-level insights. The four data mining and analysis steps were as follows:
keyword extraction on the organisation level;
topic clustering on the organisation level;
keyword extraction on the organisation level using an LLM; and
content analysis on the project level using an LLM.
3.2.3.1 Step A: keyword extraction on the organisation level.
Step A aimed to provide an overview of the data set, identifying the most frequent problems and associated keywords. The analysis focused on the titles and descriptions of reported issues. Since some problems had only titles and others had longer descriptions with minimal or unclear titles, titles and descriptions were merged. Special characters, numbers and stopwords were removed, and all text was converted to lowercase using a Python script with the NLTK toolkit (Natural Language Toolkit, 2023). The top 20 keywords were then identified by frequency.
Two analyses were conducted to determine which words commonly appeared with the identified keywords. The first analysis determined the five most frequent co-appearing words across all word classes. The second analysis identified co-appearing nouns using part-of-speech tagging through the Stanza library in Python, an open-source natural language processing tool developed by the Stanford NLP Group (Qi et al., 2020).
3.2.3.2 Step B: topic clustering on the organisation level.
Titles and descriptions in the data set were merged, and stopwords and special characters were removed, following the same process as in Step A. The text was then vectorised using TfidfVectorizer and clustered with the K-means algorithm, which groups the inspection remarks based on similarity. K-means initialises k centroids, assigns each data point to the nearest centroid, and then updates the centroid’s position based on the mean of the assigned data points, repeating this process until the clusters stabilise (Goodfellow et al., 2016).
Given that clustering generates high-dimensional word vectors, principal component analysis (PCA) was used to reduce dimensionality, allowing for visualisation in a two-dimensional plot. TfidfVectorizer, k-means and PCA were all implemented using the Python library Scikit-Learn (Scikit Learn, 2023). After clustering, the primary keywords for each cluster were extracted and visualised with Seaborn (Waskom, 2021). The topic clustering was performed with three clusters containing five main keywords. How many clusters to use was investigated by varying the number of clusters and analysing the corresponding keyword precision.
3.2.3.3 Step C: Keyword extraction on the organisation level using an LLM.
First, keywords from each Step C cluster (fire sealing, jointing and subceiling) were used to filter the primary data set in Python. Rows containing terms like “fire sealing”, “fire jointing”, “fire insulation”, “fire”, “fire seal*” or “fire joint*” in the title or description were selected. The exact process was applied to jointing and subceiling, resulting in three filtered data sets. The defect descriptions were used as a primary source, but when they were absent, titles were used instead.
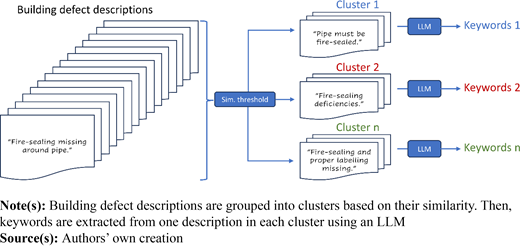
Second, for each of the three data sets, a keyword extraction process was performed following the method described by Grootendorst (2023) (Figure 2). The ctransformers package was imported to simplify model loading. Then, a transformer pipeline was created using the tokeniser from the pre-trained Mistral 7B language model (Mistral 7B model, 2023). A keyword extraction prompt was created as follows:
keyword_prompt = """
[INST]
I have the following document:
- [DOCUMENT]
Please give me the keywords that are present in this document and separate them with commas.
Make sure you only return the keywords in Swedish and say nothing else.
[/INST]
"""
The keyword prompt was combined with an example prompt to guide the LLM. The example prompt was: “Concrete not finished. Cast to 20 mm from the edges so that it can be levelled with a self-levelling compound once the concrete has dried to a relative humidity of 85%.” and the output keywords: “concrete, cast, levelling, dry, edge, relative humidity.”
The calculation time was reduced by clustering the issues depending on their similarity, and for very similar sentences, only one set of keywords was extracted. The embeddings were made using the multilingual transformer model paraphrase-multilingual-MiniLM-L12-v2 (Reimers and Gurevych, 2019) and the keyword extractions from similar documents were made using the toolkits KeyBert and KeyLLM (Sharma and Li, 2019).
3.2.3.4 Step D: Content analysis on the project level using an LLM.
The two largest hospital projects, responsible for most reported defects, were selected to test the LLM-based method for project insights. The analysis focused on fire sealing and subceiling issues. Issue titles containing “fire sealing, fire jointing” and “subceiling” were filtered, and the corresponding problem descriptions were provided as input to the LLM. If a description was missing, the title was used instead.
The filtered data sets were analysed using OpenAI’s GPT-3.5-turbo model via the OpenAI API in Python (OpenAI, 2023). A function, “get_completion”, was defined to generate responses. The function takes the user’s input as a prompt and returns a response. The temperature parameter, controlling the creativity of the model, was set to zero to ensure deterministic responses and minimise randomness. The code for the “get_completion” function was:
def get_completion(prompt, model=“gpt-3.5-turbo”):
messages = [{“role”: “user”, “content”: prompt}]
response = openai.ChatCompletion.create(
model = model,
messages = messages,
temperature = 0,
)
return response.choices[0].message[“content”]
The prompting was made by giving the model the task of summarising a list of production problems into three sentences. The production problems were provided in a list named prod_prob. The prompting used was as follows:
prompt = f"""
Your task is to generate a summary of a list\
of production problems regarding fire-sealing from a contractor company\
to give feedback to the quality department.
First, summarise the issue list in three sentences.
Second, generate a list of the five most frequent fire-sealing problems.
List: ′′′{prod_prob}′′′
"""
response = get_completion(prompt)
print(response)
The prompt was adapted for subceiling issues by replacing “fire sealing” with “subceiling”. The prompt was written in English despite the data set being provided in Swedish.
4. Results
4.1 Step A: keyword extraction on the organisation level
Table 2 displays the 20 most common words in the data set, along with their frequency and percentage of the total data set. The word “missing” was the most frequently appearing in almost 25% of all remarks in the data set. Table 3 presents the five most frequently appearing keywords, the five words and nouns they most often occur with, and examples of common sentences they appear in.
Keyword frequencies comparison
| Keyword | Word count | Proportion of total number of issues (%) | Keyword | Word count | Proportion of total number of issues (%) |
|---|---|---|---|---|---|
| Missing | 8,447 | 24.8 | Hole | 1,211 | 3.6 |
| Improvement | 2,769 | 8.1 | Incomplete | 1,068 | 3.1 |
| Labelling | 2,445 | 7.2 | Joint | 903 | 2.7 |
| Markings | 2,059 | 6.0 | Sealing | 896 | 2.6 |
| Subceiling | 1,536 | 4.5 | Pipe | 881 | 2.6 |
| Door | 1,523 | 4.5 | Sign | 868 | 2.5 |
| Wall | 1,379 | 4.1 | Ventilation | 847 | 2.5 |
| Damage | 1,332 | 3.9 | Fire | 789 | 2.3 |
| Insulation | 1,318 | 3.9 | Sound | 788 | 2.3 |
| Fire-sealing | 1,274 | 3.7 | Adjustment | 725 | 2.1 |
Co-appearing words for the five most frequent keywords and examples of common sentences in which the words appear
| Keyword | Five most co-appearing words | Count | Five most co-appearing nouns | Count | Representative example sentence |
|---|---|---|---|---|---|
| Missing | Labelling Incomplete Insulation Sealing Sign | 1,631 1,068 666 640 490 | Labelling Sign Insulation Sealing Fire-sealing | 1,647 784 671 642 379 | Labelling missing for fire sealing Incomplete interior, cabinet not assembled Insulation around the pipe is missing Sealing is missing around the sprinkler pipe Sign is missing |
| Improvement | Mark Reparation Missing Painting Material | 1,965 286 89 85 48 | Mark Damage Painting Material Wall | 1,966 288 87 48 45 | Needs impr. according to mark found on drawing Needs improvements, repair with paint Needs improvements, surface treatment is missing Painting improvements are needed Improve and remove leftover material |
| Labelling | Missing Cable labelling Insulation Incomplete Valves | 1,631 379 362 326 102 | Cable labelling Insulation Channel Sign Valve | 383 362 177 144 129 | The wall is missing fire labelling Cable-labeling is missing Missing insulation and labelling for sprinkler pipe Incomplete labelling of firewalls Valve discs lack labelling |
| Markings | Improvements Missing Subceiling Damages Floor | 1,966 51 47 41 38 | Improvement Damage Subceiling Floor Scratch | 1,966 51 47 39 25 | Improvements needed according to marking Marking of sound class is missing Subceiling is damaged at markings Plasterboard is damaged at marking Scratches on the floor at marking |
| Subceiling | Missing Below Signs Adjustment Above | 425 280 254 220 140 | Sign Damage Ride Subceiling profile Ventilation device | 343 205 112 111 92 | Missing subceiling towards the inner yard Horizontal gypsum board joint below the subceiling Signs are missing below the subceiling Pipes touch the ceiling, adjust the subceiling There is a hole in the fire cell above the subceiling |
Co-occurring words with “missing” indicate many defects involve fire sealing, such as missing seals, labels or signs. The signs missing should tell the product name, technical fire class or approval number for the sealing product. The second category is more varied and harder to interpret, often described vaguely, like “Improve according to the mark on the drawing,” offering little detail. Common issues here include painting deficiencies that require improvement.
The third category reveals that, in addition to fire-sealing, cables, insulation and valves often lack labeling. The fourth category indicates missing or damaged floors and subceilings noted on drawings, with many issues overlapping the first two categories. The final category focuses on subceiling problems, including missing or damaged sections, equipment resting on the subceiling and the need for various adjustments.
Static keyword extraction is fast and offers insights into defects identified during inspection. However, the diversity of issues within categories makes it challenging to identify clear patterns. Interpreting the results requires domain expertise and familiarity with the data set.
4.2 Step B: topic clustering on the organisation level
The clustering in Step B improved the visualisation of patterns in the data set. The result of clustering all issues from the seven hospitals is presented in Figure 3. K-means clustering is fast, taking about a minute to run on a local laptop. The extracted keywords for each cluster are presented in the upper right corner of Figure 3. For example, the keywords for Cluster 1 indicate problems with fire sealing around holes in walls and doors. Cluster 2 indicates problems with missing jointing, sealing or signs, and Cluster 3 relates to damaged or missing subceiling or gaps in the subceiling.
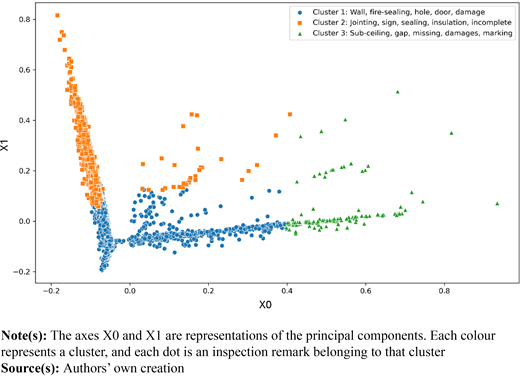
While keywords are generated automatically, domain knowledge and data set familiarity are needed for interpretation. The principal component offers a general sense of each cluster’s issue frequency.
4.3 Step C: keyword extraction on the organisation level using an LLM
The clustering results from Step B guided the selection of defect topics for further investigation. The complete data set from all seven hospitals was filtered using the keywords “fire sealing”, “jointing” and “subceiling”, creating three sub-data sets. An appropriate similarity threshold was needed since the clustering was based on vector similarity. Threshold values between 0.5 and 0.9 were tested, and the quality of the results was analysed. At a 0.5 threshold, highly different issues were grouped, with one category covering 86% of all issues. A manual analysis of this category revealed five distinct subcategories. The threshold was adjusted until no further subcategories were found, with a final threshold of 0.75, reducing the main category to 30%–50% of the total issues.
The keyword extraction results for fire sealing issues, totalling 1763, are presented in Table 4. In most cases, the LLM extracted up to five keywords. The largest issue category, accounting for 53% of all fire sealing problems, involved missing or incorrect fire sealing from various wall penetrations. The second category included gypsum problems and missing insulation, while the third dealt with deficiencies in sealing related to gypsum. The LLM separated gypsum-related issues based on whether sealing was missing or deficient. The fourth category, with just one keyword, mostly reflected defects labelled “Fire insulation missing”. A human might have grouped these with the first category.
Keyword frequencies for fire sealing defects in all hospitals
| Category | Keyword 1 | Keyword 2 | Keyword 3 | Example sentence | Proportion of total number of issues (%) |
|---|---|---|---|---|---|
| 1 | Fire sealing | Penetration | Fire sealing. Pipe penetration must be fire-sealed. Fire sealing missing. Incorrect fire sealing | 53 | |
| 2 | Gypsum | Insulation | sealing | Gypsum and insulation. Gypsum, insulation, sealing. Gypsum for EI60. 15 mm gypsum on both sides | 5 |
| 3 | deficiencies | sealing | gypsum | Insulation and gypsum. Sealing deficiencies gypsum | 3 |
| 4 | Fire insulation | Shall be fire sealed. Fire insulation is missing | 3 | ||
| 5 | reduce | holes | Fire sealing | Reduce the holes for fire sealing. Damaged fire sealings. New holes must be fire-sealed. Adjust hole before fire sealing | 2 |
| 6 | Fire sealed | EI60 | Not fire-sealed EI60. Fire sealing EI60. Should be sealed to resist EI60 | 2 | |
| 7 | adjust | Fire sealing | Adjust fire sealing. Put foam | 2 | |
| 8 | Fire sealing | missing | label | Fire sealing and labeling missing. Fire sealing not labelled | 2 |
| 9 | Fire sealings | not | completed | Fire sealings not completed. Fire sealing missing. Fire jointing not finished | 2 |
| 10 | labelling | insulation | Missing | Labelling missing. Labelling for insulation missing. Labeling should be moved | 2 |
The results for subceiling issues, totalling 1681, are presented in Table 5. Except for a few long sentences, the LLM typically extracted up to six keywords. The most common issue, broken subceilings, accounted for over 30% of all problems. The model distinguished between broken and damaged subceiling, placing descriptions with “damaged” in the fifth category. A human would likely combine these, making broken and damaged subceiling plates represent 36% of all issues. The second largest category, missing signs for cables or components beneath the subceiling, made up 12%, while the third largest, missing subceiling, accounted for 7%. The model grouped “broken” and “dirty” subceiling issues into the same category, likely because these words often co-occurred in the problem descriptions, such as in the sentence “Subceiling broken and dirty.”
Keyword frequencies for subceiling defects in all hospitals
| CategoryKeyword 1 | Keyword 2 | Keyword 3 | Keyword 4 | Keyword 5 | Example sentences for keyword category | Proportion of total number of issues (%) | |
|---|---|---|---|---|---|---|---|
| 1 | subceiling | broken | Subceiling broken. Moisture in subceiling. Subceiling not completed | 31 | |||
| 2 | Signs | component | below | subceiling | missing | Signs for components are missing under subceiling. Cabel labelling and signs for components missing | 12 |
| 3 | subceiling | missing | Subceiling missing. Ceiling profiles missing | 7 | |||
| 4 | subceiling | rides | ventilation | Subceiling rides on the ventilation duct | 5 | ||
| 5 | damages | subceiling | large | cut-outs | Damages in subceiling, ceiling profiles damaged. Large cut-outs in subceiling | 5 | |
| 6 | hanger | subceiling | touches | Gas pipe | Subceiling hanger touches the gas pipe | 4 | |
| 7 | sprinkler | installed | Subceiling | missing | Sprinkler not installed in the subceiling yet. Sprinkler and ceiling missing | 2 | |
| 8 | damaged | profile | Damaged subceiling profile. Adjust ceiling | 2 | |||
| 9 | valves | labelling | subceiling | Valves lack labelling below the suspended ceiling | 1 | ||
| 10 | broken | tiles | Installer | replaced | Broken tiles after the ceiling installer must be replaced | 1 |
Table 6 presents the keyword extraction results for 2954 sealing and jointing problems. The LLM placed “missing sealing,” “seal is missing,” and “shall be sealed” in separate categories, though they could be combined. Categories 4 and 7 were identical, but Category 4 used Swedish keywords, while Category 7 included English keywords from a non-Swedish-speaking team member. By merging Categories 1, 3, 4 and 7, 40% of all issues are grouped under “sealing missing,” better aligning with the main categories for fire sealing and subceiling issues. Category 8 included problems related to both windows and unsealed holes, which ideally should have been split into two distinct categories.
Keyword frequencies for sealing and jointing defects in all hospitals (2,954)
| Category | Keyword 1 | Keyword 2 | Keyword 3 | Example sentence | Proportion of total number of issues (%) |
|---|---|---|---|---|---|
| 1 | missing | Sealing missing. Sealing | 22 | ||
| 2 | Filler-pieces | Sealed | Filler-pieces must be sealed. Seal cabinets. Countertop must be sealed | 12 | |
| 3 | sealed | Shall be sealed | 9 | ||
| 4 | seal | missing | Seal is missing. Sealing missing | 7 | |
| 5 | section | sealed | Window section not sealed. Sections not sealed. Section not insulated and sealed | 3 | |
| 6 | sealing | completed | Sealing not completed | 2 | |
| 7 | seal* | Missing* | Seal missing. Dirt in sealing. (English as input language) Sealing filler-pieces | 2 | |
| 8 | windows | sealed | Windows note sealed. Window shall be adjusted and sealed. Hole not sealed | 2 | |
| 9 | sealing | fire-door | Sealing fire-door. Sealing in wall and section connection | 1 | |
| 10 | Water tightness | Sanitary rooms | Room | Watertightness testing for sanitary rooms shall be conducted in this room | 1 |
The LLM method offers more precise keywords and minimises interpretation errors by allowing straightforward mapping between keywords and original sentences. This approach is suitable when domain knowledge is lacking or limited. Compared to k-means, the LLM method demands significantly more computational time. Overall, the method performed well for subceiling and fire sealing problems, yielding results comparable to those a human might produce. However, the sealing and jointing results were less precise. Upon comparing the three sub-data sets, the sealing and jointing data set was larger, with descriptions of just one or two words. The short sentences could explain the reduced keyword precision, as the model relies on sentence context to extract meaningful keywords. When input is limited to very short descriptions, the model has less context to work with, reducing keyword accuracy.
4.4 Step D: content analysis using an LLM on the project level
Two hospitals reported more issues than the others, representing 83% of all defects in the data set. Therefore, the results in the following sections will focus on those two hospitals and comparisons between them.
The short prompt described in the method section generated the responses in Table 7. The responses provide useful insights into the types of defects in the data set for fire sealing issues, though some repetition occurs. Both lists of frequently appearing remarks show redundancy. For Hospital 1, the LLM created a separate category for remarks containing “missing,” which should have been merged with “Fire sealing is missing.” As all remarks were filtered by “Fire sealing,” the “Sealing is missing” category should also be merged into “Fire sealing is missing.”
LLM response when asked to make a three-sentence summary and list the most frequent problems
| Prompt topic | Hospital 1 | Hospital 2 |
|---|---|---|
| Fire sealing summary | The list of production problems includes missing labelling on drainage penetrations, unsealed electrical penetrations in fire cell boundaries, lack of insulation and labelling on sprinkler pipes, missing fire sealing and labelling, missing vent pipes, missing markings on drainage and sprinkler systems and missing fire markings on walls and corridors. There are also issues with missing fire tape, damaged or missing fire sealing and incomplete or incorrect labelling. The quality department should address these problems to ensure safety regulations and standards compliance | The list of production problems includes issues such as incomplete or missing fireproofing, electrical components not being fireproofed, inadequate sealing around openings for fireproofing, missing or damaged fireproofing and missing or improperly installed fire seals and sleeves. There are also instances where fire sealing needs to be completed or redone, and areas where fire sealing and insulation are missing. Additionally, there are concerns about the lack of proper labelling and documentation for fireproofing measures |
| Fire sealing frequency list | Fire sealing is missing Missing Labelling is missing Fire tape is missing Sealing is missing | Electricity cable is not fire sealed Fire sealing is missing Fire sealing not performed Must be fire sealed Fire sealing and insulation are missing |
| Sub-ceiling | The list of production problems regarding Sub-ceilings includes missing ceilings, improper installation of plates, lack of distance between the ceiling and radar, low placement of pipes, incomplete ceilings around pillars, debris and dirt above the ceiling, damaged ceiling profiles, missing or damaged ceilings and the need for adjustments and replacements of various ceiling components | The list of production problems regarding Sub-ceilings includes issues such as misalignment of the ceiling, damage to the ceiling, debris above the ceiling, ceiling riding on ventilation ducts or sprinklers, missing ceilings, detectors not properly mounted and missing fire alarms. Additionally, there are multiple instances of sprinklers not being installed in the ceiling. These issues need to be addressed by the quality department to ensure the proper functioning and appearance of the Sub-ceilings, as well as to ensure safety |
| Sub-sealing frequency list | Ceiling not completed Adjust ceiling Ceiling profiles damaged Ceiling is missing Replace ceiling plate | Ceiling rides on ventilation or sprinkler Adjust ceiling Sprinkler is missing Adjust ceiling profile Ceiling damaged |
The subceiling issues show a similar repetition trend, but the LLM summaries still provide a good overview of the data set categories. Compared to clustering, the LLM method requires less keyword interpretation and preprocessing. While the subceiling frequency lists are more precise than those for fire-sealing, issues like not combining “Missing ceilings” and “Ceilings incomplete” persist.
When comparing the content LLM method with the K-means clustering method, the LLM is easier to use and carries a lower risk of misinterpretation. The method is simple but requires a computational time similar to that of the keyword LLM method. An advantage is allowing users to interpret the data set with less domain knowledge, though this also makes interpretation errors harder to detect. The prompt-based summaries provide a broad overview of project issues and help identify more nuanced topics. The flexibility to modify prompts is an advantage, allowing for personalised adaptation. However, the summary responses using the prompting method tend to be lengthy and contain some repetition.
5. Discussion
Building defects in production are causing increased project costs and time delays, creating incentives for addressing and preventing them. Despite these incentives, lack of time, processes and automated data analysis methods limit the contractor’s usage of building defect data. While software for digital reporting has automated data collection, the method proposed in this study aims to automate and simplify defect analysis. Though the typology of building defects identified in this study is not new, the proposed method delivers results faster than traditional manual methods and requires less preprocessing.
Previous research shows that most building defects are found in the categories “doors and windows”, “mechanical, electrical and plumbing”, “carpentry and joinery” and “finishes” (Shooshtarian et al., 2023; Noh et al., 2023; Bazzan et al., 2023; Gurmu et al., 2023; Yang et al., 2021, Zhong et al., 2019). The categories” fire sealing” and” sealing” found in this research might be included in the category “mechanical, electrical and plumbing” as most previous research use predefined defect categories, which likely put the sealing issues in the category where the equipment in need of sealing belongs. For example, fire sealing of water pipes might be placed in the “plumbing” category. Some sealing and fire sealing problems might also be included in “doors and windows” since many doors must be sealed to ensure fire or soundproofing. The same reasoning puts subceiling problems in the category “finishes”.
The studies of Wang et al. (2024a), Shooshtarian et al. (2023), Yang et al. (2021), and Zhong et al. (2019) all identified defects in reinforced concrete structures as common. However, this category was absent from the data set analysed in this study. The projects providing data for this study began reporting problems during a later production phase after the structural framework had been completed, which likely explains the absence of concrete defects.
A difference between this study and others (Tian et al., 2021; Jeon et al., 2022; Yang et al., 2022; Yang et al., 2021) is that while those studies predefine defect categories and use AI models to classify defects accordingly, this study allows the AI model to define the categories. This approach offers flexibility but can complicate long-term defect monitoring as the model might choose different categories on different analysis occasions. A solution can be to initially perform the steps proposed in this study and use the results to predefined categories for more consistent monitoring over time.
For defect analysis to support quality improvement, it is crucial to identify both the main categories of defects and subcategories. Different subcategories, like broken subceiling tiles, damaged profiles or subceilings interfering with ventilation, may require distinct corrective actions, such as updates to work descriptions or checklists. Tian et al. (2021) used a TF-IDF method to present subcategories as a knowledge graph, while this study used LLM-based keyword extraction. The LLM method provided simplified mapping with original text, helping users better understand defect clusters and decide on appropriate similarity thresholds. However, it is sensitive to variations in how the same defect is described, emphasising the importance of input standardisation (Sadatnya et al., 2023). Bazzan et al. (2023) proposed a model where users select from predefined problem descriptions. Data collection, analysis, and feedback loops can be improved if a contractor can use such predefined descriptions. Standardised descriptions would also simplify financial management, as issues like “fire sealing missing,” “fire sealing damaged” and “defective fire sealing” may require different financial actions and accountability.
Regularly conducting the analyses suggested in this paper can enable predictions about the types and frequency of defects in new projects. These predictions are particularly valuable during early project phases, such as when selecting between different conceptual designs or managing risks. However, for such predictions to be effective, it is crucial to link defects to specific building components. Additionally, the building components must be described in sufficient detail. For example, suppose floor defects are associated with specific floor types. In that case, predicting the differences in defects occurrence between options such as in situ casted concrete floors and prefabricated hollow-core floors becomes possible. Enabling such comparisons can support data-driven decision-making and motivate quality improvement actions.
The simplicity of the GPT-based method makes it accessible to project and site managers, supporting existing analyses and enabling new ones often not conducted due to time constraints or lack of expertise. To further enhance data analysis flexibility for the data set in this study, a development could be creating a data chatbot, which would allow users to describe, in text, the specific statistics they want to analyse. By monitoring the chatbot’s queries, the organisation could gain insights into which statistics are interesting to projects, helping to align analysis efforts with user needs.
The data set used in this study included defect locations provided as coordinates within a BIM model. However, as the focus was on text processing techniques, these locations were not incorporated into the analysis. Previous research (Gurmu et al., 2023; Shooshtarian et al., 2023; Yang et al., 2021) has demonstrated that defect locations can offer valuable additional insights. Incorporating this factor into future analyses could enhance the study’s findings.
This study focused solely on the content and frequency of various building defects. Understanding the cost of these problems can offer valuable guidance for contractors aiming to prioritise quality improvements. However, linking defects to costs is not trivial, as cost data is often recorded in separate software and not directly associated with specific defects. Additionally, defects incur costs regarding the time required to address them, but this time is often not logged. Gurmu et al. (2023) examined rectification periods, the days between a request being raised and the issue being resolved. However, rectification time is not always a reliable cost indicator, as it may include waiting periods for different disciplines to complete their work. Future research should explore automated methods for linking defects to their associated costs.
The methods explored in this study can enhance a project-based organisation’s knowledge generation if standardised and carefully implemented. Although the primary application was on defect data from hospital projects, these methods were also successfully tested on on-site data from moisture safety rounds and after-sales warranty data, indicating they can be applied to a range of text-based data with titles and descriptions. Organisational insights from this approach help identify areas for quality improvement, while project performance insights allow monitoring of quality measures’ effectiveness.
The introduction of computer vision in the construction industry can further aid in identifying defects. AI models trained to detect building defects in images can be linked to company-defined and standardised defect descriptions, which would help the industry take a step forward in automating and standardising data collection. Combined with the analysis method suggested in this paper, which helps identify critical and common defects, these defects can be detected earlier in the process, supporting proactive defect management and reducing rework.
6. Conclusions
This study proposes a method for generating insights from defect data collected during inspections. The method involves four data mining steps:
keyword extraction on the organisation level;
topic clustering on the organisation level using K-means;
keyword extraction on the organisation level using KeyLLM and Mistral 7B model; and
content analysis on the project level using GPT 3.5 Turbo.
The proposed K-means clustering method is fast but requires domain knowledge of building defects. The method helps contractors identify building defect categories and prioritise which issues to address. Based on the analysis of hospital building defects in this study, fire sealing, subceiling and jointing problems should be prioritised.
LLM-based keyword extraction is valuable for identifying common defect subcategories and provides a simple mapping between keyword clusters and original descriptions, reducing the need for domain knowledge. The results can be applied to reviewing work descriptions and checklists, supporting quality improvement efforts. However, the method is sensitive to variations in phrasing and may perform less well with short descriptions.
The three largest subcategories of fire sealing defects were missing fire sealing on pipes, missing gypsum and insulation, and general fire sealing deficiencies. For subceiling defects, the main subcategories were broken subceilings, missing component labels and entirely missing subceilings. In the case of general sealing and jointing defects, the largest subcategories were missing sealing, missing filler-piece sealing, and unsealed window sections.
The GPT-based content analysis is flexible and simple, making it suitable as a work support for site- and project managers, assisting and improving their project data analysis.
The data analysis in this study was limited to defects and production problems found during inspections. However, the method can be applied to similar data sets containing unstructured text with titles and descriptions, such as work safety and moisture inspections.
To further improve the usability of the results and understanding of building defects, the defect location should be integrated into the analysis. Location data can further support improvements in work descriptions and checklists. Another limitation of the study is that only the content and frequency of defects were examined. Linking defects to their associated costs is essential to facilitate the use of defect data as a support for decision-making. Therefore, future research should explore automated methods for connecting defects with cost data.
A possible future improvement in analysis flexibility and simplicity is the development of a data chatbot. A chatbot would enable users to submit questions in text format while allowing the organisation to monitor queries and gather statistics, helping to align analysis efforts with user needs.
A grant from the Development fund of the Swedish construction industry enabled this research. The authors also thank NCC Sweden AB for funding contributions and for providing the data set.
Funding: SBUF 13949.

