Demand For Business Intelligence and Needs in Higher Education
According to Peter Sondegaar, senior vice-president and global head of research at Gartner, “By 2015, 4.4 million information technology (IT) jobs will be created to support big data, generating 1.9 million IT jobs in the United States. In addition, every big datarelated role in the United States will create employment for three people outside of IT, so over the next 4 years a total of 6 million jobs in the United States, will be generated by the information economy” (Gartner, 2012). According to MarketsandMarkets, the total market value in big data will grow by 25.5% by 2018. The same research firm also pointed out that business analytics market will grow at a compound yearly rate of 32.7% to 2019. McKinsey & Company projects that there will be “a shortfall of between 140,000 and 190,000 deep analytical big data professionals by 2018” (MarketsandMarkets, 2013).
With this increasing demand for business intelligence, educational institutions are beginning to also see the need for hiring business intelligence specialists to harvest data from educational systems and turn it into meaningful information. This information presented in a visual format allows for academic programs to provide evidence of student achievement throughout online programs. As for other modalities of instruction, there may be gaps in the data that hinder the ability to provide an accurate picture. For example, in a face-to-face classroom where transactions take place through paper and white boards, there will not be any data collected electronically. To help bridge this gap, many academic institutions are beginning to work around this by implementing multimodal templates for more traditional classroom environments.
Multimodal Templates and Learning Management System Analytics
One of the ways in which higher education institutions can collect data for learning analytics is to use a learning management system in all courses, regardless of modality of instruction. Picciano (2014) pointed out many of the benefits and concerns of using learning analytics in blended environments, explaining there may be gaps where the learning system might have been used in different ways. The use of the learning management system needs to be consistent where the same types of activities can produce rubric statistics results and the learning outcomes can be tracked and reported at any level within the institutional hierarchy. I happen to have first-hand experience with implementing a “multimodality template,” which has been an interesting journey. The multimodality template used for all courses within the program is structured in a way that provides consistency, but also allows the flexibility for instructors to teach the course as they would like in face-to-face, blended, and video enhanced courses, while keeping the same structure as the online courses. This can be confusing and especially difficult for instructors who may not have any experience using the learning management system.
In my experience, instructors have been accepting and appreciative in using the multimodality template as long as they have an opportunity to add course materials to the template where it may fit into the course and meet the student learning outcomes. All courses within the program have development guidelines to follow. The courses contain case studies, team projects, research activities, exams, and other assessment activities that may use the same type of rubric for grading. The assessment activities use the same rubric or instrument in grading, which allows for a report to be generated across the program at any time, displaying rubrics statistical data and a visual summary of student performance. In addition, all activities have an alignment created through the system to the learning outcomes at the course level and at the program level.
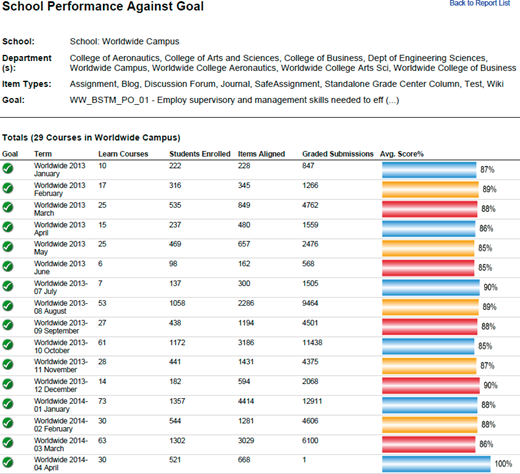
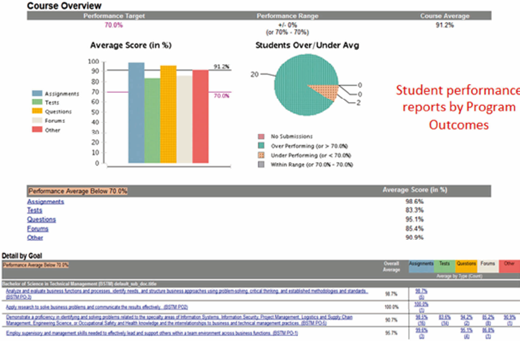
As students submit work and the work is graded, there are evidence trails left behind of student performance data (New Media Consortium & EDUCAUSE Learning Initiative, 2014). These data are collected and can be used in course performance reports and longitudinal analytics reports showing student performance by learning outcomes at any level within the institutional hierarchy and at any point in time. Instructors, program chairs, and administrators can all view the report. There were thousands of graded assessments captured and reported on as aligned to a program outcome (see Figure 1). This was across five different modalities of instruction in over 150 locations worldwide. In addition to the learning analytics report in Figure 1, the Student Performance Report in Figure 6 shows visually how students performed against a program outcome within an individual course as aligned to different types of assessment activities. These are just a few examples of how learning analytics can be leveraged to support academic program assessment. Another tool to leverage already collected data is the end of course evaluations.
End-of-Course Evaluations Analytics and 3D Analytics
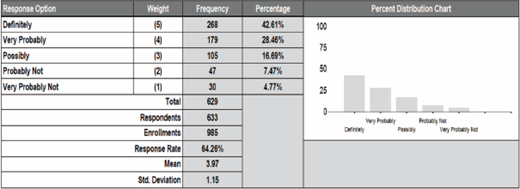
In addition to using the learning management system to collect and report information on student performance, other systems such as the end-of-course evaluation systems can be structured in a manner that allows reporting to be tied to program outcomes. As shown in Figure 2, these reports allow program chairs and department chairs to have a high level view of the results of the course evaluations for all courses mapped to a program outcome. This is an aggregate view of just one of the survey questions. All questions can be viewed in the same manner throughout the program and as aligned to program outcomes. As Ferguson (2012) points out, these reports are not necessarily linked to a particular approach to teaching and learning and can be used regardless of modality of instruction.
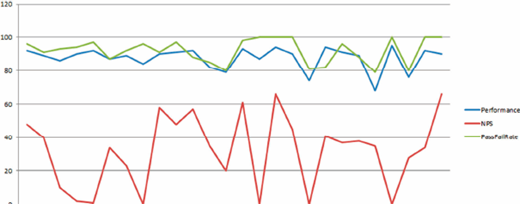
Another technique in taking advantage of end of course evaluation results is to use the data from the question related to if a student would recommend the course to a friend or colleague to calculate the net promoter score (NPS). The NPS is used in industry by calculating sections of customer recommendations from surveys (Nazemi & Neghabi, 2014). Once the NPS has been calculated for courses aligned to a program, the performance scores as well as pass/fail rates can be combined to establish what could be called “3D Analytics.” This looks across multiple courses, multiple, sections, and multiple modalities of instruction as shown in Figure 3 to examine potential trends throughout the learning analytics models
Rubrics Statistics Reports
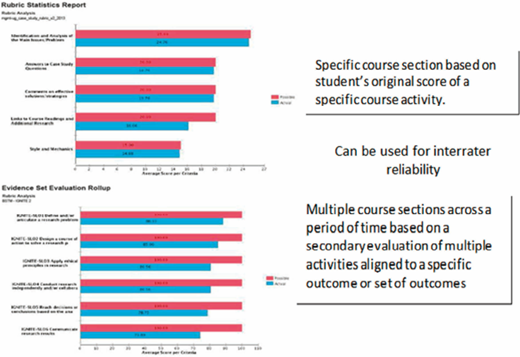
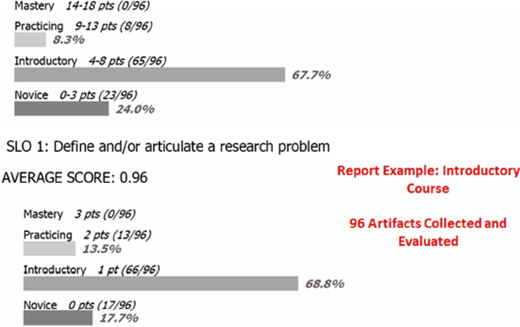
Rubrics are often used as an assessment instrument and can be provided to allow instructors to score work electronically through an interactive rubric. Rubrics can be shared across learning modalities for the same type of course activity. For example, many higher education institutions use an adaptation of a research rubric to score research activities at the introductory, practicing, or master levels. Once an interactive rubric is used across courses as aligned to a performance outcome at the course or program level, a rubrics statistics report can be used to identify patterns and areas within student research that need to be improved. In addition to the primary rubrics report used within the courses, the same rubric can be used as a secondary evaluation. Student artifacts are collected and randomly sampled. A secondary evaluator is then assigned and sent an electronic notification. The secondary evaluator uses the same rubric to electronically submit the evaluations. The rubrics statistics report results can then be compared to the original results for interrater reliability. An example of the rubrics statistics report is shown in Figure 4.
Digital Repository Analytics
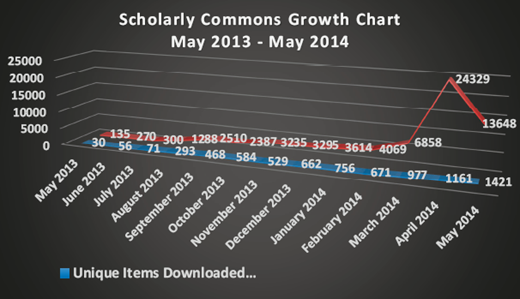
Many higher education institutions use digital repository systems to collect student publications and host conferences. These digital repositories are often linked to analytical tools either through Google or within the individual software tools provided in the system. This is yet another support mechanism for assessing program research activities both at the graduate and undergraduate levels. Dashboards and reports showing the number of times the publications have been downloaded or cited as well as the level of activity within the conferences that are hosted through these systems can add to the academic assessment mosaic as evidence of student performance as aligned to research activities within degree programs. Longitudinal reporting capabilities also visualize the increase or decrease in research activity throughout the academic year. An example of a digital repository report is shown in Figure 5.
Digital Portfolio Analytics
Digital portfolios or ePortfolios have also been increasingly used for capstone projects within programs. These, too, often have the ability to create analytical reports to show student performance through their educational experience in the program. An example of an analytics report used to show student performance as aligned to outcomes for undergraduate research is included in this article in Figure 7. There were 96 research artifacts collected within a specific undergraduate program through the digital portfolio system. These artifacts were scored by a secondary evaluator to show student research abilities within an introductory course. The results were then compared to the original scores by the instructors who were teaching each course.
Price (2013) also implemented a digital portfolio project as a capstone assignment. The study was conducted at the University of Wisconsin. A selected number of capstone courses in a business communication program provided a digital portfolio template to each student. Elements within the template aligned specifically to the program outcomes. The digital portfolios also included philosophies believed to address the university’s quality enhancement plan outcomes. A variety of measures to allow for a valid evaluation and assessment of the program were included. In addition, podcast videos were used to summarize the student’s digital portfolio and presented the digital portfolio at the end of the term. This approach required all instructors to use the same process within all courses selected, regardless of modality of instruction (Price, 2013).
Enrollment Dashboards
Another useful way to leverage learning analytics is in the use of educational dashboards. Ellis (2013) argues that there are limitations to learning analytics in that it may be too complicated to operationalize and that learning analytics often do not provide an accurate depiction of all students. I would agree with these limitations; however, if all students are represented within the system accurately, such as with the case of enrollment numbers within an online program, there could be opportunities to make good use of learning analytics. This is the case in using enrollment dashboards. The enrollment dashboards provide a visual at-a-glance overview of enrollment data and statistics from one or more educational systems. The original data are located within the student information system. As enrollment numbers change, the dashboard is automatically updated, which allows administration to keep track of enrollments and know for example when a degree concentration has reached a level that may call for an additional degree to be launched. Whether looking at enrollments or student performance, if used properly, dashboards can provide the ability to identify and predict patterns to help make strategic business decisions.
The Future of Learning Analytics
Just a few of the possibilities have been outlined in this article; however, the opportunities to leverage learning analytics are expanding very quickly as instructional technologies become available and education transitions into electronic-based systems. Martin and Sherin (2013) gave several examples of ways to sample, capture, reduce, and finally find patterns using data collected throughout various instructional technologies used, such as the learning management system, social media, digital portfolios, and even e-books. Simulation and gaming software is also being reviewed to determine how student actions are related to performance objectives. This is often referred to as stealth assessment. Shute and Kim (2013) describe stealth assessment as an approach that uses evidence directly within the learning environment. One way to use stealth assessment techniques is in the use of gaming. As students play the game, their actions and interactions with other students are recorded and used to demonstrate whether or not they have met the performance objectives (Shute, Ventura, Small, & Goldberg, 2013).
Conclusion
There are certainly many tools and techniques available to use learning analytics in support of academic program assessment. Many of these techniques are underdeveloped and yet to be explored. As always, it is imperative to also focus on the purpose of the results, the accuracy of the information, and the next steps in making sense out of what the learning analytics may provide. A high level view is simply a starting point, showing where there could be a potential area of concern or area of opportunity. I look forward to further exploring learning analytics throughout multiple modalities of instruction and using a variety of tools and techniques in support of academic program assessment in higher education!
About the author