

Data from three sections of 200-level college statistics courses (student N = 85) were examined to evaluate the relationship between scaffolded assignments, time spent in the course, page views, and student performance. Strong positive correlations were noted between scaffolded assignments. Key formative and summative assignments also showed strong positive correlations indicating course effectiveness. Time students spent in the courses and their number of web page views yielded positive correlations with the end of course grades. Time spent completing key assignments such as homework preparation for the midterm and the midterm exam also showed positive correlations with student performance. However, time spent and page views failed to show strong positive correlations with short written assignments or discussions. Future research recommends using the study methodology to determine course effectiveness (relationship of formative and summative assessment scores) prior to measuring student performance in future research. The study methodology should be replicated in different university and college settings with varying term lengths. Future research should also include examining the quality of instructor/student interaction in discussion boards concerning student performance.
Purpose
Student effectiveness in online courses has many variables. This study explored a methodology for ensuring a course effectively provided scaffolding between formative and summative assignments (Lam & Weikle, 2021). The analysis of course effectiveness in scaffolding assignments may be just as important as the study results. It should be a part of any analysis of student performance based on other variables. Student time within the course and web page views were also examined to determine the relationship between these variables and student performance. Suppose educators can identify key indicators and behavioral traits associated with improved student performance. In that case, we can design courses and implement instructional strategies to encourage behaviors that will make students more successful.


Significance Of The Study
The stud/s significance is twofold: (a) Demonstrate how to evaluate a course concerning its effectiveness in scaffolding from summative to formative assignments, and (b) Test the hypotheses that the amount of time a student spent in the course or the number of page views has an impact on student performance.
Introduction and Literature Review
Student engagement in undergraduate asynchronous online science, technology, engineering, and mathematics (STEM) courses is a focus of both course designers and instructors. In the online classroom, there are three types of interactions: student-content, student-student, and student-instructor (Gilbert & Moore, 1989). Active learning strategies in asynchronous online learning environments engage all learners in the learning process through one or more types of interaction. Active learning improves performance in STEM courses (Freeman et al., 2014), particularly among underrepresented students (Ballen et al., 2017; Estrada, 2017). Examples of active learning strategies in asynchronous online courses include discussion boards, minute papers, think-pair-share, mind maps, and low-stakes online quizzes (Harris et al., 2020; Prince et al., 2020).
Active learning and self-regulated learning (SRL) share common elements, especially in the asynchronous online learning environment. Both position the learner as an active participant, with the instructor facilitating learning. However, active learning involves specific strategies proposed by the instructor, while SRL encompasses student-selected and student-directed strategies to promote learning. Students who have strong self-regulation skills set learning goals, take responsibility for their learning, and are active participants in the learning process by monitoring, regulating, and controlling behavior relative to their goals (Chung et al., 2020). Student development of SRL skills stems from personal, behavioral, and environmental factors (Schunk, 1989). SRL can be evaluated according to cognitive, metacognitive, behavioral, motivational, and affective factors (Alexiou et al., 2010; Panadero, 2017). Students that demonstrate certain SRL behaviors tend to perform better on summative assessments (Lawanto et al., 2017; Zimmerman et al., 1990).
The Importance of Scaffolding
In order to effectively evaluate student performance, researchers should also be concerned with how effectively formative assessments scaffold student knowledge to accomplish summative assessments. Lam and Weikle (2021) emphasized the importance of scaffolding, particularly for distance learning students, directly contributing to students’ online success. An argument can be made regarding the importance of ensuring courses are effectively scaffolding before the impact of other variables on student performance can be meaningfully interpreted. This relationship is depicted in Figure 1.
 The schematic representation shows the learning process using a flow chart. The first box is marked Active Learning Task. An arrow points from this box to the second box, which is marked Active Learning Activity. This is labeled S R L: Performance Control Stage. A second arrow points from this box to the third box, which is marked Evaluation and Instructor Formative Feedback. This is labeled S R L: Self Reflection. An arrow points from this box to a fourth box marked Summative Assessment Task. A dashed arrow points from this box to a fifth box marked Next Assignment. An arrow also points back from the Evaluation and Instructor Formative Feedback box to the Active Learning Task box. The active learning task is labeled SRL: Forethought
Student engagement with scaffolded active learning activities in an asynchronous online course.
The schematic representation shows the learning process using a flow chart. The first box is marked Active Learning Task. An arrow points from this box to the second box, which is marked Active Learning Activity. This is labeled S R L: Performance Control Stage. A second arrow points from this box to the third box, which is marked Evaluation and Instructor Formative Feedback. This is labeled S R L: Self Reflection. An arrow points from this box to a fourth box marked Summative Assessment Task. A dashed arrow points from this box to a fifth box marked Next Assignment. An arrow also points back from the Evaluation and Instructor Formative Feedback box to the Active Learning Task box. The active learning task is labeled SRL: ForethoughtStudent engagement with scaffolded active learning activities in an asynchronous online course.
Time in Course and Page Views as Indicators of Student Performance
There are various methods used to measure student engagement in asynchronous online courses. Common student behaviors used as measures include observational learning behaviors like page views (Rohlíková et al., 2012). Student-content interaction behaviors that measure the performance control phase of SRL are the time spent with a resource or activity and the access frequency (number of views) (Kim et al., 2018). This page viewing behavior can also be viewed as a measure of active reading, a feature of active learning (Diana et al., 2016). In some studies, behaviors like opening files (page views) have been significantly correlated to more robust student performance (Buckley et al., 2021; Zhang et al., 2020). However, some reports indicate no correlation between page views and grades (Haney, 2016). It may be more likely to see this correlation when investigating a single discipline at a time (Finnegan et al., 2009).
This study builds on the work of Rohlíková et al. (2012) by first examining the relationship between formative and summative assignments scores, then student performance based on time spent in the course and page views.
Research Goals
The research had three main goals.
Determine the relationships between summative and formative assignments. Additionally, we wanted to see if grouped/key assignments in the course were positively associated with the end-of-course grades. Strong correlations would indicate that the course effectively used formative assignments to prepare students for summative assignments.
Determine the relationships between the amount of time students spent in the course and grouped/key assignments in the course, as well as the end-of-course grades.
Determine the relationships between the number of student page views and grouped/key assignments in the course, as well as the end-of-course grades.
Hypotheses
H1. There is a significant positive correlation between formative assignment scores and summative assignment scores.
H2. There is a significant positive correlation between time spent in the course and end-of-course grade.
H3. There is a significant positive correlation between page views and end-of-course grades.
H4. There is a significant positive correlation between time on task and homework/quiz scores.
H5. There is a significant positive correlation between page views and homework/quiz scores.
H6. There is a significant positive correlation between time spent working on the midterm exam and midterm exam scores.
H7. There is a significant positive correlation between time spent in the course and grades on assignments and discussions respectively.
H8. There is a significant positive correlation between page views and grades on assignments and discussions respectively.
Methods
Three sections of an undergraduate statistics course were randomly selected. Over 3,400 grades for 85 students were examined in the following areas: chapter homework, module quizzes, a midterm review exercise, midterm exam, discussions, and assignments. We also collected data on page views and the total time students spent in the course. Data were pulled after the courses had concluded. Due to the after the fact nature of this research, faculty, and students were unaware that a study was being done.
The Course Used in the Study
Annual enrollment is approximately 2,500 per year, with over 90% of the sections taught online. All sections of the course used the same text, third-party integration package (Pearson MyLabStat), homework, quizzes, midterm course discussions, and assignments. All sections used the same syllabus and grade weighting. The terms were nine weeks in length with activities split into nine modules which were seven days in length. Modules typically consisted of one-to two-chapter homework assignments and a quiz. The homework assignments did not have time limits, and students had more than one opportunity to complete the homework, which served as a scaffolding assignment for the quizzes. Most modules included a discussion and an assignment that reinforced concepts. Discussions were highly interactive featuring instructor-to-student and peer-to-peer information sharing. A midterm exam over the first four modules in module five and a practical final exam in module nine were the two main summative evaluations of student performance.
Participants
Study participants were students enrolled in the fall 2021 introductory college statistics course sections. These students were typically working adults who attended college part-time. Students were taught by the faculty member who developed the course. Students self-enrolled into the online course sections used in this research and were unaware that data would be used for study analysis.
Demographic Data
Data on 85 students were collected to include approximately 3,400 grades, the time each student spent in the course, and the number of page views by each student. Seventy-eight students were male, and 7 were female. Female students averaged higher overall course grades (M = 93.5, SD = 4.6) than men (M = 83.3, SD = 21.3), t(40), 3.4, p < .001. Students were typically in their mid-30s, taking two courses during a 9-week, slightly accelerated term. Approximately 50% of the students served in the military, with another 30% classified as veterans or spouses of military enlisted personnel. All students took the course online and self-enrolled.
Design
The research design can be classified as post hoc correlation STEM scholarship of teaching and learning research. Because there was no interaction between the researchers and students, the study methodology was approved and exempt from extensive human subject research review by the university institutional review board (#22-074) prior to data collection.
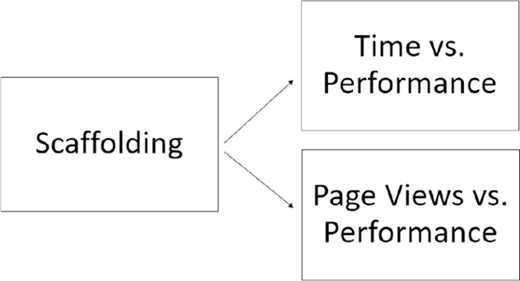
The three main aspects examined through the data were: (a) the relationship between scaffolded assignments; (b) student time in the course versus their performance and (c) student page views versus performance as seen in Figure 2. This approach stems from the argument by Lam and Weikle (2021) that it would be faulty to conclude student performance if the course itself did not provide effective scaffolding for online (or distance) student learning. Once we were reasonably sure the course was effectively designed, the focus changed to measurable student indicators such as time in the course, page views, and student performance.
Treatment of the Data
Data from three sections of a sophomore statistics course offered in the fall of 2021 were collected and examined after the end of the term (N = 85). Additionally, formative and summative scores were compared to determine the strength of correlation, evaluating the idea that formative assignments provided effective scaffolding for summative assignments.
We used an alpha level of p = .05 to evaluate a t test examining male and female overall course scores (previously reported in the Demographics section) and Pearson’s r, along with the p value, to determine the strength of correlation and significance of time on task, page views, and formative assignments on student performance. Some multivariate results reflecting assignment groups were also reported using the coefficient of determination (r2), F and p values as appropriate. (Gay et al., 2009; Gould & Ryan, 2012).
Results
Data examined in this study involved three major areas we defined as (a) scaffolding between summative and formative assignments, (b) the amount of time students spent in the course and student performance, and (c) page views and student performance. Correlations of each one of these areas were examined with the end-of-course grades, key assignments (or assignment categories), and discussions. Data from 85 students were used, and the figure of “r(84)” reported in the correlation results refers to the degrees of freedom. In the case of multiple regressions, the numbers in the parenthesis, for example, “ F (2, 82)” will add to 84 degrees of freedom for the 85 students.
Scaffolding
Data were examined regarding correlations of major assignment groups with the end-of-course grades. We also examined the relationships between summative and formative assignments, assignments with the end-of-course grades, and discussions with the end-of-course grades.
Relationship Between Homework And Quizzes on End of Course Grades
The average score of 15 homework assignments showed a strong positive correlation with end-of-course grades (r (84) = .97, p < .001). Additionally, the average of 9 quiz scores showed a strong positive correlation (r(84) = .94, p < .001) to end-of-course grades.
Scaffolding: The Relationship Between Formative and Summative Assignments
Each module had graded homework and a quiz. Strong, positive correlations for all nine modules between homework and associated module quiz scores yielded statistically significant Pearson’s r values between .84 and .94. A midterm review homework assignment was also significantly correlated with the midterm test score (r(84) = .91, p < .001).
Scaffolding assignments had similar relationships with Final Practical Exam scores. All homework and quizzes, when examined as a regression model, showed a strong positive correlation to final practical exam scores (r2 =.68, F(2, 82) = 86.38, p < .001). Taken as separate categories, homework (r(84) = .81, p < .001) and quiz scores (r(84) = .80, p < .001) both contributed to this strong positive correlation with the final practical exam scores.
A key discussion in Module 8 served as a formative exercise for the practical final exam (summative). Discussion instructions included a video showing how data were calculated in MS Excel and the proper steps to interpret the results. Students had already run t tests in StatCrunch as part of their homework and quiz assignments. The discussion asked students to evaluate provided MS Excel t-test results for a simulated problem, interpret the results, and then explain the results. The practical final exam asked students to run one of three possible types of t tests (one-sample, two-sample, or paired) in Excel after selecting data from a provided spreadsheet. Students were then asked to interpret the results and explain what the results meant. The discussion showed a moderately positive correlation to the final practical exam score (r(84) = .67, p < .001).
Relationship of Assignment Scores on End of Course Grades
The course had 6 one-to two-page writing assignments ranging from determining z scores and r values in MS Excel to critiquing data visualization examples. Other assignments were statistics in the media, statistics in advertising, and a reflection video on the course. Assignments and end-of-course final grades also yielded similar results. When taken as a group, the regression model yielded a strongly positive correlation between assignment grades and end-of-course grades (r2 = .92, F (6, 78) = 150.04, p <.001). The only assignment that was not a significant predictor for final course grade was statistics and the media. All others showed strong positive correlations with p values < .001.
Relationship of Discussion Scores on End of Course Grades
Discussion scores and end-of-course grades also showed a strong positive correlation (r2 = .90, F (8, 76) = 83.89, p < .001). The course had eight discussions actively monitored by the instructor for each course section. Topics included calculating a z score and determining its meaning, evaluating casino odds, viewing the normal curve related to product production, visualizing data, identifying data from unrepresentative samples, confidence intervals, and interpreting p values.
Relationship Between Time in the Course and Performance
We examined the relationships between time in the course and student performance on end-of-course grades. Key assignments such as homework, quizzes, the midterm, assignments, and discussions were also evaluated.
Student Time in the Course and Overall Course Grade
The amount of time students spent in the course showed a weak positive correlation to end-of-course grades (r(84) = .23, p =.033). Although this finding was significant, the low correlation coefficient shows that a large amount of the variance is not explained, meaning most of the variation is not explained by the amount of time students spend in the course alone.
Time Students Spent in the Course and Homework/Quizzes
The amount of time students spent in the course showed a weak positive statistically significant correlation to homework scores (r (84) = .25, p = .021). Additionally, the amount of time students spent in the course positively correlated with quiz scores (r(84) = .25, p = .020).
A midterm homework assignment and the midterm test are designed to allow students to use their notes. There was also a moderate positive correlation between time on task and both the homework (r(84) = .34, p < .001) and midterm test (r(84) = .41, p < .001) sores.
Time in the Course and Assignments
When assessed with a regression model, the six written assignments in the course did not show a significant correlation between time in the course and assignment scores (r2 =.07, F(6, 78)=.91, p = .490. However, time in the course and discussions yielded a different result.
Time in the course yielded a moderately positive correlation with discussion scores when viewed as a regression model (r2 = .19, F (8, 76) = 2.26, p = .032. The discussion on “confidence intervals we use every day” was the strongest significant correlation of the 8 discussions (r(84) = .24, p = .024) followed by “results from unrepresentative samples” (r(84) = .23, p = .024) and “why should companies design based on the normal distribution?” (r (84) = .022, p = .048).
Relationship Between Student Page Views and Performance
The number of page views and end-of-course grades yielded a moderately strong positive correlation (r(84) = .32, p =.003). Again, although the correlation was significant, the low correlation coefficient indicates that most of the variation is not explained by page views alone.
The number of student page views showed a moderate statistically significant correlation to homework scores (r(84) = .31, p =.004). Additionally, student page views had a positive correlation with quiz scores (r (84) = .27, p = .013).
Similar to the time on task/assignment regression discussed in the previous section, the number of student page views and assignment scores showed a weak, nonstatistically significant relationship when viewed through a regression model including all six written assignments (r2 = .14, F (6, 78) = 2.14, p =.06). Page views and discussion scores were also not significantly correlated with a regression model that included all 8 discussions (r2 =.10, F(8, 76) = 1.11, p = .37).
Discussion
The course used for the study showed effective scaffolding between homework, quizzes, midterm, and the final practical exam through strong positive correlations. Scaffolding discussion scores also yielded a high, moderate positive correlation to the practical final exam scores. The six written assignments and eight discussions were positively correlated to end-of-course grades. Scaffolding assignments seemed to prepare students effectively.
The amount of time students spent in the course and page views showed mixed results concerning their relationships with student performance. Overall, the total amount of time students spent in the course was positively correlated to end-of-course grades. Additionally, similar to the results noted by Zhang et al. (2020) and Buckley et al. (2021), the number of page views was positively correlated with the end-of-course grades. However, correlation coefficients were weak or moderate, meaning other variables also impact student performance.
Homework and quizzes were positively correlated with the amount of time students spent in the course. Additionally, time spent completing a key homework preparation exercise and time spent completing the midterm exam were positively correlated with student scores on those two activities.
Discussion scores also showed moderate positive correlations with the amount of time students spent in the course. However, the relationship between time in the course and the six-course written assignments as a group did not provide enough evidence to support a significant positive correlation.
Page views followed a similar pattern to time with regard to showing significant correlations with homework and quizzes. However, statistically significant positive correlations were not observed when examining page views and assignment or discussion scores.
Conclusions
Any course used in a study to examine student performance indicators should also be evaluated for effectiveness. We examined the relationship between major assignment groups, key assignments, and end-of-course grades. We also evaluated the effectiveness of this course by testing the relationship between scaffolded assignments (summative and formative). In this study, we found strong correlations indicating an effective course design. We then were able to objectively examine the relationships between time students spent in the course, page views, and student performance from this foundation.
Although time spent in the course and page views yielded positive correlations with the end-of-course student grades, the r and r2 values indicated high levels of variability that were not explained, meaning other variables had an impact on student performance besides the two variables of time students spent in the course and page views. Additionally, there was little evidence to support the idea that time within the course or page views were strongly correlated with student performance.
Limitations
Limitations of this study include the online delivery of the course sections used in this study. These results may differ when applied to synchronous video learning or face-to-face classroom format.
The 9-week term length is also a limitation and can be viewed as a moderately compressed format, especially compared to more traditional 15-week term formats.
Students enrolled in the three sections used in this research were typically in their 30s, worked full time, and about 80% affiliated with the U.S. military. Generalizing these results to younger students or students with different backgrounds may lead to inaccurate conclusions.
The possible impacts of COVID on student performance were not measured and could impact results compared to time frames when COVID is not as prevalent.
Recommendations
Replication of this study is recommended in different university settings with differing term lengths and populations. This study methodology could be useful to future researchers in that we attempted to establish course effectiveness prior to examining data on student performance. Researchers cannot assume courses are effective until they are assessed. Generating student performance data from courses that are ineffective in scaffolding could lead to erroneous conclusions and place less apt students at a greater disadvantage.
Activity in discussion boards is typically where most teaching takes place in online courses. Future research on student performance should include an analysis of the quality of discussion between students and instructors. Information gleaned from such a study could result in best practices that could be shared among faculty.
Acknowledgment
As noted in the Methodology section of this study, the data collection and analysis used in this research were approved by the institutional review board prior to commencement. We have no conflicts of interest to disclose.
