Skip to article sections
Purpose

This study aims to identify and consolidate the most effective predictors of individuals' intention to use digital payments and their actual adoption by synthesizing findings across various digital payment technologies, including digital banking, mobile/digital wallets and QR code-based payments.

Design/methodology/approach

A meta-analysis was conducted on 41 empirical studies comprising 141 relationships. OpenMEE software was used to statistically synthesize the data and evaluate the predictive strength of different behavioral variables across the three main types of digital payment services.

Findings

Attitude, compatibility, habit, hedonic motivation, performance expectancy and trust emerged as the most effective predictors of behavioral intention to use digital payments. Website design was also identified as a promising factor. Behavioral intention was the strongest predictor of actual adoption, while habit significantly influenced the continued use of digital payments. The analysis reveals both shared and distinct factors across digital banking, mobile/digital wallets and QR code services.

Originality/value

This study fills a significant gap in the literature by empirically comparing key adoption drivers across different digital payment technologies using meta-analytic techniques. It offers a comprehensive and evidence-based understanding of the most influential factors, supporting practitioners and policymakers in enhancing digital payment strategies and financial inclusion initiatives.

In 2023, the global number of digital payment users reached 1.411 billion and is projected to rise to 2.838 billion over the next five years (Capgemini, 2025). This rapid growth is driven by widespread adoption of mobile devices and the increasing use of the internet. With over 5.35 billion internet users – approximately 66% of the global population – the internet has become a critical platform for technological progress, particularly in financial services (Datareportal, 2023; Isaac, Abdullah, Aldholay, & Abdulbaqi Ameen, 2019). The payment industry has been highly dynamic, marked by continuous innovation and resilience, especially during the pandemic. In response to global economic slowdowns, financial institutions are required to adapt and expand their services. Both consumers and businesses are increasingly favoring digital technologies in post-COVID-19 transactions due to their convenience (Ramayanti, Rachmawati, Azhar, & Nik Azman, 2024a, Ramayanti, Rachmawati, Setiawan, & Azhar, 2024b). Emerging payment methods such as e-money, mobile wallets, account-to-account transfers and QR codes are expected to gain popularity (Capgemini, 2022). In 2023, most cashless transactions – totaling 1.411 billion – were conducted via cards, credit transfers and direct debits, with projections estimating a rise to over 2.838 billion transactions by 2028, reflecting a 15% annual growth rate (Capgemini, 2022)

Digital payment systems enable seamless transactions, allowing users to make purchases anytime and anywhere (de Luna, Liebana-Cabanillas, Sanchez-Fernandez, & Munoz-Leiva, 2019). However, maximizing their benefits requires active user adoption (Jadil, Rana, & Dwivedi, 2021). Encouraging consumers to shift from traditional to digital payments is essential for success. Therefore, it is crucial for decision-makers – governments, financial institutions and app providers – to understand the key factors that influence consumer adoption of electronic payments (Giovanis, Athanasopoulou, Assimakopoulos, & Sarmaniotis, 2019). Despite growing usage, the adoption of digital payment methods varies. Service providers seek actionable insights into the factors that drive acceptance to optimize their marketing, product development and services. Consumers often struggle to choose the most suitable digital payment method. Understanding the main reasons behind adoption can help improve user experience and satisfaction. Numerous empirical studies have identified key predictors of user intentions and behaviors toward digital payment methods such as mobile wallets and digital banking. Given the increasing complexity and fragmentation of research in this area, a comprehensive review and synthesis of developments in digital payment systems is necessary.

This is particularly significant considering the rise of contemporary digital payment solutions such as QR code transactions. Accordingly, it is critical to understand the research on the factors that influence the intention and acceptance of digital payment usage over time and the possible alterations in these factors. The paper strives to examine the factors contributing the intention and adoption of digital payment systems by investigating essential services: digital banking, mobile and digital wallet services and QR code payments. This meta-analysis selected digital payment methods – namely digital banking, mobile and digital wallet services and QR code-based payments – based on their status as the most widely utilized digital payment services worldwide. This selection is supported by both recent academic literature and industry reports that consistently highlight these methods as the dominant forms of digital transactions across different regions and consumer segments. For instance, Capgemini's World Payments Report (2022) recognizes digital wallets, digital banking and QR code-based payments as key drivers of the global shift toward cashless ecosystems, affirming their central role in the evolution of the digital payment landscape. These technologies represent a diverse range of financial innovations that align closely with varying user preferences, infrastructure maturity and regulatory environments. Additionally, projected global usage data for 2025 further substantiates their relevance. Digital banking is expected to serve approximately 1.75 billion accounts globally, with an estimated annual transaction value of $1.4 trillion, equivalent to $2.7 million per minute (Malyshev, 2025). Mobile and digital wallets are predicted to be used by over half of the world's population, totaling between 3.2 and 4.8 billion users (MeaWallet, 2025). Meanwhile, QR code payments are forecasted to reach over 2 billion users, or around 29% of global smartphone users, with a projected transaction value of $5.8 trillion worldwide (Elad, 2025; Ricson, 2025). These figures and industry recognitions justify the inclusion of these specific digital payment methods in this meta-analysis. Their widespread adoption and distinct technological characteristics make them representative of contemporary digital financial behavior and allow for a deeper exploration of the factors driving users’ behavioral intentions and actual usage across diverse contexts.

This study addresses the following primary inquiries: What factors influence individuals' intention to use digital payments and their actual adoption digital payment methods, specifically digital banking, mobile and digital wallet services, and QR code payments?. Meta-analyses were performed for all digital payment methods combined and each method individually. Meta-analysis offers a more robust approach to synthesizing quantitative findings compared to traditional literature reviews. A meta-analysis allows researchers to methodically consolidate the findings of multiple studies and provide a thorough overview of all aspects observed within a particular research domain (Blut, Chong, Tsigna, & Venkatesh, 2022). Meta-analyses examine the relationships among theoretical constructs, predictors, and/or outcomes while considering measurement flaws, sampling mistakes and other variables that may lead to inconsistent results (Hunter & Schmidt, 2004). The meta-analysis generally exhibits reduced uncertainty compared to the individual studies it encompasses. This renders it valuable when individual research produces conflicting results (Neves, Oliveira, Santinib, & Gutman, 2023). Therefore, meta-analysis is an effective method to solve the research question posed.

Unlike previous meta-analyses, this study limits its literature search to 2018–2022, includes only Scopus Q1 and Q2 indexed papers, and selects studies that report t-statistics for each variable. It adopts the UTAUT framework, a widely used model for predicting technology adoption, which combines elements from eight technology acceptance theories (including TAM, TPB and TRA) and is validated across diverse global contexts (Ramayanti et al., 2024a, b). A meta-analysis with additional weight analysis is applied to identify the most effective predictors of behavioral intention and adoption. These results can support policymakers in identifying key factors influencing public acceptance of digital payments, thereby contributing to financial inclusion.

User behavior theories, such as the technology acceptance model (TAM), theory of planned behavior (TPB), diffusion of innovations theory (DIT) and unified theory of acceptance and use of technology (UTAUT), are widely used to explain technology adoption patterns. While TPB explains general behavior, TAM and UTAUT focus on technological acceptance, with key factors like intent to use and actual usage behavior driving adoption. The UTAUT model, which combines elements from eight theories (including TAM and TPB), has been empirically validated across various regions (America, Europe, Asia and Africa) and applications, enhancing its predictive accuracy for user behavior (Isaac et al., 2019).

UTAUT was further expanded into UTAUT2 to address consumer technology adoption, incorporating new factors such as Hedonic Motivation, Price Value and Habit, which removed the voluntary usage moderator UTAUT was further expanded into UTAUT2 to address consumer technology adoption, incorporating new factors such as Hedonic Motivation, Price Value and Habit, which removed the voluntary usage moderator (Venkatesh, Thong, & Xu, 2012). UTAUT2 demonstrates strong predictive power, explaining 74% of variance in consumer behavioral intention (Blut et al., 2022). This study uses UTAUT to analyze digital payment adoption, focusing on mobile and digital wallet services, digital banking and QR code payments, through a meta-analysis of relevant research to identify the most effective predictors.

Meta-analysis facilitates the synthesis of quantitative findings from previous studies on related subjects (Neves et al., 2023). Meta-analysis is a systematic methodology employed to assess the progression of prevailing ideas and serves as a mechanism to enhance existing theories (Blut et al., 2022). Meta-analysis facilitates the aggregation of extensive data from individual studies, yielding a thorough synthesis of all elements identified in a specific research topic (Blut et al., 2022). Meta-analyses enable researchers to aggregate extensive data from individual studies, including all variables pertinent to a research question (Hunter & Schmidt, 2004). Meta-analyses allow researchers to evaluate the extent to which a particular theoretical model explains a phenomenon compared to other alternatives. Moreover, meta-analyses facilitate investigating processes that mediate interactions, encompassing presence, order, direction and magnitude (Blut et al., 2022).

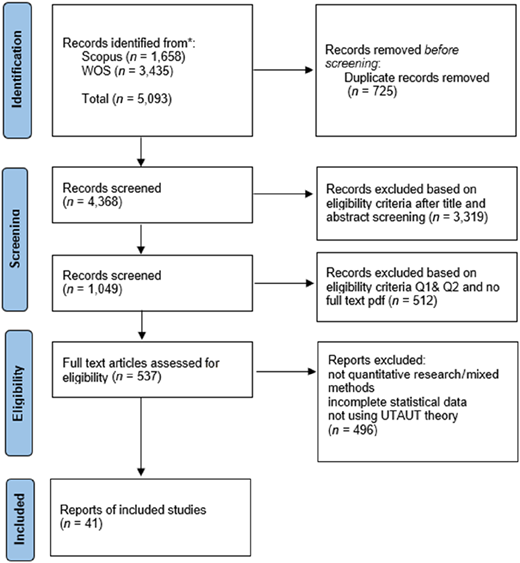
This meta-analysis was conducted employing conventional methodologies for meta-analytic computations. This research complied with the latest “Preferred Reporting Items for Systematic Reviews and Meta-Analyses” (PRISMA) 2020 criteria for proper reporting (Page et al., 2021). Figure 1 presents a PRISMA flowchart.

The literature search was conducted over one-month period in March 2023, using databases such as Scopus, Web of Science. This study conducted a search for keywords such as “Digital Payment” OR “E-Payment” OR “Electronic Payment” OR “Mobile payment” OR “M- Payment” OR “Mobile wallets” OR “E-wallet” OR “Digital banking” OR “Mobile Banking” OR “E-Banking” OR “E-money” OR “Electronic money” OR “Electronic Banking” OR “Virtual Payment” OR “QR Code Payment” AND “Adoption” OR “Acceptance” OR “Diffusion” OR “Usage” OR “Intention” OR “behavior Intention” OR “behavior Intention” OR “Use Behavior” OR “Use behavior in Scopus and WOS databases from 2013 to 2022.” This study chose Scopus and WOS because they are two of the largest databases encompassing a broad spectrum of subjects, through a rigorous peer-review process, thus increasing the credibility and reliability of the study results (Ramayanti et al., 2024a, b). These two databases are regularly updated with the latest articles, ensuring that researchers have access to the most up-to-date research in their fields and a more sophisticated data search and filtering process, allowing researchers to find highly relevant articles quickly and efficiently. It also provides a feature to save in rare form, making it easy to import data into the medley application this study uses in the data processing.

The inclusion and exclusion criteria for this paper are detailed in Table 1. This study limited the search period to the last 2013–2022 years to ensure that the references used were the most relevant and up-to-date. Using the most recent references will help update the understanding of the methods used in the research field. This study also looked at Q1–Q2 rankings because journals with Q1 and Q2 rankings tend to have more rigorous selection and peer review processes. The research contained in these journals is often based on strong research design, appropriate data collection methods and proper statistical analysis. Therefore, using references from high-quality journals can provide a more substantial basis for systematic literature review and meta-analysis studies. The coauthors of this study examined the selected papers to determine whether or not they fulfilled the inclusion criteria. When there was uncertainty, all four reviewers worked together to discuss and decide whether the manuscript should be included or excluded. In this stage, this study used Mendeley and Excel software.

Utilizing this strategy necessitated selecting quantitative research encompassing sample size data and t-values. Following our selection process, 41 publications satisfied all requirements and were eligible for meta and weight analysis. Data were extracted from each article, including year of publication, source, independent variable, dependent variable, t-statistic value for each association, methodology, sample size, publisher and service type. Several steps must be executed to derive the aggregated estimate of the association in question. After compiling all research, it is essential to unify all variables with equivalent meanings that may be referred to by different terminologies. This approach will also facilitate the identification of the most frequently utilized dependent variables and the most commonly investigated relationships. Thereafter, meta-analyses can be performed as appropriate.

Initially, the main focus of the investigation was to extract the correlation of the dependent and independent variables from the articles. Nevertheless, variable names occasionally result in distinct variable names having identical significance. Actual use and adoption are synonymous. Hence, it is essential to integrate variables under a unified label before commencing the analysis, mainly if they signify the related viewpoint. This procedure was executed for the dependent and independent variables. The classification method and data acquisition procedure were based on prior research in the meta-analysis performed by Blut et al. (2022). Once the coding categorization criteria were established, three research assistants categorized the effect sizes. Following this procedure, a total of 141 associations were found. However, only 23 of these associations satisfied the eligibility criteria for inclusion in the meta-analysis, as only relationships that happened two or more times were considered. The primary outcome variables identified in the selected relationships were intention to use digital payments and their actual adoption of digital payment. The codification of these variables is revealed in Table 2.

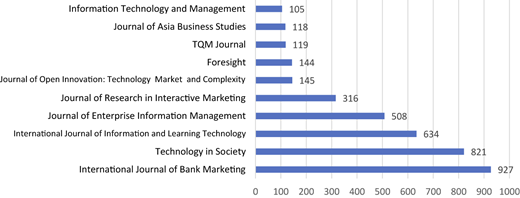
The analysis indicated that the International Journal of Bank Marketing garnered the significant citation count, totaling 927 as of 2023. Citation figures for each publication are accessible on Google Scholar. The Technology in Society journal has amassed 821 citations, whereas the International Journal of Information and Learning Technology has obtained 634 citations. Figure 2 illustrates the detailed information concerning the ten most cited journals.

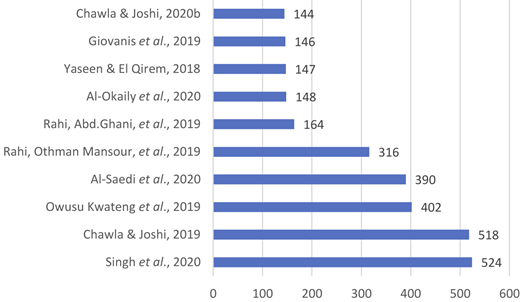
The article with the highest citation count is authored by Singh, Sinha, and Liébana-Cabanillas (2020), totaling 524 citations. This is succeeded by Chawla and Joshi (2019), with 518 citations and Kwateng, Atiemo, and Appiah (2019) with 402 citations. Figure 3 illustrates the data concerning the ten most cited authors.

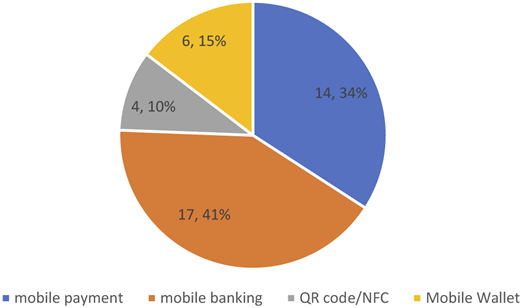
Figure 4 illustrates the distribution of service dimensions associated with digital payments. The majority of the papers in this study concentrate on mobile banking as the principal digital payment service, comprising 14 articles or 34% of the total. Prior researchers have thoroughly examined mobile banking over the past five years. In contrast, due to their recent emergence as a digital service, research on QR codes is scarce, with only four studies published in the last five years. Investigating this facet of the service presents a unique research opportunity.

The subsequent phase in producing meta-analysis data involves amalgamating the statistical data into article findings. The statistical data from the 41 previously acquired articles were summarized in this instance. This stage involves synthesizing statistical data from multiple research that have been examined. The statistical data may include mean values, standard deviations, sample sizes and t-values. The statistical data about each study are transformed into effect sizes for comparison and integration. This step can only be performed if the values utilized are statistically independent. The term effect size indicates the significant relationship between two specific variables. The methods used are statistically independent. The effect size is calculated using the Pearson coefficient (r) for each pair of variables in each research sample. Nevertheless, it is essential to acknowledge that not all research samples employed the Pearson coefficient (r); instead, they utilized alternative statistical matrices. Statistical measures may include t-values and p-values. Statistical results can be transformed into r, where the r value is obtained from the root of the squared t-value divided by the t-value squared and the degrees of freedom (df).

Subsequently, the data must be processed with specialized meta-analysis software. The research employed the OpenMEE tool, which stands for Open Meta-analyst for Ecology and Evolution. OpenMEE addresses the need for dependable and accessible meta-analysis software. Its cross-platform design, combined with an intuitive graphical user interface (GUI), enables researchers to leverage a wide range of statistical functionalities provided by R without necessitating prior programming knowledge.

Table 3 displays the outcomes of the meta-analysis, encompassing two distinct variables: intention to use digital payments and their actual adoption. Based on recent meta-analysis recommendations, this study exclusively incorporated studies that provided comprehensive statistical values, specifically those that included p-values and t-statistics in our analyses. To calculate them, it was necessary to gather a set of quantitative measures, including statistically significant and non-significant associations, effect sizes and sample sizes (Neves et al., 2023). The effect sizes obtained from the meta-analysis were adjusted to account for differences in sample size, as described by Hunter and Schmidt (2004). The decision to apply a random-effects model as opposed to a fixed-effects model was justified by the considerable variation in effect sizes and the heterogeneity among studies, likely stemming from differences in sample characteristics (Borenstein et al., 2009). This approach accounts for both within-study and between-study variance, whereas the fixed effects model solely addresses variation within individual studies. As such, the random-effects model is a widely used and more realistic approach in meta-analyses, as demonstrated by the research of Neves et al. (2023). The current study also identified publication bias, which denotes to the potential inclination for studies with significant or positive outcomes to be published over those with non-significant or negative results. This bias may influence the findings of the meta-analysis. To assess the presence of heterogeneity, the study evaluated Cochran's Q, I2 and failsafe counts. Cochran's Q is used to determine heterogeneity based on its significance level, while I2 measures the degree of heterogeneity, ranging from 0% to 100%. Additionally, the failsafe number (FNS), introduced by Rosenthal and Rubin in 1991, was used to quantify the minimum number of insignificant or unpublished studies required to overturn the results of each examined relationship. All analyses were conducted using OpenMEE software.

All services, such as mobile devices, mobile payment system, digital wallets and QR codes, were included to present a complete and thorough overview of digital payments. The meta-analysis findings are displayed in Table 3. The primary model's target variables are intention to use digital payments and their actual adoption of digital payment. The first column presents the cumulative sample size (N), the correlation identified in the study adjusted for sample size (r) and the 95% confidence interval (confidence bounds). In terms of statistical significance, the relationship in this study can only be considered statistically insignificant if the p-value of the meta-analysis results surpasses 0.05. If the value exceeds 0.05, the association is deemed statistically insignificant. The Q-statistic and I2-statistic (Higgins & Thompson, 2002) were employed to assess the heterogeneity of the data. The Rosenberg failure rate (Nfs) was employed to ascertain the presence of publication bias. Based on the “5k + 10” criterion (Rosenthal, 1979), practically all paths have a Failsafe N value that exceeds the criterion. This suggests that the effect sizes of all paths do not exhibit publication bias (Rosenthal, 1979). Nevertheless, certain variables fail to satisfy the criteria, including the variable customer service with the behavioral intention to use, effort expectancy – adoption, trust-adoption and social influence – adoption.

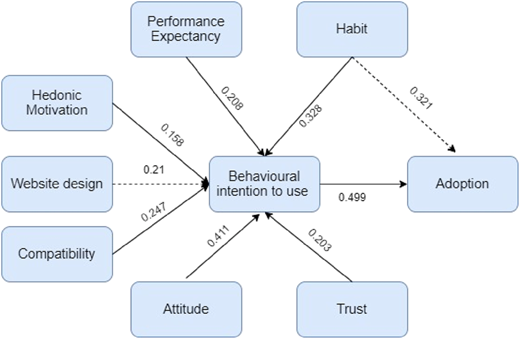
Upon the exclusion of unbiased associations, it was revealed that 19 relationships were present, all demonstrating statistical significance. Concerning the intention to utilize digital payment, the three predominant influences are attitude (r = 0.411), habit (r = 0.328) and reliability (r = 0.278). In terms of digital payment adoption, the key determinants are behavioral intention to utilize (r = 0.499), habit (r = 0.321) and facilitating conditions (r = 0.279).

Upon reviewing the results of the meta-analysis, it is essential to comprehend the findings of the weight analysis. This method allows for evaluating the significance of independent variables, illustrating their capacity to predict the target variable (Jeyaraj, Rottman, & Lacity, 2006). The weights are computed by separating the frequency of significance of an independent variable by the total number of relationships between the independent and dependent variables. Furthermore, to identify the most reliable predictors, this study determined that the researcher must have examined the independent variables at least five times, which should possess a weight of 0.80 or greater.

A variable is designated as a “promising predictor” (PP) if its weight is 0.8 or higher and it is evaluated fewer than five times (Jeyaraj et al., 2006). By amalgamating meta-analysis and weights, a more thorough comprehension of the significance and efficacy of explanatory variables on the target variable can be attained. This approach enables the identification of the most robust indicators. Among all relationships related to usage, six were identified as the most effective predictors, while one demonstrated potential. The primary predictors for the intention to use included attitude, compatibility, habit, hedonic motivation, performance expectancy and trust. Website design was considered a promising indicator. The foremost predictor for adoption was the individual's behavioral intention to use, with habit also recognized as a potential predictor for adoption.

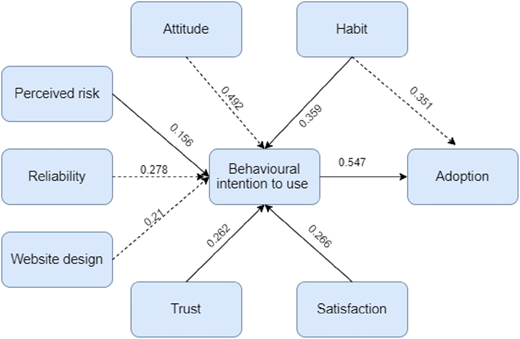
Subsequently, the study evaluated the outcomes for each digital payment service, beginning with the digital banking service. Table 4 presents the results. Regarding data bias in digital banking services, the criterion known as Failsafe does not satisfy the requirement of 5k + n. Specifically, the factors related to the intention to use, such as customer service, hedonic motivation and perceived privacy, do not fulfil this criterion. Conversely, the variables associated with adoption pertain to trust factors. After eliminating the biased relationships, the findings indicate that are 13 relationships associated with behavioral intention to use, all of which are statistically significant. However, there are two relationships to consider when it comes to digital payment adoption. All of them exhibit statistical significance. The three primary influences on the intention to use are attitude (r = 0.492), habit (r = 0.359) and reliability value (r = 0.278). The fundamental factors that significantly influence the digital payment systems usage are behavioral intention to use (r = 0.547) and habit (r = 0.351). In terms of weight analysis, the most prominent predictors of behavioral intention to use digital payments, from a financial services perspective, include habit, perceived risk and trust. The best predictor for adopting digital payment is the behavioral intention to use it. However, attitude, reliability, website design and perceived privacy are promising indicators for predicting behavioral intention to utilize. Habit is a promising indicator of adoption.

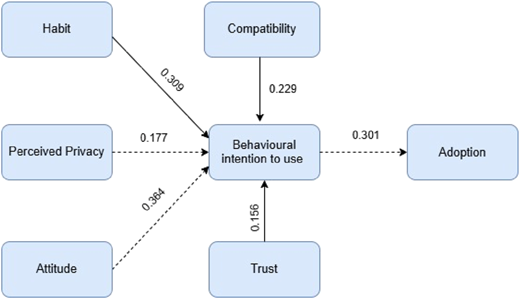
The subsequent research focused exclusively on mobile and digital wallet services, given the increasing global significance and rapid user adoption of digital wallets (Capgemini, 2025; Che Nawi, Mamun, Hayat, & Seduram, 2022). The results are presented in Table 5. Table 5 displays 14 statistically significant associations of using mobile and digital wallet services intention. Regarding adopting mobile and digital wallet services, there are three significant correlations, with one association lacking statistical significance. Concerning data bias for mobile payment services, specific criteria, known as Failsafe criteria, do not meet the requirement of 5k + n. These criteria specifically pertain to variables correlate to the behavioral intention to perceived privacy usage. Although effort expectancy, facilitating conditions and social influence are link to adoption, they exhibit data bias and fail to meet the 5k + n criteria. After eliminating the biased relationships, the findings indicate that there are 13 relationships associated with behavioral intention to use, all of which are statistically significant factors. The three most influential factors affecting the intention to utilize are ATT (r = 0.364), habit (r = 0.309) and social influence (r = 0.231). Concerning weight analysis, the best predictor indicators for the behavioral intention to utilize electronic payment from the perspective of the mobile and digital wallet service are CPMA, habit and TRU. However, ATT and perceived privacy show promising indicators of behavioral intention to use. However, when biased correlations were removed, it was discovered that just one relationship was linked to adoption, and all variables involved in this relationship were statistically significant. The variable with the most significant effect on adoption is behavioral intention to use, with a correlation coefficient of 0.301. When analyzing the weight of different variables, no single predictor variable stands out as the best indicator of adoption for adoption payment usage from the mobile and digital wallet service perspective. However, the behavioral intention to use is a promising indication of adoption.

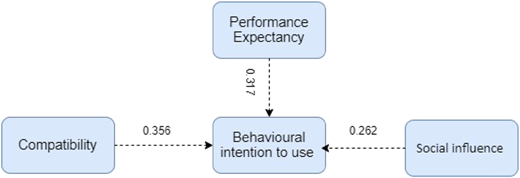
The third investigation was only undertaken for QR code services. The findings are displayed in Table 6. The findings reveal five associations about the intention to utilize QR code digital payment systems, of which four exhibit statistical significance, while one does not. Although the adoption variable was associated, no correlation was discovered because of the absence of articles investigating the Adoption of QR code in this study. This occurrence is possible because QRcode is a relatively recent service, and many individuals have yet to utilize it. Concerning data bias in QR code services, specific criteria, known as Failsafe criteria, do not meet the requirement of 5k + n. These criteria specifically pertain to factors associated with the behavioral intention to use perceived risk. By eliminating the biassed link, the findings demonstrate four relationships link to the behavioral intention to implement, in which all variables exhibit statistical significance. The three most significant factors affecting the motivation to adopt digital payment systems are compatibility (r = 0.356), performance expectancy (r = 0.317) and social influence (r = 0.262). The weight analysis did not identify a single dominant predictor for the behavioral intention to use digital payments specifically for QR code services. However, performance expectancy (PE), social influence (SI) and compatibility (CMPA) emerged as promising indicators of the likelihood to engage with digital payment systems.

Comprehensive studies have been undertaken on digital payment services over an extended duration. Capgemini recognizes the latest cashless payment methods, such as m-wallet, banking, account-to-account and QR codes (Capgemini, 2022). Recent research reveals that multiple connections have been investigated. Consequently, the literature review examined 141 correlations extracted from 41 quantitative studies. The meta-analyses and weights revealed statistically significant and frequently employed constructs for elucidating target variables. The results revealed that the principal factors influencing individuals' behavioral intention to utilize digital payment systems were attitude, compatibility, habit, hedonic incentive, performance anticipation and trust. This analysis reveals that although the first study focused on papers employing the UTAUT integrated technology acceptance and use theory, not all variable components were included as the most effective predictors. Furthermore, components are taken from different theories, such as the attitude toward the TAM. User acceptability is a pivotal element of the TAM, which has previously shown a substantial impact on the adoption of mobile applications. The criterion individuals use to assess the impact of engaging in a particular behavior is attitude, which denotes the positive or negative sentiment users hold over technology usage (Kasilingam, 2020). Users of digital payment systems regard digital payments as a judicious, advantageous and engaging concept. As articulated by the innovation diffusion theory, compatibility constitutes an additional determinant influencing the intention to adopt a specific behavior. Perceived compatibility, as articulated by (Rogers, 2003), denotes to the degree to which an innovation corresponds with the established values, prior experiences and requirements of prospective consumers. Consumers are more inclined to embrace an innovation if they consider it as beneficial. This perception can be established by observing digital payment transactions, including those for cinema tickets, airline tickets and analogous transactions. Consumers are more likely to adopt a novel concept or product when they find it congruent with their prior experiences and beliefs (Ewe, Yap, & Lee, 2015).

The trust in digital payments was extensively examined. The research demonstrated that trust significantly influences the inclination to embrace a technology. Trust is the subjective tendency to believe an event will occur based on favorable assumptions. Trust is cultivated when a system exhibits adequate competence, integrity and goodwill (Merhi, Hone, & Tarhini, 2019) The trustworthiness of service providers is crucial in shaping consumer trust, rendering it a vital metric in studies examining technology adoption (Nguyen, Pham, Dick, & Richardson, 2021). Behavioral intention to use (BIU) significantly predicts adoption, whereas habit demonstrates predictive potential. Venkatesh et al. (2012) assert that UTAUT posits that the intention to embrace new technology influences adoption outcomes. Individuals predisposed to embrace new technologies are more likely to transition into mainstream users (Malarvizhi, Al Mamun, Jayashree, Naznen, & Abir, 2022). Figure 5 illustrates the results of a meta-analysis of the comprehensive digital payment services model. Solid arrows denote the most reliable forecasters, whereas dashed arrows signify potential forecasts.

Upon comparison of the four principal digital payment services, it is clear that digital banking represents the most developed subject. This results from the extensive collection of literature on this subject, emphasizing the intention to embrace and the adoption phase. Figure 6 displays the findings of the meta-analysis for digital banking. Trust, contentment, perceived risk and habit were recognized as the most precise predictors of behavioral intention to utilize digital payment. These findings suggest that attitudes, such as trust, contribute to preserving transaction data secrecy. Moreover, users generally trust the confirmation message after the transaction's completion. The dependability of digital financial services can positively affect the technology usage intention (Al-Saedi, Al-Emran, Ramayah, & Abusham, 2020; Amriena & Ramayanti, 2024) The level of satisfaction with mobile banking usage reflects the intention to engage in mobile banking activities. Moreover, the assertion that employing mobile banking services heightens the vulnerability of bank accounts to fraudulent activity is a significant risk and may compromise privacy. Unauthorized individuals can access user accounts, influencing the propensity to utilize digital payments through mobile banking (Abu-Taieh et al., 2022). Furthermore, establishing routines, defined by the automatic behaviors developed through expertise with technology, encourages customers to engage with mobile banking services for digital payment transactions (Chen & Tsang, 2019). Concurrently, concerning the adoption variable, the most effective predictor and the most promising variable remain consistent with the total service, namely behavioral intention to embrace and habit.

Regarding mobile and digital wallet services, the variables habit, CPMA and TRU are the best predictors, while the variables ATT and perceived privacy offer promising variables, as depicted in Figure 7. Habit remains consistently significant across all digital payment categories, reaffirming the critical importance of habit formation for digital wallet adoption. Nonetheless, the CPMA and TRU factors are the most accurate predictors of behavioral intention to use (BIU) mobile payment services. TRU pertains to the belief that the eWallet service provider ensures security without compromising privacy (Che Nawi et al., 2022). Che Nawi et al. (2022) examined the influence of perceived trust on the desire to use and adopt eWallets among working individuals in Malaysia. The results of his research demonstrate that perceived trust significantly enhances the intention to utilize and adopt eWallets (Che Nawi et al., 2022).

Behavioral intention to utilize mobile and digital wallet services significantly indicates their acceptability. Privacy is a factor that can substantially enhance the desire to accept digital payment systems. Users' adoption of mobile payment technologies depends on their confidence in the security and privacy of their personal information during digital transactions. Compatibility denotes the extent to which an invention corresponds with prospective users' personal values and experiences. Assume an innovation delivers a product or service. Prospective consumers are more inclined to adopt it if it is readily comprehensible or enables a seamless transition from their current usage habits. Users must understand the operational protocols and application elements to utilize the mobile payment system. The payment method employed by users will remain unchanged. Users may benefit economically and socially if the invention is unequivocally advantageous (Lin, Lin, & Ding, 2020). Consequently, the compatibility variable significantly influences individuals' propensity to use digital payment methods, especially with mobile and digital wallet services.

Conversely, the most underdeveloped subject is the QR code, as illustrated in Figure 8. The meta-analysis results demonstrate that no singular attribute can be recognized as the most effective predictor of QR code payment services. The limited quantity of articles regarding acquired QR code services has been meticulously examined and sanctioned in Scopus-indexed journals during Q1 and Q2. Upon analyzing the results, three characteristics emerged as noteworthy: compatibility, performance expectancy and social influence. The results demonstrate that individuals are increasingly predisposed to utilize QR code payments daily. QR code payment services are advantageous since they accelerate payment settlement and improve processing efficiency (Lin et al., 2020). Concentrating on pivotal persons who can affect behavior and whose perspectives are invaluable regarding using QR code payments is essential. Targeting advertisements for these individuals will enhance the behavioral intention to utilize QR code payments (Malarvizhi et al., 2022). The findings suggest that the digital payments usage intention through QR code services may be accelerated if perceived compatibility is deemed essential. If clients believe that QR code payment services correspond with their lifestyle and shopping behaviors, they are more inclined to embrace this option. As a result, the inclination to adopt QR code payments will increase (Agárdi & Alt, 2022).

This study examined the utilization of digital payment methods, specifically mobile banking, mobile payment, electronic wallet and QR code payment services. The research employed weighting and meta-analysis methods on 41 publications, resulting in the detection of 141 relationships. The study comprehensively analyses the most effective and promising determinants that forecast individuals' intention to utilize digital payment systems. This encompasses evaluating several facets of the services, including digital banking, mobile and digital wallets and QR codes. Attitude, compatibility, habit, hedonic motivation, performance expectancy and trust are the most precise indications of the intention to utilize digital payments. When considering specific services namely digital banking, habit, perceived risk and trust, satisfaction factors are the best predictors for determining the intention to use digital payments. Habit, CPMA and TRU are the most effective predictors and indicators for evaluating the inclination to utilize digital payments through mobile and digital wallet services. The findings further emphasize the rapid global adoption and significance of mobile and digital wallets as critical payment solutions. Furthermore, no single variable can reliably predict the outcome regarding QR code services. Three characteristics emerge as significant indicators of the propensity to utilize digital payments: compatibility, performance expectancy and social influence. This study illustrates the present condition of digital payments. It offers evidence for future research, facilitating the development of new hypotheses that may influence the intention and implementation of digital payments. This paper emphatically supports the practitioner perspective, offering precise recommendations on strategies for using digital payment systems, encompassing banks, e-wallet companies, app developers and governmental organizations.

This study rigorously analyses digital payment, covering all critical service domains and offering an in-depth comprehension of its theoretical ramifications. Meta-analysis facilitates consolidating the effects of each explanatory variable on the dependent variable and evaluates its significance, whereas weight analysis allocates weights. Therefore, it is possible to obtain the most effective prediction model for utilizing digital payment services.

This study's findings, grounded in the UTAUT theory, reveal that not all UTAUT factors – specifically performance expectancy, social influence, effort expectancy and facilitating conditions serve as optimal predictor variables. Nevertheless, it was found that specific supplementary components are not regarded as variables in UTAUT theory. Compatibility can be inferred from DOI theory, attitude from TAM theory and additional factors such as trust, which have been thoroughly examined concerning digital payments. According to previous study by Che Nawi et al. (2022) and Kaur, Dhir, Bodhi, Singh, and Almotairi (2020), the aforementioned characteristics have been recognized as reliable predictors. Consequently, the resultant model provides a thorough and fundamental framework to support more research. The results specifically emphasize the rapidly growing importance of digital wallets as an essential digital payment method. This study improves our understanding of advancements in digital payments, highlighting the importance of upcoming services such as QR code payment systems (Malarvizhi et al., 2022; Ramayanti, Azhar, & Nik Azman, 2025). Nonetheless, additional investigation is necessary, as the quantity of utilized predictors is restricted relative to more established services. This suggests the possibility for additional investigation of QR code payments (Liébana-Cabanillas, Singh, Kalinic, & Carvajal-Trujillo, 2021), with the synthesized models provided as a basis. A recent study investigated the compatibility, performance expectancy and social influence affect individuals' propensity to adopt QR code payments. Moreover, the weight analysis reveals that variables like hedonic motivation and perceived danger have been repeatedly employed; nonetheless, their low weights signify their insignificance. Future researchers might leverage these findings to identify the factors to analyze while investigating digital payments using QR code payment systems. Promising indications may be further examined, whilst inconsequential and low-weighted factors might be disregarded. The same concept has been employed in other digital payment systems. The IS socio-technical approach can be utilized to analyze diverse hypotheses, including those concerning the determinants of adoption or the purpose to persist in usage. This viewpoint similarly applies to outcome research, as Ly, Khuong and Son (2022) illustrated. Furthermore, it can provide insights into using many intelligent systems, namely the internet of things (Khan, Aalsalem, & Khan, 2019) and virtual reality (Bhugaonkar, Bhugaonkar, & Masne, 2022). Moreover, it can be employed to augment financial security via the application of blockchain technology (Rana, Adamashvili, & Tricase, 2022).

The research findings provide essential information for professionals seeking to improve the digital payment services utilization. The results suggest that stakeholders can improve the acceptance and digital payment systems usage by emphasizing aspects such as attitude, compatibility, hedonic motivation and performance expectancy in their marketing and product development efforts. Moreover, banking services can leverage these findings to bolster user confidence, increase consumer satisfaction and diminish perceived risk to facilitate the digital payment utilization through digital banking services. Mobile and digital wallet service providers can utilize this information to develop marketing strategies reinforcing user behaviors and CPMA and capitalizing on TRU to improve intents. Digital wallet service providers can leverage these insights to improve user experience and communicate the expected benefits of digital wallets to increase the desire to use these services. Concerning QR code payment services, companies might advise experts to emphasize specific criteria such as compatibility (CMPA), social impact (SI) and perceived risk (PR) while establishing their marketing and strategies for product enhancement. The government can utilize the understanding of the variables that impact the inclination and acceptance of digital payment services to create policies that bolster the expansion of the digital economy. This encompasses strategies that promote technological advancement, diminish bureaucratic obstacles and enhance the digital proficiency of the general population. These findings can be utilized by app developers to create digital payment apps that are more tailored to users' wants and tastes, taking into account the characteristics that are the most accurate indicators in each digital payment service.

This study has several limitations that open opportunities for further research. First, the analysis of QR code-based digital payments was limited to only five variables, reflecting the uniqueness of this topic. Future research is recommended to expand research in this area to build a more robust understanding of QR code adoption. Second, most of the included studies focused on a single country, limiting cross-cultural generalizations. Future research is recommended to use cross-country comparisons to explore how cultural differences and regulations influence the adoption of digital payments. Lastly, although this study employed the UTAUT framework to identify factors influencing the adoption of digital payment systems, the analysis was limited to variables within that theoretical model. As a result, some relevant psychological and behavioral constructs may not have been captured. This article suggests that future research can use its findings to guide variable selection in analyzing the use of digital payment systems – such as digital banking, mobile and digital wallets and QR code services – while also exploring alternative theoretical perspectives, including Privacy Calculus Theory or Protection Motivation Theory, to enrich the understanding of user adoption behavior.

The authors would like to thank the Indonesian Ministry of Education, Culture, Research and Technology as well as DRTPM and Diktiristek for providing funding for this research.
Abu-Taieh
,
E. M.
,
AlHadid
,
I.
,
Abu-Tayeh
,
S.
,
Masa’deh
,
R.
,
Alkhawaldeh
,
R. S.
,
Khwaldeh
,
S.
, &
Alrowwad
,
A.
(
2022
).
Continued intention to use of M-banking in Jordan by integrating UTAUT, TPB, TAM and service quality with ML
.
Journal of Open Innovation: Technology, Market, and Complexity
,
8
(
3
), 120. doi: .
Agárdi
,
I.
, &
Alt
,
M. A.
(
2022
).
Do digital natives use mobile payment differently than digital immigrants? A comparative study between generation X and Z
.
Electronic Commerce Research
,
24
(
3
),
1463
1490
. doi: .
Al-Saedi
,
K.
,
Al-Emran
,
M.
,
Ramayah
,
T.
, &
Abusham
,
E.
(
2020
).
Developing a general extended UTAUT model for M-payment adoption
.
Technology in Society
,
62
, 101293. doi: .
Amriena
,
G.
, &
Ramayanti
,
R.
(
2024
).
Consumer adoption of BRImo mobile banking application: An extended TAM perspective
.
Islamic Finance, Contributions to Management Science
,
753
766
. doi: .
Bhugaonkar
,
K.
,
Bhugaonkar
,
R.
, &
Masne
,
N.
(
2022
).
The trend of metaverse and augmented & virtual reality extending to the healthcare system
.
Cureus
,
14
(
9
), e29071. doi: .
Blut
,
M.
,
Chong
,
A. Y. L.
,
Tsigna
,
Z.
, &
Venkatesh
,
V.
(
2022
).
Meta-analysis of the unified theory of acceptance and use of technology (UTAUT): Challenging its validity and charting a research agenda in the red ocean
.
Journal of the Association for Information Systems
,
23
(
1
),
13
95
. doi: .
Borenstein
,
M.
,
Hedges
,
L.
,
Higgins
,
J.
, &
Rothstein
,
H.
(
2009
).
Introduction to Meta-Analysis
.
John Wiley & Sons, Ltd
.
Capgemini
(
2022
).
World report series : Payment
.
Capgemini
(
2025
).
World payments report 2025
.
Chawla
,
D.
, &
Joshi
,
H.
(
2019
).
Consumer attitude and intention to adopt mobile wallet in India – an empirical study
.
International Journal of Bank Marketing
,
37
(
7
),
1590
1618
. doi: .
Che Nawi
,
N.
,
Mamun
,
A. Al
,
Hayat
,
N.
, &
Seduram
,
L.
(
2022
).
Promoting sustainable financial services through the adoption of eWallet among Malaysian working adults
.
Sage Open
,
12
(
1
). doi: .
Chen
,
C. C.
, &
Tsang
,
S. S.
(
2019
).
Predicting adoption of mobile payments from the perspective of taxi drivers
.
IET Intelligent Transport Systems
,
13
(
7
),
1116
1124
. doi: .
Datareportal
(
2023
).
Digital 2023: Overview global report
.
de Luna
,
I. R.
,
Liebana-Cabanillas
,
F.
,
Sanchez-Fernandez
,
J.
, &
Munoz-Leiva
,
F.
(
2019
).
Mobile payment is not all the same: The adoption of mobile payment systems depending on the technology applied
.
Technological Forecasting and Social Change
,
146
,
931
944
. doi: .
Elad
,
B.
(
2025
).
QR code payments statistics 2025: Adoption rates and future projections
.
Coinlaw
.
Ewe
,
S. Y.
,
Yap
,
S. F.
, &
Lee
,
C. K. C.
(
2015
).
Network externalities and the perception of innovation characteristics: Mobile banking
.
Marketing Intelligence & Planning
,
33
(
4
),
592
611
. doi: .
Giovanis
,
A.
,
Athanasopoulou
,
P.
,
Assimakopoulos
,
C.
, &
Sarmaniotis
,
C.
(
2019
).
Adoption of mobile banking services: A comparative analysis of four competing theoretical models
.
International Journal of Bank Marketing
,
37
(
5
),
1165
1189
. doi: .
Higgins
,
J. P. T.
, &
Thompson
,
S. G.
(
2002
).
Quantifying heterogeneity in a meta-analysis
.
Statistics in Medicine
,
21
(
11
),
1539
1558
. doi: .
Hunter
,
J. E.
and
Schmidt
,
F. L.
(
2004
),
Methods of meta-analysis: Correcting error and bias in research finding
.
Isaac
,
O.
,
Abdullah
,
Z.
,
Aldholay
,
A. H.
, &
Abdulbaqi Ameen
,
A.
(
2019
).
Antecedents and outcomes of internet usage within organisations in Yemen: An extension of the Unified Theory of Acceptance and Use of Technology (UTAUT) model
.
Asia Pacific Management Review
,
24
(
4
),
335
354
. doi: .
Jadil
,
Y.
,
Rana
,
N. P.
, &
Dwivedi
,
Y. K.
(
2021
).
A meta-analysis of the UTAUT model in the mobile banking literature: The moderating role of sample size and culture
.
Journal of Business Research
,
132
,
354
372
. doi: .
Jeyaraj
,
A.
,
Rottman
,
J. W.
, &
Lacity
,
M. C.
(
2006
).
A review of the predictors, linkages, and biases in IT innovation adoption research
.
Journal of Information Technology
,
21
(
1
),
1
23
. doi: .
Kasilingam
,
D. L.
(
2020
).
Understanding the attitude and intention to use smartphone chatbots for shopping
.
Technology in Society
,
62
, 101280. doi: ,
May
.
Kaur
,
P.
,
Dhir
,
A.
,
Bodhi
,
R.
,
Singh
,
T.
, &
Almotairi
,
M.
(
2020
).
Why do people use and recommend m-wallets?
.
Journal of Retailing and Consumer Services
,
56
, 102091. doi: .
Khan
,
W. Z.
,
Aalsalem
,
M. Y.
, &
Khan
,
M. K.
(
2019
).
Communal acts of IoT consumers: A potential threat to security and privacy
.
IEEE Transactions on Consumer Electronics
,
65
(
1
),
64
72
. doi: .
Kwateng
,
K. O.
,
Atiemo
,
K. A. O.
, &
Appiah
,
C.
(
2019
).
Acceptance and use of mobile banking: An application of UTAUT2
.
Journal of Enterprise Information Management
,
32
(
1
),
118
151
. doi: .
Liébana-Cabanillas
,
F.
,
Singh
,
N.
,
Kalinic
,
Z.
, &
Carvajal-Trujillo
,
E.
(
2021
).
Examining the determinants of continuance intention to use and the moderating effect of the gender and age of users of NFC mobile payments: A multi-analytical approach
.
Information Technology and Management
,
22
(
2
),
133
161
. doi: .
Lin
,
W. R.
,
Lin
,
C. Y.
, &
Ding
,
Y. H.
(
2020
).
Factors affecting the behavioral intention to adopt mobile payment: An empirical study in Taiwan
.
Mathematics
,
8
(
10
),
1
19
. doi: .
Ly
,
H. T. N.
,
Khuong
,
N. V.
, &
Son
,
T. H.
(
2022
).
Determinants affect mobile wallet continuous usage in Covid 19 pandemic: Evidence from Vietnam
.
Cogent Business and Management
,
9
(
1
), 2041792. doi: .
Malarvizhi
,
C. A.
,
Al Mamun
,
A.
,
Jayashree
,
S.
,
Naznen
,
F.
, &
Abir
,
T.
(
2022
).
Predicting the intention and adoption of near field communication mobile payment
.
Frontiers in Psychology
,
13
, 870793. doi: .
Malyshev
,
A.
(
2025
).
Digital banking: 2025 market overview, trends & insights
.
SDK.Finance
.
MeaWallet
(
2025
).
Over half the world’s population will use mobile wallets by 2025, says Boku study
.
MeaWallet
.
Merhi
,
M.
,
Hone
,
K.
, &
Tarhini
,
A.
(
2019
).
A cross-cultural study of the intention to use mobile banking between Lebanese and British consumers: Extending UTAUT2 with security, privacy and trust
.
Technology in Society
,
59
, 101151. doi: .
Neves
,
C.
,
Oliveira
,
T.
,
Santinib
,
F.
, &
Gutman
,
L.
(
2023
).
Adoption and use of digital financial services: A meta-analysis of barriers and facilitators
.
International Journal of Information Management Data Insights
,
3
(
2
), 100201. doi: .
Nguyen
,
T.
,
Pham
,
H. C.
,
Dick
,
M.
, &
Richardson
,
J.
(
2021
).
Trust types and mediating effect of consumer trust in m-payment adoption: An empirical examination of Vietnamese consumers
.
Australasian Journal of Information Systems
,
25
. doi: .
Page
,
M. J.
,
McKenzie
,
J. E.
,
Bossuyt
,
P. M.
,
Boutron
,
I.
,
Hoffmann
,
T. C.
,
Mulrow
,
C. D.
, …
Moher
,
D.
(
2021
).
The PRISMA 2020 statement: An updated guideline for reporting systematic reviews
.
The BMJ
,
372
,
n71
. doi: .
Ramayanti
,
R.
,
Rachmawati
,
N. A.
,
Azhar
,
Z.
, &
Nik Azman
,
N. H.
(
2024a
).
Exploring intention and actual use in digital payments: A systematic review and roadmap for future research
.
Computers in Human Behavior Reports
,
13
, 100348. doi: .
Ramayanti
,
R.
,
Rachmawati
,
N. A.
,
Setiawan
,
R.
, &
Azhar
,
Z.
(
2024b
).
Driving sustainable financial management: An investigation of factors influencing the use of digitals technologies by MSMEs
.
Journal of Governance and Regulation
,
13
(
2
),
76
85
. doi: .
Ramayanti
,
R.
,
Azhar
,
Z.
, &
Nik Azman
,
N. H.
(
2025
).
Factors influencing intentions to use QRIS: A two-staged PLS-SEM and ANN approach
.
Telematics and Informatics Reports
,
17
, 100185. doi: .
Rana
,
R. L.
,
Adamashvili
,
N.
, &
Tricase
,
C.
(
2022
).
The impact of blockchain technology adoption on tourism industry: A systematic literature review
.
Sustainability
,
14
(
12
),
7383
. doi: .
Ricson
(
2025
).
61+ QR code statistics & trends 2025 full report
.
Rogers
,
E. M.
(
2003
).
Diffusion of innovations
.
Free Press
( (5th ed.) ).
New York, NY
:
A Division of Simon & Schuster
, 10020.
Rosenthal
,
R.
(
1979
).
The file drawer problem and tolerance for null results
.
Psychological Bulletin
,
86
(
3
),
638
641
. doi: .
Singh
,
N.
,
Sinha
,
N.
, &
Liébana-Cabanillas
,
F. J.
(
2020
).
Determining factors in the adoption and recommendation of mobile wallet services in India: Analysis of the effect of innovativeness, stress to use and social influence
.
International Journal of Information Management
,
50
,
191
205
. doi: .
Venkatesh
,
V.
,
Thong
,
J. Y. L.
, &
Xu
,
X.
(
2012
).
Consumer acceptance and use of information technology: Extending the unified theory of acceptance and use of technology
.
MIS Quarterly
,
36
(
1
),
157
178
. doi: .
Published in Digital Transformation and Society. Published by Emerald Publishing Limited. This article is published under the Creative Commons Attribution (CC BY 4.0) licence. Anyone may reproduce, distribute, translate and create derivative works of this article (for both commercial and non-commercial purposes), subject to full attribution to the original publication and authors. The full terms of this licence may be seen at Link to the terms of the CC BY 4.0 licence

Data & Figures

Figure 1
A PRISMA flow diagram shows the screening and selection process for included studies.The PRISMA flow diagram shows four section headings arranged vertically on the left side: “Identification,” “Screening,” “Eligibility,” and “Included”. The flowchart is divided into two columns. The left column contains five text boxes, which are labeled as follows: Text box 1: “Records identified from asterisk: Scopus (n equals 1,658), W O S (n equals 3,435), Total (n equals 5,093)”. Text box 2: “Records screened (n equals 4,368)”. Text box 3: “Records screened (n equals 1,049)”. Text box 4: “Full text articles assessed for eligibility (n equals 537)”. Text box 5: “Reports of included studies (n equals 41)”. The right column contains four text boxes, which are labeled as follows: Text box 6: “Records removed before screening: Duplicate records removed (n equals 725)”. Text box 7: “Records excluded based on eligibility criteria after title and abstract screening (n equals 3,319)”. Text box 8: “Records excluded based on eligibility criteria Q 1 and Q 2 and no full text P D F (n equals 512)”. Text box 9: “Reports excluded: not quantitative research or mixed methods, incomplete statistical data, not using U T A U T theory (n equals 496)”. Text boxes 1 and 6 are placed under the heading “Identification”. Text boxes 2, 3, 7, and 8 are placed under the heading “Screening”. Text boxes 4 and 9 are placed under the heading “Eligibility”. Text box 5 is placed under the heading “Included”. Text box 1 is connected to text box 2 with a downward arrow. Text box 2 is connected to text box 3 with a downward arrow. Text box 3 is connected to text box 4 with a downward arrow. Text box 4 is connected to text box 5 with a downward arrow. Text box 1 is connected to text box 6 with a rightward arrow. Text box 2 is connected to text box 7 with a rightward arrow. Text box 3 is connected to text box 8 with a rightward arrow. Text box 4 is connected to text box 9 with a rightward arrow.

PRISMA flowchart. Source(s): Authors’ own work

Figure 1
A PRISMA flow diagram shows the screening and selection process for included studies.The PRISMA flow diagram shows four section headings arranged vertically on the left side: “Identification,” “Screening,” “Eligibility,” and “Included”. The flowchart is divided into two columns. The left column contains five text boxes, which are labeled as follows: Text box 1: “Records identified from asterisk: Scopus (n equals 1,658), W O S (n equals 3,435), Total (n equals 5,093)”. Text box 2: “Records screened (n equals 4,368)”. Text box 3: “Records screened (n equals 1,049)”. Text box 4: “Full text articles assessed for eligibility (n equals 537)”. Text box 5: “Reports of included studies (n equals 41)”. The right column contains four text boxes, which are labeled as follows: Text box 6: “Records removed before screening: Duplicate records removed (n equals 725)”. Text box 7: “Records excluded based on eligibility criteria after title and abstract screening (n equals 3,319)”. Text box 8: “Records excluded based on eligibility criteria Q 1 and Q 2 and no full text P D F (n equals 512)”. Text box 9: “Reports excluded: not quantitative research or mixed methods, incomplete statistical data, not using U T A U T theory (n equals 496)”. Text boxes 1 and 6 are placed under the heading “Identification”. Text boxes 2, 3, 7, and 8 are placed under the heading “Screening”. Text boxes 4 and 9 are placed under the heading “Eligibility”. Text box 5 is placed under the heading “Included”. Text box 1 is connected to text box 2 with a downward arrow. Text box 2 is connected to text box 3 with a downward arrow. Text box 3 is connected to text box 4 with a downward arrow. Text box 4 is connected to text box 5 with a downward arrow. Text box 1 is connected to text box 6 with a rightward arrow. Text box 2 is connected to text box 7 with a rightward arrow. Text box 3 is connected to text box 8 with a rightward arrow. Text box 4 is connected to text box 9 with a rightward arrow.

PRISMA flowchart. Source(s): Authors’ own work

Close modal
Figure 2
A horizontal bar chart shows the number of published articles in leading journals on digital payments.The horizontal bar chart shows a horizontal axis labeled “Number of Articles” and ranges from 0 to 1000 in increments of 100 units. The vertical axis lists the journal names from top to bottom as “Information Technology and Management,” “Journal of Asia Business Studies,” “T Q M Journal,” “Foresight,” “Journal of Open Innovation: Technology Market and Complexity,” “Journal of Research in Interactive Marketing,” “Journal of Enterprise Information Management,” “International Journal of Information and Learning Technology,” “Technology in Society,” and “International Journal of Bank Marketing”. Each journal has a single horizontal bar extending rightward, with the count of articles published. The data for the bars on the graph are as follows: Information Technology and Management: 105. Journal of Asia Business Studies: 118. T Q M Journal: 119. Foresight: 144. Journal of Open Innovation: Technology Market and Complexity: 145. Journal of Research in Interactive Marketing: 316. Journal of Enterprise Information Management: 508. International Journal of Information and Learning Technology: 634. Technology in Society: 821. International Journal of Bank Marketing: 927.

Top journals for digital payment research. Source(s): Authors’ own work

Figure 2
A horizontal bar chart shows the number of published articles in leading journals on digital payments.The horizontal bar chart shows a horizontal axis labeled “Number of Articles” and ranges from 0 to 1000 in increments of 100 units. The vertical axis lists the journal names from top to bottom as “Information Technology and Management,” “Journal of Asia Business Studies,” “T Q M Journal,” “Foresight,” “Journal of Open Innovation: Technology Market and Complexity,” “Journal of Research in Interactive Marketing,” “Journal of Enterprise Information Management,” “International Journal of Information and Learning Technology,” “Technology in Society,” and “International Journal of Bank Marketing”. Each journal has a single horizontal bar extending rightward, with the count of articles published. The data for the bars on the graph are as follows: Information Technology and Management: 105. Journal of Asia Business Studies: 118. T Q M Journal: 119. Foresight: 144. Journal of Open Innovation: Technology Market and Complexity: 145. Journal of Research in Interactive Marketing: 316. Journal of Enterprise Information Management: 508. International Journal of Information and Learning Technology: 634. Technology in Society: 821. International Journal of Bank Marketing: 927.

Top journals for digital payment research. Source(s): Authors’ own work

Close modal
Figure 3
A horizontal bar chart shows the number of articles published by leading authors on digital payments.The horizontal bar chart shows a horizontal axis labeled “Number of Articles” and ranges from 0 to 600 in increments of 100 units. The vertical axis lists the authors’ names from top to bottom as “Chawla and Joshi, 2020 b,” “Giovanis e t a l., 2019,” “Yaseen and E l Qirem, 2018,” “A l-Okaily e t a l., 2020,” “Rahi, A b d. Ghani, e t a l., 2019,” “Rahi, Othman Mansour, e t a l., 2019,” “A l-Saedi e t a l., 2020,” “Owusu Kwateng e t a l., 2019,” “Chawla and Joshi, 2019,” and “Singh e t a l., 2020”. Each author has a single horizontal bar extending rightward, with the number of articles published. The data for the bars on the graph are as follows: Chawla and Joshi, 2020 b: 144. Giovanis e t a l., 2019: 146. Yaseen and E l Qirem, 2018: 147. A l-Okaily e t a l., 2020: 148. Rahi, A b d. Ghani, e t a l., 2019: 164. Rahi, Othman Mansour, e t a l., 2019: 316. A l-Saedi e t a l., 2020: 390. Owusu Kwateng e t a l., 2019: 402. Chawla and Joshi, 2019: 518. Singh e t a l., 2020: 524.

Top authors for digital payment research. Source(s): Authors’ own work

Figure 3
A horizontal bar chart shows the number of articles published by leading authors on digital payments.The horizontal bar chart shows a horizontal axis labeled “Number of Articles” and ranges from 0 to 600 in increments of 100 units. The vertical axis lists the authors’ names from top to bottom as “Chawla and Joshi, 2020 b,” “Giovanis e t a l., 2019,” “Yaseen and E l Qirem, 2018,” “A l-Okaily e t a l., 2020,” “Rahi, A b d. Ghani, e t a l., 2019,” “Rahi, Othman Mansour, e t a l., 2019,” “A l-Saedi e t a l., 2020,” “Owusu Kwateng e t a l., 2019,” “Chawla and Joshi, 2019,” and “Singh e t a l., 2020”. Each author has a single horizontal bar extending rightward, with the number of articles published. The data for the bars on the graph are as follows: Chawla and Joshi, 2020 b: 144. Giovanis e t a l., 2019: 146. Yaseen and E l Qirem, 2018: 147. A l-Okaily e t a l., 2020: 148. Rahi, A b d. Ghani, e t a l., 2019: 164. Rahi, Othman Mansour, e t a l., 2019: 316. A l-Saedi e t a l., 2020: 390. Owusu Kwateng e t a l., 2019: 402. Chawla and Joshi, 2019: 518. Singh e t a l., 2020: 524.

Top authors for digital payment research. Source(s): Authors’ own work

Close modal
Figure 4
A pie chart showing the percentage distribution of digital payment methods.The pie chart shows the percentage distribution of mobile payment methods. The data from the chart in the clockwise direction are as follows: Mobile payment, 14.34 percent. Mobile banking, 17.41 percent. Q R code or N F C, 4.10 percent. Mobile Wallet, 6.15 percent.

Digital payment service. Source(s): Authors’ own work

Figure 4
A pie chart showing the percentage distribution of digital payment methods.The pie chart shows the percentage distribution of mobile payment methods. The data from the chart in the clockwise direction are as follows: Mobile payment, 14.34 percent. Mobile banking, 17.41 percent. Q R code or N F C, 4.10 percent. Mobile Wallet, 6.15 percent.

Digital payment service. Source(s): Authors’ own work

Close modal
Figure 5
A path diagram showing factors affecting behavioral intention to use and adoption.The path diagram shows nine text boxes. The text box labeled “Behavioural Intention to Use” is positioned at the center. To the left of it, three vertically arranged text boxes are placed, labeled from top to bottom as “Hedonic Motivation,” “Website Design,” and “Compatibility”. Two horizontally arranged text boxes are placed above “Behavioural Intention to Use,” labeled “Performance Expectancy” and “Habit”. Two horizontally arranged text boxes are placed below “Behavioural Intention to Use,” labeled from left to right as “Attitude” and “Trust”. A text box labeled “Adoption” is placed to the right of “Behavioural Intention to Use”. A diagonal bottom-rightward arrow labeled 0.158 emerges from “Hedonic Motivation” and points to “Behavioural Intention to Use”. A dashed rightward arrow labeled 0.21 emerges from “Website Design” and connects to “Behavioural Intention to Use”. A diagonal upper rightward arrow labeled 0.247 emerges from “Compatibility” and connects to “Behavioural Intention to Use”. A diagonal upper rightward arrow labeled 0.411 emerges from “Attitude” and connects to “Behavioural Intention to Use”. A diagonal upper leftward arrow labeled 0.203 emerges from “Trust” and connects to “Behavioural Intention to Use”. A downward right arrow labeled 0.208 emerges from “Performance Expectancy” and connects to “Behavioural Intention to Use”. A downward left arrow labeled 0.328 emerges from “Habit” and connects to “Behavioural Intention to Use”. A rightward arrow labeled 0.499 emerges from “Behavioural Intention to Use” and connects to “Adoption”. A dashed diagonal downward left arrow labeled 0.321 emerges from “Habit” and connects to “Adoption”.

The model generated from a meta-analysis of all digital payment services. Source(s): Authors’ own work

Figure 5
A path diagram showing factors affecting behavioral intention to use and adoption.The path diagram shows nine text boxes. The text box labeled “Behavioural Intention to Use” is positioned at the center. To the left of it, three vertically arranged text boxes are placed, labeled from top to bottom as “Hedonic Motivation,” “Website Design,” and “Compatibility”. Two horizontally arranged text boxes are placed above “Behavioural Intention to Use,” labeled “Performance Expectancy” and “Habit”. Two horizontally arranged text boxes are placed below “Behavioural Intention to Use,” labeled from left to right as “Attitude” and “Trust”. A text box labeled “Adoption” is placed to the right of “Behavioural Intention to Use”. A diagonal bottom-rightward arrow labeled 0.158 emerges from “Hedonic Motivation” and points to “Behavioural Intention to Use”. A dashed rightward arrow labeled 0.21 emerges from “Website Design” and connects to “Behavioural Intention to Use”. A diagonal upper rightward arrow labeled 0.247 emerges from “Compatibility” and connects to “Behavioural Intention to Use”. A diagonal upper rightward arrow labeled 0.411 emerges from “Attitude” and connects to “Behavioural Intention to Use”. A diagonal upper leftward arrow labeled 0.203 emerges from “Trust” and connects to “Behavioural Intention to Use”. A downward right arrow labeled 0.208 emerges from “Performance Expectancy” and connects to “Behavioural Intention to Use”. A downward left arrow labeled 0.328 emerges from “Habit” and connects to “Behavioural Intention to Use”. A rightward arrow labeled 0.499 emerges from “Behavioural Intention to Use” and connects to “Adoption”. A dashed diagonal downward left arrow labeled 0.321 emerges from “Habit” and connects to “Adoption”.

The model generated from a meta-analysis of all digital payment services. Source(s): Authors’ own work

Close modal
Figure 6
A path diagram shows behavioral intention to use and factors related to digital banking services.The path diagram shows nine text boxes. The text box labeled “Behavioural Intention to Use” is positioned at the center. To the left of it, three vertically arranged text boxes are placed, labeled from top to bottom as “Perceived Risk,” “Reliability,” and “Website Design”. Two horizontally arranged text boxes are placed above and below “Behavioural Intention to Use”. The top two boxes are labeled “Attitude” and “Habit,” while the bottom two boxes are labeled from left to right as “Trust” and “Satisfaction”. A text box labeled “Adoption” is placed to the right of “Behavioural Intention to Use”. A diagonal bottom-rightward arrow labeled 0.156 emerges from “Perceived Risk” and connects to “Behavioural Intention to Use”. A dashed rightward arrow labeled 0.278 emerges from “Reliability” and connects to “Behavioural Intention to Use”. A dashed diagonal upward right arrow labeled 0.21 emerges from “Website Design” and connects to “Behavioural Intention to Use”. A dashed diagonal downward right arrow labeled 0.492 emerges from “Attitude” and connects to “Behavioural Intention to Use”. A diagonal downward left arrow labeled 0.359 emerges from “Habit” and connects to “Behavioural Intention to Use”. A diagonal upward right arrow labeled 0.262 emerges from “Trust” and connects to “Behavioural Intention to Use”. A diagonal upward left arrow labeled 0.266 emerges from “Satisfaction” and connects to “Behavioural Intention to Use”. A rightward arrow labeled 0.547 emerges from “Behavioural Intention to Use” and connects to “Adoption”. A dashed diagonal downward right arrow labeled 0.351 emerges from “Habit” and connects to “Adoption”.

The model generated from a meta-analysis of digital banking services. Source(s): Authors’ own work

Figure 6
A path diagram shows behavioral intention to use and factors related to digital banking services.The path diagram shows nine text boxes. The text box labeled “Behavioural Intention to Use” is positioned at the center. To the left of it, three vertically arranged text boxes are placed, labeled from top to bottom as “Perceived Risk,” “Reliability,” and “Website Design”. Two horizontally arranged text boxes are placed above and below “Behavioural Intention to Use”. The top two boxes are labeled “Attitude” and “Habit,” while the bottom two boxes are labeled from left to right as “Trust” and “Satisfaction”. A text box labeled “Adoption” is placed to the right of “Behavioural Intention to Use”. A diagonal bottom-rightward arrow labeled 0.156 emerges from “Perceived Risk” and connects to “Behavioural Intention to Use”. A dashed rightward arrow labeled 0.278 emerges from “Reliability” and connects to “Behavioural Intention to Use”. A dashed diagonal upward right arrow labeled 0.21 emerges from “Website Design” and connects to “Behavioural Intention to Use”. A dashed diagonal downward right arrow labeled 0.492 emerges from “Attitude” and connects to “Behavioural Intention to Use”. A diagonal downward left arrow labeled 0.359 emerges from “Habit” and connects to “Behavioural Intention to Use”. A diagonal upward right arrow labeled 0.262 emerges from “Trust” and connects to “Behavioural Intention to Use”. A diagonal upward left arrow labeled 0.266 emerges from “Satisfaction” and connects to “Behavioural Intention to Use”. A rightward arrow labeled 0.547 emerges from “Behavioural Intention to Use” and connects to “Adoption”. A dashed diagonal downward right arrow labeled 0.351 emerges from “Habit” and connects to “Adoption”.

The model generated from a meta-analysis of digital banking services. Source(s): Authors’ own work

Close modal
Figure 7
A path diagram illustrates the relationships among factors influencing mobile and digital wallet service adoption.The path diagram shows seven text boxes. The text box labeled “Behavioural Intention to Use” is positioned at the center. Three vertically arranged text boxes are placed to its left, labeled from top to bottom as “Habit,” “Perceived Privacy,” and “Attitude”. A text box labeled “Compatibility” is positioned above “Behavioural Intention to Use,” and another labeled “Trust” is placed below it. A text box labeled “Adoption” is positioned to the right of “Behavioural Intention to Use”. A diagonal bottom rightward arrow labeled 0.309 emerges from “Habit” and connects to “Behavioural Intention to Use”. A diagonal bottom rightward arrow labeled 0.309 emerges from “Habit” and connects to “Behavioural Intention to Use”. A downward arrow labeled 0.229 emerges from “Compatibility” and connects to “Behavioural Intention to Use”. A dashed rightward arrow labeled 0.177 emerges from “Perceived Privacy” and connects to “Behavioural Intention to Use”. A dashed diagonal upward right arrow labeled 0.364 emerges from “Attitude” and connects to “Behavioural Intention to Use”. A straight upward arrow labeled 0.156 emerges from “Trust” and connects to “Behavioural Intention to Use”. A dashed rightward arrow labeled 0.301 emerges from “Behavioural Intention to Use” and connects to “Adoption”.

The model generated from a meta-analysis of mobile and digital wallet services. Source(s): Authors’ own work

Figure 7
A path diagram illustrates the relationships among factors influencing mobile and digital wallet service adoption.The path diagram shows seven text boxes. The text box labeled “Behavioural Intention to Use” is positioned at the center. Three vertically arranged text boxes are placed to its left, labeled from top to bottom as “Habit,” “Perceived Privacy,” and “Attitude”. A text box labeled “Compatibility” is positioned above “Behavioural Intention to Use,” and another labeled “Trust” is placed below it. A text box labeled “Adoption” is positioned to the right of “Behavioural Intention to Use”. A diagonal bottom rightward arrow labeled 0.309 emerges from “Habit” and connects to “Behavioural Intention to Use”. A diagonal bottom rightward arrow labeled 0.309 emerges from “Habit” and connects to “Behavioural Intention to Use”. A downward arrow labeled 0.229 emerges from “Compatibility” and connects to “Behavioural Intention to Use”. A dashed rightward arrow labeled 0.177 emerges from “Perceived Privacy” and connects to “Behavioural Intention to Use”. A dashed diagonal upward right arrow labeled 0.364 emerges from “Attitude” and connects to “Behavioural Intention to Use”. A straight upward arrow labeled 0.156 emerges from “Trust” and connects to “Behavioural Intention to Use”. A dashed rightward arrow labeled 0.301 emerges from “Behavioural Intention to Use” and connects to “Adoption”.

The model generated from a meta-analysis of mobile and digital wallet services. Source(s): Authors’ own work

Close modal
Figure 8
A path diagram shows relationships among factors influencing behavioral intention to use Q R code payment services.The path diagram shows four text boxes. The text box labeled “Behavioural Intention to Use” is positioned at the center. A text box labeled “Compatibility” is positioned to the left of it, a text box labeled “Social Influence” is positioned to the right, and a text box labeled “Performance Expectancy” is positioned above it. A dashed rightward arrow labeled 0.356 emerges from “Compatibility” and connects to “Behavioural Intention to Use”. A dashed leftward arrow labeled 0.262 emerges from “Social Influence” and connects to “Behavioural Intention to Use”. A dashed downward arrow labeled 0.317 emerges from “Performance Expectancy” and connects to “Behavioural Intention to Use”.

The model generated from a meta-analysis of QR code payment services. Source(s): Authors’ own work

Figure 8
A path diagram shows relationships among factors influencing behavioral intention to use Q R code payment services.The path diagram shows four text boxes. The text box labeled “Behavioural Intention to Use” is positioned at the center. A text box labeled “Compatibility” is positioned to the left of it, a text box labeled “Social Influence” is positioned to the right, and a text box labeled “Performance Expectancy” is positioned above it. A dashed rightward arrow labeled 0.356 emerges from “Compatibility” and connects to “Behavioural Intention to Use”. A dashed leftward arrow labeled 0.262 emerges from “Social Influence” and connects to “Behavioural Intention to Use”. A dashed downward arrow labeled 0.317 emerges from “Performance Expectancy” and connects to “Behavioural Intention to Use”.

The model generated from a meta-analysis of QR code payment services. Source(s): Authors’ own work

Close modal
Table 1

Inclusion and exclusion criteria

CriteriaInclusionExclusion
PopulationStudies that elucidate or observe the factors affecting the utilization and implementation of electronic paymentStudies not related to digital payments or factors influencing digital payment decisions
InterventionsStudies that use or extend the UTAUT (unified theory of acceptance and utilization of technology) model as an analytical frameworkStudies that do not use or extend the UTAUT model as an analytical framework
OutputStudies involving populations of users or individuals involved in digital paymentsStudies involving populations that are not relevant to digital payments, for example, studies that focus on physical transactions or non-digital payments
Research designQuantitative/mixed methods researchReview, qualitative, proceedings
Research year2013–2023Other than 2013–2023
LanguageEnglishNon-English
Scopus RankingQ1-Q2Other than Q1-Q2
Data CompletenessThe PDF is complete, sample size and complete statistical data including t-valueThere is incomplete data
Source(s): Authors’ own work
Table 2

Variables codification

Adoption (ADOP)Adoption, customers adoption, service adoption, user adoption, actual use/use behavior, usage, use, frequency of usage
Attitude (ATT)Attitude, attitude toward, customer attitude
Behavioral intention to use (BIU)Behavioral intention to use, behavior intention, intention, intention to adopt, intention to use, usage intention
Compatibility (CMPA)Compatibility, construction of compatibility, lifestyle compatibility, perceived compatibility, service compatibility
Customer service (COSE)Customer service
Satisfaction (SAT)Customer satisfaction, perceived satisfaction, satisfaction, usage satisfaction, user satisfaction
Effort Expectancy (EE)Ease of use, perceived ease of use, effort expectancy, expected effort
Facilitating conditions (FC)Facilitating conditions, unavailability of facilitating conditions
Hedonic Motivation (HM)Hedonic motivation, hedonic, enjoyment, enjoyment benefit, perceived enjoyment
Habit (HAB)Habit
Perceived risk (PR)Perceived risk, perceived environmental risk, risk perceptions, risk, risk barrier, riskiness
Perceived privacy (PPR)Privacy, perceived privacy, privacy concerns
Security (SCR)E-Security, perceived security, financial security, security/security assurance
Performance expectancy (PE)Perceived usefulness, E-perceived usefulness, usefulness, expected usefulness, performance, performance expectancy, individual performance, perceived benefit
Price value (PV)Price benefit, price value, perceived value, perceived utility, economic benefit
Reliability (REL)Reliability
Social influence (SI)Social influence, social factor, social norms, interpersonal influence, social approval, subjective norms
Trust (TRU)Trust, consumer trust, initial trust, perceived trust, trust belief, system trust
Website design (WD)Website design, website features, interface design, E-design, visual interface
Source(s): Authors’ own work
Table 3

Meta-analysis findings and corresponding weights for digital payment

Dependent variableIndependent variableNrCI 95%Std. errortauˆ2QI2Fail-safe NWeight
BIUATT90.411*0.3240.4990.0450.01693.08691.4063,0551BP
 CMPA90.247*0.2040.290.0220.00215.4848.3218381BP
 COSE30.099*0.0420.1560.02900.0640100.333333 
 EE380.107*0.080.1350.0140.005106.0965.1242,2500.394737 
 FC320.133*0.1020.1630.0160.00598.768.5922,6870.65625 
 HAB130.328*0.2110.4440.0590.042180.19493.34118440.923077BP
 HM200.158*0.1140.2020.0230.00761.60569.1591,1660.5BP
 PE470.208*0.170.2460.0190.015340.43586.48813,3010.829787BP
 PV190.167*0.1230.2120.0230.00656.88368.3561,2270.631579 
 PPR60.126*0.0740.1780.02704.3810430.5 
 PR170.146*0.0880.2040.030.012101.67484.2639510.588235 
 REL30.278*0.2210.3350.029000991 
 SAT80.181*0.0940.2690.0450.01458.89688.1153800.75 
 SCR100.127*0.0660.1880.0310.00732.19972.0481990.5 
 SI360.204*0.1490.2590.0280.025421.30691.6928,0600.666667 
 TRU200.203*0.1280.2780.0380.027265.48292.8432,5930.85BP
 WD40.21*0.160.2590.02500.7950991PP
AdoptionBIU140.499*0.380.6180.0610.048253.39694.876,3531BP
 EE20.108NS−0.0720.2870.0920.0123.33269.98520.5 
 FC40.279*0.0060.5520.1390.07579.80496.2411600.75 
 HAB30.321*0.2210.420.0510.0055.25761.9531141PP
 TRU30.103NS−0.0040.210.0550.0066.42768.879100.333333 
 SI20.245*0.0720.4180.0880.0113.10267.758180.5 

Note(s): (N) Number of observations obtained from study analyses; r = correlation observed in studies corresponding to sample size; Cl (95%) = confidence interval; Q = test of heterogeneity in individuals; I2 = scale-free heterogeneity index; (*) = p < 0.01; NS = not significant, BP = best Predictor, PP = promising predictor

Source(s): Authors’ own work
Table 4

Meta and weight analysis results for digital banking services

Dependent variableIndependent variableNRCI 95%Std. errortauˆ2QI2Fail-safe NWeightType
BIUATT40.4920.4*0.5830.0470.00719.94384.9571,0591PP
 COSE30.0990.042*0.1560.02900.0640100.333333 
 EE170.120.09*0.150.0150.00123.91933.1085460.529412 
 FC120.1140.078*0.1510.0190.00116.86634.7782440.583333 
 HAB60.3590.17*0.5490.0970.05271.00292.9583930.833333BP
 HM70.1010.052*0.150.0250.0017.88523.907440.142857 
 PE190.1970.14*0.2540.0290.013116.384.52319570.789474 
 PEVA80.1940.124*0.2640.0360.00721.96968.1362670.75 
 PR60.1560.102*0.2090.0270.00314.89266.4242200.833333BP
 REL30.2780.221*0.3350.029000991PP
 SI150.1850.07*0.2990.0580.048313.06495.5281,1790.533333 
 TRU90.2620.106*0.4180.0790.054156.74494.8967030.888889BP
 WD40.210.16*0.2590.02500.7950991PP
 PPR40.0960.03*0.1620.03402.194090.25 
 SAT20.266−0.034NS0.5650.1530.04416.82894.057361PP
 SCR40.1760.104*0.2480.0370.0013.60816.849360.5 
AUBIU100.5470.377*0.7160.0860.071211.72695.7493,2301BP
 HAB20.3510.215*0.4880.0690.0073.1368.05581PP
 TRU20.058−0.007 NS0.1240.03300.809000 
Source(s): Authors’ own work
Table 5

Meta and weight analysis results for mobile and digital wallet services

Dependent variableIndependent variableNRCI 95%Std. errortauˆ2QI2Fail-safe NWeightType
BIUEE210.098*0.0560.1410.0220.00780.21175.0665930.285714 
 ATT40.364*0.2350.4940.0660.01529.54989.8473841PP
 CMPA70.229*0.1940.2640.01807.37818.6774681BP
 FC200.144*0.1010.1870.0220.00779.97276.2421,2870.65 
 HAB60.309*0.1310.4860.0910.046103.79495.1834381BP
 HM90.207*0.1270.2870.0410.01242.05180.9764200.666667 
 PE240.199*0.1440.2550.0280.016192.66888.0623,2160.625 
 PEVA110.148*0.0890.2080.030.00733.34870.0133400.545455 
 PP20.177*0.0920.2610.04300.0120111PP
 PR70.113*0.0520.1750.0310.00412.87353.392660.571429 
 SCR60.102*0.0240.1810.040.00723.95979.131600.5 
 SI190.214*0.1610.2670.0270.011100.38382.0692,3910.736842 
 TRU110.1560.0860.2260.0360.01280.23787.5375870.818182BP
 SAT60.155*0.0690.240.0440.0133.77885.1971780.666667 
 AUBIU20.301*0.1140.4890.0960.0166.9685.633491PP
 EE20.108NS−0.0720.2870.0920.0123.33269.98520.5 
 FC20.097*0.020.1730.03900.554030.5 
 SI20.245*0.0720.4180.0880.0113.10267.758180.5 
Source(s): Authors’ own work
Table 6

Meta and weight analysis results for QR code payment services

Dependent variableIndependent variableNRCI 95%Std. errortauˆ2QI2Fail-safe NWeightType
BIUHM30.167 *0.0970.2360.0360.0012.38816.236262 
 PE40.317 *0.2370.3960.0410.0046.59554.5091964PP
 PR30.048 NS−0.0160.1120.03300.935000 
 SI20.262 *0.1890.3350.03701.0827.562392PP
 CMPA20.356 *0.2740.4380.04200.3880522PP
Source(s): Authors’ own work

Supplements

References

Abu-Taieh
,
E. M.
,
AlHadid
,
I.
,
Abu-Tayeh
,
S.
,
Masa’deh
,
R.
,
Alkhawaldeh
,
R. S.
,
Khwaldeh
,
S.
, &
Alrowwad
,
A.
(
2022
).
Continued intention to use of M-banking in Jordan by integrating UTAUT, TPB, TAM and service quality with ML
.
Journal of Open Innovation: Technology, Market, and Complexity
,
8
(
3
), 120. doi: .
Agárdi
,
I.
, &
Alt
,
M. A.
(
2022
).
Do digital natives use mobile payment differently than digital immigrants? A comparative study between generation X and Z
.
Electronic Commerce Research
,
24
(
3
),
1463
1490
. doi: .
Al-Saedi
,
K.
,
Al-Emran
,
M.
,
Ramayah
,
T.
, &
Abusham
,
E.
(
2020
).
Developing a general extended UTAUT model for M-payment adoption
.
Technology in Society
,
62
, 101293. doi: .
Amriena
,
G.
, &
Ramayanti
,
R.
(
2024
).
Consumer adoption of BRImo mobile banking application: An extended TAM perspective
.
Islamic Finance, Contributions to Management Science
,
753
766
. doi: .
Bhugaonkar
,
K.
,
Bhugaonkar
,
R.
, &
Masne
,
N.
(
2022
).
The trend of metaverse and augmented & virtual reality extending to the healthcare system
.
Cureus
,
14
(
9
), e29071. doi: .
Blut
,
M.
,
Chong
,
A. Y. L.
,
Tsigna
,
Z.
, &
Venkatesh
,
V.
(
2022
).
Meta-analysis of the unified theory of acceptance and use of technology (UTAUT): Challenging its validity and charting a research agenda in the red ocean
.
Journal of the Association for Information Systems
,
23
(
1
),
13
95
. doi: .
Borenstein
,
M.
,
Hedges
,
L.
,
Higgins
,
J.
, &
Rothstein
,
H.
(
2009
).
Introduction to Meta-Analysis
.
John Wiley & Sons, Ltd
.
Capgemini
(
2022
).
World report series : Payment
.
Capgemini
(
2025
).
World payments report 2025
.
Chawla
,
D.
, &
Joshi
,
H.
(
2019
).
Consumer attitude and intention to adopt mobile wallet in India – an empirical study
.
International Journal of Bank Marketing
,
37
(
7
),
1590
1618
. doi: .
Che Nawi
,
N.
,
Mamun
,
A. Al
,
Hayat
,
N.
, &
Seduram
,
L.
(
2022
).
Promoting sustainable financial services through the adoption of eWallet among Malaysian working adults
.
Sage Open
,
12
(
1
). doi: .
Chen
,
C. C.
, &
Tsang
,
S. S.
(
2019
).
Predicting adoption of mobile payments from the perspective of taxi drivers
.
IET Intelligent Transport Systems
,
13
(
7
),
1116
1124
. doi: .
Datareportal
(
2023
).
Digital 2023: Overview global report
.
de Luna
,
I. R.
,
Liebana-Cabanillas
,
F.
,
Sanchez-Fernandez
,
J.
, &
Munoz-Leiva
,
F.
(
2019
).
Mobile payment is not all the same: The adoption of mobile payment systems depending on the technology applied
.
Technological Forecasting and Social Change
,
146
,
931
944
. doi: .
Elad
,
B.
(
2025
).
QR code payments statistics 2025: Adoption rates and future projections
.
Coinlaw
.
Ewe
,
S. Y.
,
Yap
,
S. F.
, &
Lee
,
C. K. C.
(
2015
).
Network externalities and the perception of innovation characteristics: Mobile banking
.
Marketing Intelligence & Planning
,
33
(
4
),
592
611
. doi: .
Giovanis
,
A.
,
Athanasopoulou
,
P.
,
Assimakopoulos
,
C.
, &
Sarmaniotis
,
C.
(
2019
).
Adoption of mobile banking services: A comparative analysis of four competing theoretical models
.
International Journal of Bank Marketing
,
37
(
5
),
1165
1189
. doi: .
Higgins
,
J. P. T.
, &
Thompson
,
S. G.
(
2002
).
Quantifying heterogeneity in a meta-analysis
.
Statistics in Medicine
,
21
(
11
),
1539
1558
. doi: .
Hunter
,
J. E.
and
Schmidt
,
F. L.
(
2004
),
Methods of meta-analysis: Correcting error and bias in research finding
.
Isaac
,
O.
,
Abdullah
,
Z.
,
Aldholay
,
A. H.
, &
Abdulbaqi Ameen
,
A.
(
2019
).
Antecedents and outcomes of internet usage within organisations in Yemen: An extension of the Unified Theory of Acceptance and Use of Technology (UTAUT) model
.
Asia Pacific Management Review
,
24
(
4
),
335
354
. doi: .
Jadil
,
Y.
,
Rana
,
N. P.
, &
Dwivedi
,
Y. K.
(
2021
).
A meta-analysis of the UTAUT model in the mobile banking literature: The moderating role of sample size and culture
.
Journal of Business Research
,
132
,
354
372
. doi: .
Jeyaraj
,
A.
,
Rottman
,
J. W.
, &
Lacity
,
M. C.
(
2006
).
A review of the predictors, linkages, and biases in IT innovation adoption research
.
Journal of Information Technology
,
21
(
1
),
1
23
. doi: .
Kasilingam
,
D. L.
(
2020
).
Understanding the attitude and intention to use smartphone chatbots for shopping
.
Technology in Society
,
62
, 101280. doi: ,
May
.
Kaur
,
P.
,
Dhir
,
A.
,
Bodhi
,
R.
,
Singh
,
T.
, &
Almotairi
,
M.
(
2020
).
Why do people use and recommend m-wallets?
.
Journal of Retailing and Consumer Services
,
56
, 102091. doi: .
Khan
,
W. Z.
,
Aalsalem
,
M. Y.
, &
Khan
,
M. K.
(
2019
).
Communal acts of IoT consumers: A potential threat to security and privacy
.
IEEE Transactions on Consumer Electronics
,
65
(
1
),
64
72
. doi: .
Kwateng
,
K. O.
,
Atiemo
,
K. A. O.
, &
Appiah
,
C.
(
2019
).
Acceptance and use of mobile banking: An application of UTAUT2
.
Journal of Enterprise Information Management
,
32
(
1
),
118
151
. doi: .
Liébana-Cabanillas
,
F.
,
Singh
,
N.
,
Kalinic
,
Z.
, &
Carvajal-Trujillo
,
E.
(
2021
).
Examining the determinants of continuance intention to use and the moderating effect of the gender and age of users of NFC mobile payments: A multi-analytical approach
.
Information Technology and Management
,
22
(
2
),
133
161
. doi: .
Lin
,
W. R.
,
Lin
,
C. Y.
, &
Ding
,
Y. H.
(
2020
).
Factors affecting the behavioral intention to adopt mobile payment: An empirical study in Taiwan
.
Mathematics
,
8
(
10
),
1
19
. doi: .
Ly
,
H. T. N.
,
Khuong
,
N. V.
, &
Son
,
T. H.
(
2022
).
Determinants affect mobile wallet continuous usage in Covid 19 pandemic: Evidence from Vietnam
.
Cogent Business and Management
,
9
(
1
), 2041792. doi: .
Malarvizhi
,
C. A.
,
Al Mamun
,
A.
,
Jayashree
,
S.
,
Naznen
,
F.
, &
Abir
,
T.
(
2022
).
Predicting the intention and adoption of near field communication mobile payment
.
Frontiers in Psychology
,
13
, 870793. doi: .
Malyshev
,
A.
(
2025
).
Digital banking: 2025 market overview, trends & insights
.
SDK.Finance
.
MeaWallet
(
2025
).
Over half the world’s population will use mobile wallets by 2025, says Boku study
.
MeaWallet
.
Merhi
,
M.
,
Hone
,
K.
, &
Tarhini
,
A.
(
2019
).
A cross-cultural study of the intention to use mobile banking between Lebanese and British consumers: Extending UTAUT2 with security, privacy and trust
.
Technology in Society
,
59
, 101151. doi: .
Neves
,
C.
,
Oliveira
,
T.
,
Santinib
,
F.
, &
Gutman
,
L.
(
2023
).
Adoption and use of digital financial services: A meta-analysis of barriers and facilitators
.
International Journal of Information Management Data Insights
,
3
(
2
), 100201. doi: .
Nguyen
,
T.
,
Pham
,
H. C.
,
Dick
,
M.
, &
Richardson
,
J.
(
2021
).
Trust types and mediating effect of consumer trust in m-payment adoption: An empirical examination of Vietnamese consumers
.
Australasian Journal of Information Systems
,
25
. doi: .
Page
,
M. J.
,
McKenzie
,
J. E.
,
Bossuyt
,
P. M.
,
Boutron
,
I.
,
Hoffmann
,
T. C.
,
Mulrow
,
C. D.
, …
Moher
,
D.
(
2021
).
The PRISMA 2020 statement: An updated guideline for reporting systematic reviews
.
The BMJ
,
372
,
n71
. doi: .
Ramayanti
,
R.
,
Rachmawati
,
N. A.
,
Azhar
,
Z.
, &
Nik Azman
,
N. H.
(
2024a
).
Exploring intention and actual use in digital payments: A systematic review and roadmap for future research
.
Computers in Human Behavior Reports
,
13
, 100348. doi: .
Ramayanti
,
R.
,
Rachmawati
,
N. A.
,
Setiawan
,
R.
, &
Azhar
,
Z.
(
2024b
).
Driving sustainable financial management: An investigation of factors influencing the use of digitals technologies by MSMEs
.
Journal of Governance and Regulation
,
13
(
2
),
76
85
. doi: .
Ramayanti
,
R.
,
Azhar
,
Z.
, &
Nik Azman
,
N. H.
(
2025
).
Factors influencing intentions to use QRIS: A two-staged PLS-SEM and ANN approach
.
Telematics and Informatics Reports
,
17
, 100185. doi: .
Rana
,
R. L.
,
Adamashvili
,
N.
, &
Tricase
,
C.
(
2022
).
The impact of blockchain technology adoption on tourism industry: A systematic literature review
.
Sustainability
,
14
(
12
),
7383
. doi: .
Ricson
(
2025
).
61+ QR code statistics & trends 2025 full report
.
Rogers
,
E. M.
(
2003
).
Diffusion of innovations
.
Free Press
( (5th ed.) ).
New York, NY
:
A Division of Simon & Schuster
, 10020.
Rosenthal
,
R.
(
1979
).
The file drawer problem and tolerance for null results
.
Psychological Bulletin
,
86
(
3
),
638
641
. doi: .
Singh
,
N.
,
Sinha
,
N.
, &
Liébana-Cabanillas
,
F. J.
(
2020
).
Determining factors in the adoption and recommendation of mobile wallet services in India: Analysis of the effect of innovativeness, stress to use and social influence
.
International Journal of Information Management
,
50
,
191
205
. doi: .
Venkatesh
,
V.
,
Thong
,
J. Y. L.
, &
Xu
,
X.
(
2012
).
Consumer acceptance and use of information technology: Extending the unified theory of acceptance and use of technology
.
MIS Quarterly
,
36
(
1
),
157
178
. doi: .

Languages

or Create an Account

Close Modal
Close Modal