Skip to article sections
Purpose

To develop a lightweight and accurate computer-aided diagnostic framework for multiclass skill lesion classification with focus on Mpox that enables rapid and reliable detection during fast-spreading viral outbreaks, particularly in resource-constrained healthcare environments.

Design/methodology/approach

The proposed framework integrates a Lightweight Depthwise-Separable Convolutional Neural Network with an Adaptive Bayesian Boosted Learning Module (LDSCNN–ABBLM). Contrast-limited adaptive histogram equalization (CLAHE) is applied to enhance lesion visibility, while class-weighted learning mitigates data imbalance. The LDSCNN backbone performs efficient feature extraction using depthwise-separable convolutions, and ABBLM employs Bayesian optimization via Optuna to adaptively tune boosting parameters over 15 trials. The model is evaluated on the MCSI and clinically validated MSLD v2 datasets and compared against multiple weighted baseline classifiers, including Weighted Random Forest, Weighted Linear SVM, Weighted LightGBM, Weighted Extra Trees, and Weighted XGBoost.

Findings

The proposed model achieves validation accuracies of 0.9893 and 0.9983 on the MCSI and MSLD v2 datasets, respectively, demonstrating strong diagnostic reliability and superior generalization performance compared to all baseline models.

Research limitations/implications

The model focuses exclusively on image-based diagnosis and does not incorporate clinical parameters such as patient history, symptoms, or laboratory findings, which are essential for comprehensive diagnosis. Furthermore, although the LDSCNN architecture is computationally efficient, real-time deployment on low-power edge devices in clinical settings may face challenges due to hardware variability and potential latency issues.

Practical implications

The lightweight and scalable design enables deployment in low-resource and point-of-care settings, facilitating early Mpox detection and outbreak containment. Adherence to clinical validation and ethical standards further supports the framework's integration into real-world AI-assisted dermatological and public health decision-support systems.

Originality/value

This study introduces a unified lightweight diagnostic framework that synergistically combines depthwise separable convolutional feature extraction with adaptive Bayesian-optimized boosting, offering a novel balance between high diagnostic accuracy and computational efficiency for Mpox lesion classification.

Monkeypox, now known as Mpox, has emerged as a significant global health concern. Since the onset of the 2023–2025 epidemic, over 118,000 confirmed cases have been reported across 127 countries, with more than 800 fatalities, primarily in the Democratic Republic of the Congo (DRC). In August 2024, the World Health Organization (WHO) declared the outbreak a public health emergency of international concern. The virus primarily spreads through close contact, with recent cases in Europe and America underscoring its growing global reach (World Health Organization, 2024; Weintraub, 2025).

Mpox, caused by the Mpox virus, presents a variety of symptoms in humans. It typically begins with flu-like signs, such as fever, headache, muscle aches, and fatigue. This is followed by a distinctive rash that starts on the face and spreads to other parts of the body, progressing from small, raised bumps to fluid-filled blisters (CDC, 2024; Usman et al., 2017). Other possible symptoms include swollen lymph nodes, sore throat, cough, and gastrointestinal issues like nausea, vomiting, and diarrhea (Thornhill et al., 2022). The incubation period ranges from 3 to 17 days, during which the individual remains asymptomatic (CDC, 2024).

Following the onset of Mpox symptoms, a timely and accurate diagnosis is crucial due to its similarity to other skin lesions. Traditional methods, including PCR, genome sequencing, antigen/antibody detection, and virus isolation, are accurate but resource-intensive, requiring specialized equipment and trained personnel, often causing delays, particularly in resource-limited or rural settings (Liu et al., 2024a). Machine learning offers a transformative solution by analyzing complex patterns in skin lesion images, aiding dermatologists in distinguishing Mpox from similar conditions. This enhances diagnostic accuracy, reduces human error, and supports personalized treatment. Given the limitations of conventional approaches, such as subjectivity, limited accessibility, and delayed results, researchers increasingly rely on image-based machine learning models for faster, more consistent, and scalable Mpox diagnosis.

Building on recent advances in image-based diagnostics (Debnath et al., 2025; Cao et al., 2025; Setegn & Dejene, 2025; Ali et al., 2024; Thieme et al., 2023), the accurate classification of Mpox requires the integration of cutting-edge machine learning and deep learning techniques within dermatologic image analysis. Beyond supporting dermatologists in diagnosis, these technologies offer the potential to improve patient outcomes by enabling timely, precise identification of Mpox, thereby reducing the risks of misdiagnosis and severe disease progression.

Hence, this study presents a novel framework integrating convolutional neural networks (CNNs) for feature extraction with a Bayesian-optimized Weighted C-SVM (BOW-SVM) classifier. The CNN captures discriminative patterns from dermatologic images, while the BOW-SVM improves classification performance by optimally tuning hyperparameters via Bayesian optimization and effectively handling class imbalance. Bayesian optimization (BO) was chosen for hyperparameter tuning due to its efficiency and systematic exploration of the search space. Unlike grid search, which exhaustively tests all combinations, or random search, which samples randomly. Studies (Liu et al., 2024b; Yang, Liu, & Wen, 2024; Yousaf et al., 2024; Lu, Zhang, Fan, Wan, & Luo, 2025; Li, Zhou, & Wang, 2025) have demonstrated the effectiveness of BO, validating its efficacy in various applications. This synergy improves accuracy, robustness, and generalization, making it particularly suited for complex clinical tasks. To the best of our knowledge, this integrated approach has not been employed in any previous study on Mpox prediction.

The main contributions of this study are as follows.

  1. Contrast-limited adaptive histogram equalization (CLAHE) was employed to enhance the visibility and clarity of skin lesion features, thereby improving subsequent feature extraction and classification accuracy.

  2. We designed a novel lightweight depthwise separable convolutional neural network (LDSCNN) to efficiently extract discriminative Mpox-specific features from enhanced images while minimizing computational complexity.

  3. An adaptive Bayesian-optimized boosting learning machine (ABBLM) was proposed, where Bayesian optimization via Optuna was used to fine-tune key hyperparameters, improving classification performance and generalization.

  4. This framework further enabled the analysis of parameter importance and performance history, offering valuable insights into the influence of hyperparameter tuning on model behavior and performance.

  5. The proposed LDSCNN-ABBLM framework was rigorously compared with several state-of-the-art models in terms of classification accuracy, model complexity, and architectural efficiency, consistently demonstrating outstanding results.

This study advances Mpox diagnosis by introducing a robust and interpretable deep learning–machine learning framework tailored for real-world clinical deployment. The proposed system integrates CLAHE-based image enhancement, a lightweight depthwise separable convolutional neural network (LDSCNN) for efficient feature extraction, and an Adaptive Bayesian-Optimized Boosting Learning Machine (ABBLM) for accurate classification. This combination not only improves diagnostic performance but also addresses critical challenges such as overfitting and limited generalization. A total of 30 optimization trials were conducted using Bayesian optimization, enabling systematic hyperparameter tuning. The resulting insights into parameter importance and performance history contributed to enhanced model accuracy, stability, and decision reliability in classifying Mpox from dermatologic images.

The remainder of this study is organized as follows: Section 2 reviews related works, while Section 3 describes the system model framework and methodology. Section 4 reports the experimental results and comparative performance analysis. Finally, Section 5 concludes the study and outlines directions for future research.

Recent advances in machine learning and deep learning have shown promise in automating skin lesion analysis, enhancing diagnostic accuracy, and reducing the burden on healthcare professionals.

Convolutional Neural Networks (CNNs) are among the most powerful deep neural network architectures for processing image data (Albawi, Bayat, Al-Azawi, & Ucan, 2018). Convolutional, nonlinear, and pooling layers are some of the techniques CNNs use to extract key features from raw images automatically. Several computer vision tasks, such as image classification, object detection, image segmentation, and face recognition, have achieved notable successes (Li, Liu, Yang, Peng, & Zhou, 2021).

CNNs have also made notable progress recently in healthcare applications; for instance, Mujahid et al. (2024) propose EfficientNet for malaria detection using red blood cell images and achieve 97.57% accuracy. It includes performance comparisons with pre-trained models and uses k-fold cross-validation, demonstrating practical benefits for healthcare professionals. Majumdar, Pramanik, and Sarkar (2023) proposed an ensemble of three pre-trained CNN models, GoogleNet, VGG11, and MobileNetV3Small, to detect breast cancer in histopathological images. The models achieved classification accuracies of 99.16% and 96.95% on two benchmark datasets. Also, a study by Kumari and Ghosh (2023) presents a transfer learning-based AI system for classifying breast cancer from histopathological images using three deep CNN architectures: VGG-16, Xception, and DenseNet-201. It classifies images as benign or malignant regardless of the magnification factor. When evaluating the Invasive Ductal Carcinoma (IDC) and Breast Cancer Histopathological (BreaKHis) datasets, the system achieved a classification accuracy of 99.42% and 99.12%, respectively, outperforming state-of-the-art methods.

With the global emergence of Mpox, researchers have increasingly focused on leveraging deep learning to classify skin lesions associated with the disease. Gabriel, Kumar, and Prasad, (2025) proposed the D2T-PT model, integrating transfer learning and digital twin technology for Mpox detection. Using the MSLD dataset, their adaptive NasNetMobile model achieved 100% recall, 98% ROC, and 97.78% accuracy. Raha et al. (2024) employed an attention-based MobileNetV2 model for Mpox image classification, reporting outstanding performance compared to baseline models, with accuracies of 92.28% on the extended MSID dataset, 98.19% on the original MSID dataset, and 93.33% on the MSLD. Notably, their study avoided data augmentation techniques to maintain the authenticity of medical images, enhancing the model's ability to learn from real-world data. However, this decision may limit the model's robustness to variations and biases in clinical images. Al-Gaashani, Xu, and Obsie (2024) proposed an advanced Mpox detection model based on MobileNetV2, enhanced with progressive transfer learning, a Residual Dilated Spatial Pyramid Integration (ResDSPI) block, and an Efficient Channel Attention (ECA) module.

Karaddi, Sharma, and Bhattacharya (2024) developed the Softflatten network (Softflatten-Net), a deep convolutional neural network architecture designed for the automated detection and classification of monkeypox using skin lesion images. This model addresses challenges like gradient vanishing and overfitting and achieves high classification accuracy across multiple classification tasks. The proposed network outperforms existing models in terms of accuracy, sensitivity, and precision, and its performance is validated on several datasets. It also includes interpretability techniques to analyze misclassifications. Asif, Zhao, Li, Tang, and Zhu (2024a) introduced the Choquet Fuzzy Integral-based Ensemble (CFI-Net) for accurate classification of skin and oral diseases, with a focus on detecting Mpox, foot ulcers, and oral diseases. The approach enhances base classifiers through transfer learning and optimizes fuzzy measures using meta-heuristic algorithms, achieving remarkable classification accuracy across multiple disease detection tasks.

Maqsood, Damaševičius, Shahid, and Forkert (2024) proposed an integrated CAD system for monkeypox classification that incorporates fusion-based contrast enhancement, modified deep learning models, feature fusion using sparse decomposition, entropy-controlled firefly feature selection, and a multi-class SVM classifier. This approach demonstrated superior performance compared to state-of-the-art methods in both visual and quantitative evaluations, and Asif, Zhao, Li, Tang, and Zhu (2024b) introduced the CGO-Ensemble framework for Mpox detection by integrating transfer learning models with Chaos Game Optimization for weighted fusion.

Several studies have effectively employed pre-trained Convolutional Neural Networks (CNNs) for feature extraction in Mpox classification (Kesav & MG, 2023; Kesav & Jibukumar, 2022; Khairandish, Sharma, Jain, Chatterjee, & Jhanjhi, 2022; Zhang et al., 2021). Kesav and MG (Kesav & MG, 2023) used GoogLeNet for feature extraction from chest X-rays and classified them using various machine learning models. The Bayesian-optimized kernel SVM achieved top accuracy in both binary and three-class COVID-19 detection tasks. In a related study, (Kesav & Jibukumar, 2022) introduces a low-complexity framework for brain tumor analysis, employing RCNN with a two-channel CNN backbone for feature extraction and SVM for classification, achieving 98.21% accuracy and 98.83% confidence with reduced execution time across three tumor types. Similarly, a hybrid CNN-SVM framework that combines deep feature extraction with threshold-based segmentation for accurate detection and classification of brain tumors in MRI images was proposed by (Khairandish et al., 2022), achieving high performance and efficient tumor localization across multiple tumor types.

Effective preprocessing is essential in medical image analysis to enhance feature visibility, reduce noise, and improve lesion contrast before deep learning–based feature extraction. Contrast Limited Adaptive Histogram Equalization (CLAHE), introduced by Zuiderveld (1994), has been widely used to boost image clarity and deep learning performance across diverse diagnostic tasks. Yoshimi et al. (2024) demonstrated that CLAHE preprocessing significantly increases the robustness and accuracy of encoder-decoder CNNs for automated segmentation of temporomandibular joint articular disks in MRI datasets. Ji et al. (2024) further applied CLAHE within a multi-network fusion framework, enhancing dermoscopy-assisted diagnosis and differentiation of scalp psoriasis and seborrheic dermatitis. CLAHE has also been incorporated into deep learning pipelines for multi-class skin lesion classification, strengthening the discriminative power of global average pooling layers and improving lesion boundary visibility (Raghavendra, Charitha, Begum, & Prasath, 2023). Advanced CLAHE-based techniques, including Sailfish Optimizer enhanced U-Net and Bayesian optimization CLAHE, have shown substantial gains in segmentation and classification accuracy by optimizing local contrast and adaptive clip limits (Yogalakshmi & Rani, 2024; Han, Choi, Kim, & Lee, 2025).

As summarized in Table 1, existing Mpox detection frameworks face persistent challenges such as limited dataset diversity, inadequate attention to fine-grained lesion attributes, and insufficient optimization for real-time or mobile deployment. These limitations hinder model robustness and scalability, particularly under variations in lighting, skin tone, and environmental conditions. As a result, the performance of many existing methods may not generalize effectively to real-world clinical scenarios or diverse populations.

To address these shortcomings, this study proposes the LDSCNN-ABBLM, a lightweight two-stage framework designed for automated and efficient Mpox diagnosis. In the first stage, contrast-limited adaptive histogram equalization (CLAHE) enhances lesion visibility, while a Lightweight Depthwise Separable Convolutional Neural Network (LDSCNN) extracts discriminative features with reduced computational cost. The second stage employs an Adaptive Bayesian-Optimized Boosting Learning Machine (ABBLM), whose hyperparameters are optimized using Optuna across 30 trials for improved performance. Employing five-fold cross-validation ensures robustness and mitigates overfitting. The proposed LDSCNN-ABBLM achieves high accuracy, interpretability, and generalization, providing a scalable and clinically deployable solution for real-time Mpox detection across heterogeneous image domains.

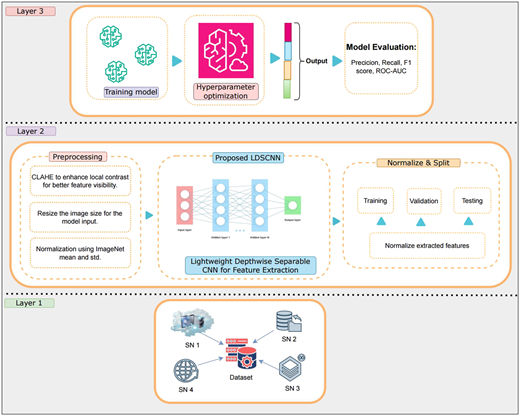
The LDSCNN-ABBLM framework comprises three layers: (1) data sourcing for image aggregation, (2) a deep feature pipeline for preprocessing and extraction using LDSCNN, and (3) optimized model evaluation for training, tuning, and performance assessment, as shown in Figure 1.

The data source layer serves as the foundational stage of the LDSCNN-ABBLM framework, focusing on the acquisition and aggregation of diverse skin lesion images relevant to Mpox and related diseases. Let the initial dataset be represented as:

(1)

where xi denotes the i-th input image and yi its corresponding label, and N is the total number of raw samples collected from various public sources and other medical image repositories. These sources ensure the inclusion of varied demographics and lesion types, improving generalization.

To ensure data quality, a validation function V(xi, yi) is applied to filter out irrelevant or low-quality samples:

(2)

This filtering process removes duplicates, mislabelled, and low-resolution images, resulting in a curated dataset Dclean, where V(xi, yi) was applied to both the Mpox Skin Lesion Dataset (MSLD) and the Mpox Close Skin Images (MCSI) dataset, whose authors had already performed essential cleaning and preprocessing to ensure data quality, with Contrast Limited Adaptive Histogram Equalization (CLAHE) further applied in this study to enhance local contrast and improve image quality.

In this layer, we perform essential preprocessing and feature extraction to prepare the curated dataset Dclean for effective model learning. This layer includes three main steps: image enhancement, feature extraction using LDSCNN, and dataset splitting.

First, each image xiDclean undergoes contrast enhancement using Contrast Limited Adaptive Histogram Equalization (CLAHE), represented as:

(3)

This enhances local contrast, making lesion patterns more distinguishable. The enhanced images are then resized to a fixed dimension (H, W, C) for uniform processing.

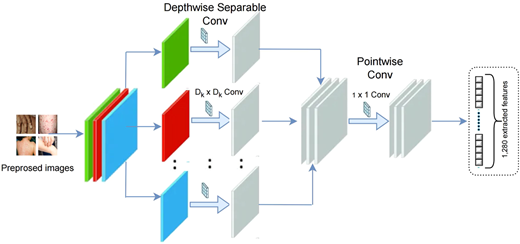
Next, feature extraction is performed using the Lightweight Deep Separable CNN (LDSCNN) as shown in Figure 2, a 19-layer compact convolutional neural network. The 19-layer depth was specifically chosen to balance model complexity and computational efficiency, providing sufficient capacity to capture discriminative patterns from dermatologic images while minimizing overfitting. Let f(⋅; θ) denote the LDSCNN model with parameters θ. The extracted feature vector zi for image xiclahe is computed as:

(4)

These feature vectors {zi}i=1N (where N=|Dclean|) capture spatial and semantic patterns necessary for classification.

Finally, the dataset is partitioned into training, validation, and testing sets:

(5)

This split ensures proper model evaluation and generalization during later stages.

The optimized model evaluation layer is the final stage of the LDSCNN-based classification framework, where the extracted features are used for training, tuning, and evaluating the predictive model. This layer employs a Bayesian Learning–assisted Kernel SVM classifier, combined with hyperparameter optimization and cross-validation, to ensure robust and reliable performance.

Let {(zi,yi)}i=1N denote the feature–label pairs from the training dataset Dtrain, where zi represents the LDSCNN-extracted feature vector and yi the corresponding ground-truth label. The Kernel SVM learns a decision function of the form:

(6)
  • where K(⋅, ⋅) is the selected kernel function, βi are the learned support vector coefficients, and b is the bias term.

To prevent overfitting and ensure generalizability, 5-fold cross-validation is employed on Dtrain, where the dataset is divided into 5 equal subsets. For each fold, 4 subsets are used for training and 1 for validation, rotating across all combinations.

Bayesian Optimization is used to tune hyperparameters such as learning rate, number of estimators, and tree depth. The objective is to minimize a loss function L over the validation folds:

(7)

After selecting the optimal hyperparameters θ*, the final model is evaluated on the test set Dtest using standard metrics such as precision, recall, F1-score, and confusion matrix analysis.

This section presents a comprehensive evaluation of the proposed LDSCNN–ABBLM model for Mpox lesion classification across two benchmark datasets. The experimental pipeline begins with CLAHE preprocessing to enhance lesion visibility, followed by the LDSCNN architecture for efficient and discriminative feature extraction. The extracted deep features are subsequently classified using ABBLM, where Bayesian optimization, implemented via Optuna over 15 trials, is employed to identify the optimal hyperparameter configuration that maximizes classification accuracy. For comparative analysis, the proposed framework is evaluated against several weighted ensemble and margin-based classifiers, including Weighted Random Forest (W-Random Forest), Weighted Linear SVM (W-L SVM), Weighted LightGBM (W-LightGBM), Weighted Extra Trees (W-Extra Trees), and Weighted XGBoost (W-XGBoost). The evaluation further encompasses diagnostic reliability analysis and ablation studies, collectively demonstrating the effectiveness, robustness, and generalization capability of the proposed model.

This study utilized two benchmark datasets: the Mpox Close Skin Images (MCSI), developed by Campana et al. (2024) dataset and the Mpox Skin Lesion Dataset (MSLD v2.0), developed by Ali et al. (2024). The MCSI dataset consists of 400 high-quality images collected from public sources and pre-processed through cropping and zooming to emphasize lesion regions. It is evenly divided into four classes—Mpox, Chickenpox, Acne, and Healthy—supporting the evaluation of machine learning models on smartphone-captured images. In contrast, the MSLD v2.0 dataset comprises 755 clinically validated images from 541 patients across six categories: Mpox, Chickenpox, Measles, Cowpox, Hand-Foot-Mouth Disease (HFMD), and Healthy. Featuring participants of diverse skin tones, sexes, and nationalities, MSLD v2.0 ensures fairness, robustness, and ethical compliance. Its adherence to strict clinical validation and ethical standards enhances reliability and real-world applicability in AI-driven dermatological research and diagnosis.

All images were resized to 224 × 224 pixels to meet the input requirements of the deep learning models. Contrast Limited Adaptive Histogram Equalization (CLAHE) was applied to enhance local contrast and highlight lesion details. To further improve diagnostic precision and generalization, data augmentation was performed using the ImageDataGenerator by applying controlled rotations, horizontal flipping, spatial translations, zoom variations, and brightness adjustments to enhance image diversity and mitigate overfitting.

In our study, the classification of Mpox, Tp denotes the number of true positives or Fp the number of false positives, indicating correct diagnosis. In contrast, false positives Fp or false negative Fn indicates a misdiagnosis. Detailed equations of these metrics can be found in Table 2. To ensure reliable performance assessment, 95% confidence intervals (CIs) were computed for each metric across folds, providing a statistical measure of variability and stability, while these metrics, along with confusion matrix and ROC–AUC analyses, formed the basis for evaluating both cross-validation and final test performance.

Tables 3 and 4 report the 5-fold cross-validation results of the evaluated classifiers on the MCSI and MSLD v2 datasets, with performance measured in terms of accuracy, precision, recall, F1-score, and average inference time, all accompanied by 95% confidence intervals. On the MCSI dataset, the proposed model achieved the best overall performance, attaining an accuracy of 0.9893 (95% CI: 0.9872–0.9914), precision of 0.9894 (95% CI: 0.9873–0.9916), recall of 0.9893 (95% CI: 0.9872–0.9914), and F1-score of 0.9893 (95% CI: 0.9872–0.9914), thereby outperforming all baseline methods. Among the competing classifiers, W-L-SVM demonstrated strong predictive capability while achieving the lowest inference time, indicating superior computational efficiency, whereas ensemble-based approaches such as Random Forest and Extra Trees exhibited higher inference costs despite competitive accuracy. Similarly, on the MSLD v2 dataset, the proposed model consistently delivered the highest performance, recording an accuracy of 0.9828 (95% CI: 0.9781–0.9876), precision of 0.9831 (95% CI: 0.9786–0.9876), recall of 0.9828 (95% CI: 0.9781–0.9876), and F1-score of 0.9828 (95% CI: 0.9782–0.9875), substantially surpassing all baseline classifiers. Although W-L-SVM again offered faster inference, the proposed approach provided a superior balance between predictive performance and robustness. The consistently narrow confidence intervals across both datasets further validate the stability and reliability of the proposed model for Mpox lesion classification.

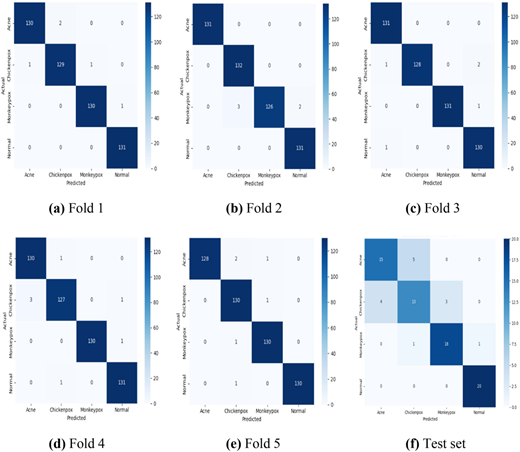
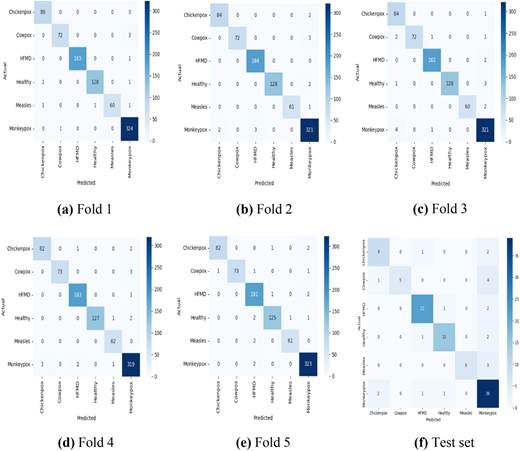
The confusion matrices in Figures 3 and 4 illustrate the classification performance of the proposed model across five cross-validation folds on the MCSI and MSLD v2 datasets, respectively. For the MCSI dataset (Figure 3(a)–(e)), the model exhibits excellent discriminative capability across the four classes—Acne, Chickenpox, Monkeypox, and Normal—with Acne and Normal showing near-perfect classification and minimal confusion between Chickenpox and Monkeypox. For the MSLD v2 dataset (Figure 4(a)–(e)), the model consistently achieves high accuracy, with predictions predominantly concentrated along the diagonal, reflecting strong and stable recognition across all six disease categories—Chickenpox, Cowpox, HFMD, Healthy, Measles, and Monkeypox—with only minor misclassifications observed between visually similar classes such as Monkeypox and Chickenpox. The consistent diagonal dominance across all folds in both datasets demonstrates the robustness and stability of the proposed model during cross-validation.

Following cross-validation, final evaluation on unseen test data assessed generalization, emphasizing Mpox class-specific precision, recall, and F1-score in line with the study objective, as presented in Table 5. cross both datasets, the proposed model consistently performed at par with or better than other benchmark classifiers. On the MSLD v2 dataset, the proposed model achieved a precision of 75%, recall of 91%, and an F1-score of 82%, closely matching or slightly exceeding other strong performers such as W-L-SVM. On the MCSI dataset, the proposed model reached a perfect recall of 100% with precision and F1-score of 95% and 98%, respectively, demonstrating superior balance and generalization compared to competing methods. These results underscore the robustness and discriminative effectiveness of the proposed approach in accurately identifying Mpox, even under unseen, real-world conditions.

The test set confusion matrices in Figure 3(f) and Figure 4(f) demonstrate the model's strong generalization across both datasets. On the MCSI dataset, predictions are highly accurate and consistent across all classes, with minimal misclassifications, highlighting the model's reliability in multiclass skin disease detection. Similarly, on the MSLD v2 dataset, the model maintains precise classification with only a few isolated errors, confirming its robust performance on unseen data and overall stability across diverse conditions.

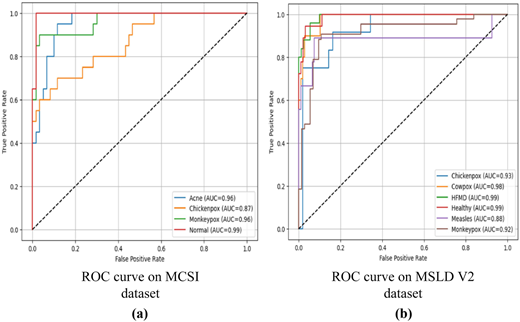
The test set ROC curves in Figure 5 demonstrate strong class-wise discriminative performance of the proposed model. On the MCSI dataset in Figure 5(a), all classes achieve high AUC values, with curves approaching the top-left corner, indicating near-perfect separability. Similarly, on the MSLD v2 dataset as shown in Figure 5(b), the model maintains consistently high AUCs across all classes, reflecting reliable generalization on unseen data. Confusion matrices show minimal misclassifications mainly between visually similar classes, and ROC curves indicate near-perfect separability, confirming reliable differential diagnosis and strong clinical generalization.

The performance of the proposed model is attributed to its advanced architecture, which employs depthwise separable convolutions for efficient and deep feature extraction. This design allows the proposed method to capture complex patterns while maintaining computational efficiency, making it well-suited for datasets with intricate spatial features. Its ability to generalize effectively and balance precision and recall underscores its reliability and positions it as the most effective model for tasks requiring high accuracy and robustness, especially in demanding applications like medical imaging. In summary, the proposed model emerges as the top performer across most metrics, particularly excelling in accuracy, specificity, and AUC, making it the most reliable model among those evaluated.

The proposed LDSCNN–ABBLM framework demonstrates computational efficiency with average inference times of 1.3966 ms/image on MCSI and 5.3471 ms/image on MSLD v2, supporting real-time Mpox diagnosis in resource-constrained environments. Beyond computational aspects, the framework holds clinical significance by facilitating rapid and reliable lesion recognition, potentially aiding early diagnosis and reducing clinician workload. MSLD v2 adheres to rigorous clinical validation and ethical approval standards, ensuring relevance to real-world medical settings. Furthermore, the framework is designed for seamless integration with existing healthcare systems, while acknowledging deployment challenges such as ensuring data privacy, maintaining model robustness across diverse populations, and meeting regulatory compliance for medical AI systems.

To assess the contribution of each component in the proposed framework, an ablation study was performed on both the MCSI and MSLD v2 datasets using 5-fold stratified cross-validation. The complete model configuration integrates CLAHE preprocessing, depthwise-separable convolutional layers, ABBLM ensemble classification, Bayesian hyperparameter optimization, and class weighting. To evaluate the impact of individual components, the following variants were examined: (i) without (w/o) CLAHE preprocessing, (ii) without (w/o) depthwise-separable convolutions, only with standard convolutions, (iii) disabling (w/o) Bayesian optimization, and (iv) training without class weights. Each configuration was independently trained and validated under identical conditions, and the mean performance with 95% confidence intervals was reported for accuracy, precision, recall, and F1-score.

Tables 6 and 7 summarize the ablation study results on the MCSI and MSLD v2 datasets. Excluding any individual component consistently led to decreased performance, underscoring the contribution of each module. Omitting CLAHE preprocessing caused a slight drop in accuracy, highlighting its role in enhancing lesion contrast. Replacing depthwise-separable convolutions with standard convolutions marginally reduced performance, demonstrating the effectiveness of lightweight feature extraction. Disabling Bayesian optimization resulted in a modest decline, indicating its importance in selecting optimal hyperparameters. Removing class weights resulted in the most notable decrease, highlighting the benefit of addressing class imbalance. In all, the full LDSCNN–ABBLM model achieved the highest accuracy, precision, recall, and F1-score on both datasets, confirming that the integrated components collectively enhance generalization and diagnostic reliability.

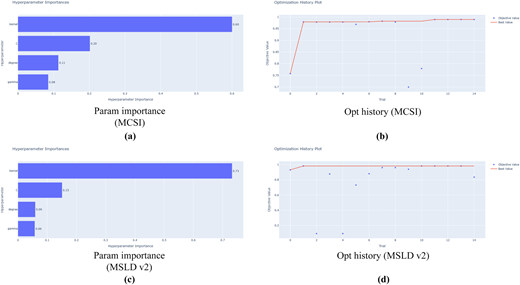
Figure 6 illustrates the Optuna-based hyperparameter tuning outcomes for the MCSI and MSLD v2 datasets, encompassing both parameter importance analysis and optimization trajectories. For the MCSI dataset as shown in Figure 6(a), the kernel parameter emerges as the most influential hyperparameter, contributing the majority of the performance gain. This is followed by the regularization parameter C, while the degree and gamma parameters exhibit comparatively lower importance. This distribution indicates that kernel selection primarily governs the classifier's ability to model complex decision boundaries, whereas fine-grained adjustments to other parameters play a secondary role. The corresponding optimization history shown in Figure 6(b) demonstrates rapid convergence, with the best objective value attained within the initial trials and only marginal fluctuations thereafter, suggesting an efficient exploration of the search space and stable optimization behavior.

A similar pattern is observed for the MSLD v2 dataset as shown in Figure 6(c–d), where the kernel parameter again dominates the importance ranking with a substantially higher contribution than the remaining hyperparameters. The C, degree, and gamma parameters exhibit progressively diminishing influence on model performance. The optimization curve for MSLD v2 shows a sharp improvement in the early trials followed by prompt stabilization, confirming both fast convergence and robustness of the Optuna-driven tuning process. Overall, these results consistently emphasize the decisive role of kernel selection across both datasets, while also demonstrating the effectiveness and stability of the adopted hyperparameter optimization strategy.

Hyperparameter optimization was performed using Optuna's Tree-structured Parzen Estimator (TPE) sampler with 15 trials for each dataset. The search space encompassed key SVM parameters, including the regularization term C, kernel type, gamma, and polynomial degree, as detailed in Table 8. The optimal configurations summarized in Table 9 indicate that the RBF kernel consistently achieved superior performance across both datasets and its multiclass counterpart, underscoring its effectiveness in modeling nonlinear feature interactions. Furthermore, the selected C values of 27.3567 and 373.8548 reflect an appropriate trade-off between margin maximization and classification accuracy. The use of the auto setting for the gamma parameter enabled adaptive feature scaling, contributing to stable convergence and strong generalization performance across both datasets.

  1. Comparison with existing monkeypox detection methods

In this study, both validation and test sets were utilized to ensure reliable model evaluation. The validation set facilitated hyperparameter tuning and model selection, whereas the independent test set was employed for the final performance assessment. To maintain a fair and consistent comparison with existing studies, the test results of the proposed model were reported, as they best represent the generalization capability on unseen data. Accordingly, Table 10 summarizes the comparative analysis of the proposed framework against recent state-of-the-art approaches based on key evaluation metrics.

Rapid computer-aided diagnosis of skin lesions is crucial during fast-spreading viral outbreaks. In this study, we present a Lightweight Depthwise-Separable CNN with an Adaptive Bayesian Boosted Learning Module (LDSCNN–ABBLM) for multiclass Mpox lesion detection. The model combines CLAHE-based image enhancement, class weighting, Bayesian optimization, and ABBLM-based ensemble learning. When evaluated on the MCSI and MSLD v2 datasets, the proposed model achieved validation accuracies of 0.9893 and 0.9983, with corresponding 95% confidence intervals of 0.9872–0.9914 and 0.9781–0.9876, respectively. On the test set, it attained a precision of 75% and a recall of 91% for MCSI, while achieving 95% precision and 100% recall on MSLD v2, indicating strong generalization performance and robust lesion discrimination capability. Notably, MSLD v2 adheres to rigorous clinical validation and ethical approval standards, ensuring real-world applicability in AI-driven dermatology. The proposed framework is also designed for seamless integration with healthcare systems while complying with relevant regulatory and ethical guidelines. By leveraging depthwise-separable convolutions and optimized preprocessing, the model achieves high performance while remaining lightweight, making it suitable for deployment in resource-limited environments.

Future research will emphasize computational optimization and clinical integration. Model quantization and pruning will be explored to further reduce latency and memory footprint. Expanding the dataset with diverse demographic and imaging conditions will improve robustness and fairness. Integration of explainable AI (XAI) mechanisms will enhance interpretability, while collaboration with clinical partners will support real-world validation and regulatory compliance. These efforts aim to advance the model toward scalable, trustworthy, and portable Mpox diagnostic systems for low-resource medical settings.
Ahsan
,
M. M.
,
Uddin
,
M. R.
,
Ali
,
M. S.
,
Islam
,
M. K.
,
Farjana
,
M.
,
Sakib
,
A. N.
,
 
Luna
,
S. A.
(
2023
).
Deep transfer learning approaches for monkeypox disease diagnosis
.
Expert Systems with Applications
,
216
, 119483. doi: .
Ahsan
,
M. M.
,
Alam
,
T. E.
,
Haque
,
M. A.
,
Ali
,
M. S.
,
Rifat
,
R. H.
,
Nafi
,
A. A. N.
,
 
Islam
,
M. K.
(
2024
).
Enhancing monkeypox diagnosis and explanation through modified transfer learning, vision transformers, and federated learning
.
Informatics in Medicine Unlocked
,
45
, 101449. doi: .
Al-Gaashani
,
M. S.
,
Xu
,
W.
, &
Obsie
,
E. Y.
(
2024
).
Mobilenetv2-based deep learning architecture with progressive transfer learning for accurate monkeypox detection
.
Applied Soft Computing
,
169
, 112553. doi: .
Albawi
,
S.
,
Bayat
,
O.
,
Al-Azawi
,
S.
, &
Ucan
,
O. N.
(
2018
).
Social touch gesture recognition using convolutional neural network
.
Computational Intelligence and Neuroscience
,
2018
(
1
), 6973103. doi: .
Ali
,
S. N.
,
Ahmed
,
M. T.
,
Jahan
,
T.
,
Paul
,
J.
,
Sani
,
S. S.
,
Noor
,
N.
,
 
Hasan
,
T.
(
2024
).
A web-based mpox skin lesion detection system using state-of-the-art deep learning models considering racial diversity
.
Biomedical Signal Processing and Control
,
98
, 106742. doi: .
Asif
,
S.
,
Zhao
,
M.
,
Tang
,
F.
,
Zhu
,
Y.
, &
Zhao
,
B.
(
2023
).
Metaheuristics optimization-based ensemble of deep neural networks for mpox disease detection
.
Neural Networks
,
167
,
342
359
. doi: .
Asif
,
S.
,
Zhao
,
M.
,
Li
,
Y.
,
Tang
,
F.
, &
Zhu
,
Y.
(
2024a
).
Cfi-net: A choquet fuzzy integral based ensemble network with pso-optimized fuzzy measures for diagnosing multiple skin diseases including mpox
.
IEEE Journal of Biomedical and Health Informatics
, Vol.
28
No.
9
, pp.
5573
-
5586
, doi: .
Asif
,
S.
,
Zhao
,
M.
,
Li
,
Y.
,
Tang
,
F.
, &
Zhu
,
Y.
(
2024b
).
Cgo-ensemble: Chaos game optimization algorithm-based fusion of deep neural networks for accurate mpox detection
.
Neural Networks
,
173
, 106183. doi: .
Bala
,
D.
,
Hossain
,
M. S.
,
Hossain
,
M. A.
,
Abdullah
,
M. I.
,
Rahman
,
M. M.
,
Manavalan
,
B.
,
 
Huang
,
Z.
(
2023
).
Monkeynet: A robust deep convolutional neural network for monkeypox disease detection and classification
.
Neural Networks
,
161
,
757
775
. doi: .
Campana
,
M. G.
,
Colussi
,
M.
,
Delmastro
,
F.
,
Mascetti
,
S.
, &
Pagani
,
E.
(
2024
).
A transfer learning and explainable solution to detect mpox from smartphones images
.
Pervasive and Mobile Computing
,
98
, 101874. doi: .
Cao
,
Y.
,
Yue
,
Y.
,
Ma
,
X.
,
Liu
,
D.
,
Ni
,
R.
,
Liang
,
H.
, &
Li
,
Z.
(
2025
).
Robustly detecting mpox and non-mpox using a deep learning framework based on image inpainting
.
Scientific Reports
,
15
(
1
),
1576
. doi: .
CDC
(
2024
).
Signs and symptoms
.
Available from:
 Link to the website
Debnath
,
J. P.
,
Hossen
,
K.
,
Sayed
,
S. B.
,
Khandaker
,
M. S.
,
Dev
,
P. C.
,
Sarker
,
S.
, &
Hossain
,
T.
(
2025
).
Identification of potential biomarkers for 2022 mpox virus infection: A transcriptomic network analysis and machine learning approach
.
Scientific Reports
,
15
(
1
),
2922
. doi: .
Gabriel
,
C. I.-O.
,
Kumar
,
R.
, &
Prasad
,
K.
(
2025
).
Deep digital twin services for personalized mpx treatment
. In
2025 17th International Conference on COMmunication Systems and NETworks (COMSNETS)
(pp. 
54
59
).
IEEE
.
Han
,
J.
,
Choi
,
B.
,
Kim
,
J. Y.
, &
Lee
,
Y.
(
2025
).
Bo-clahe enhancing neonatal chest x-ray image quality for improved lesion classification
.
Scientific Reports
,
15
(
1
),
4931
. doi: .
Ji
,
H.
,
Li
,
J.
,
Zhu
,
X.
,
Fan
,
L.
,
Jiang
,
W.
, &
Chen
,
Y.
(
2024
).
Enhancing assisted diagnostic accuracy in scalp psoriasis: A multi-network fusion object detection framework for dermoscopic pattern diagnosis
.
Skin Research and Technology
,
30
(
4
), e13698. doi: .
Karaddi
,
S. H.
,
Sharma
,
L. D.
, &
Bhattacharya
,
A.
(
2024
).
Softflatten-net: A deep convolutional neural network design for monkeypox classification from digital skin lesions images
.
IEEE Sensors Journal
, Vol.
24
No.
20
, pp.
32566
-
32576
, doi: .
Kesav
,
N.
, &
Jibukumar
,
M.
(
2022
).
Efficient and low complex architecture for detection and classification of brain tumor using rcnn with two channel cnn
.
Journal of King Saud University-Computer and Information Sciences
,
34
(
8
),
6229
6242
. doi: .
Kesav
,
N.
, &
MG
,
J.
(
2023
).
A deep learning approach with bayesian optimized kernel support vector machine for covid-19 diagnosis
.
Computer Methods in Biomechanics and Biomedical Engineering: Imaging & Visualization
,
11
(
3
),
623
637
. doi: .
Khairandish
,
M. O.
,
Sharma
,
M.
,
Jain
,
V.
,
Chatterjee
,
J. M.
, &
Jhanjhi
,
N.
(
2022
).
A hybrid cnn-svm threshold segmentation approach for tumor detection and classification of mri brain images
.
Irbm
,
43
(
4
),
290
299
. doi: .
Kumari
,
V.
, &
Ghosh
,
R.
(
2023
).
A magnification-independent method for breast cancer classification using transfer learning
.
Healthcare Analytics
,
3
, 100207. doi: .
Kundu
,
D.
,
Siddiqi
,
U. R.
, &
Rahman
,
M. M.
(
2022
).
Vision transformer based deep learning model for monkeypox detection
. In
2022 25th International Conference on Computer and Information Technology (ICCIT)
(pp. 
1021
1026
).
IEEE
.
Li
,
Z.
,
Liu
,
F.
,
Yang
,
W.
,
Peng
,
S.
, &
Zhou
,
J.
(
2021
).
A survey of convolutional neural networks: Analysis, applications, and prospects
.
IEEE Transactions on Neural Networks and Learning Systems
,
33
(
12
),
6999
7019
. doi: .
Li
,
X.
,
Zhou
,
S.
, &
Wang
,
F.
(
2025
).
A cnn-bigru sea level height prediction model combined with bayesian optimization algorithm
.
Ocean Engineering
,
315
, 119849. doi: .
Liu
,
W.
,
Zhang
,
E.
,
Li
,
W.
,
Lv
,
R.
,
Lin
,
Y.
,
Xu
,
Y.
,
 
Sun
,
Y.
(
2024a
).
Advances and challenges of mpox detection technology
.
Biosafety and Health
,
6
(
5
),
260
269
. doi: .
Liu
,
Z.
,
Jiang
,
P.
,
De Bock
,
K. W.
,
Wang
,
J.
,
Zhang
,
L.
, &
Niu
,
X.
(
2024b
).
Extreme gradient boosting trees with efficient bayesian optimization for profit-driven customer churn prediction
.
Technological Forecasting and Social Change
,
198
, 122945. doi: .
Lu
,
Q.
,
Zhang
,
H.
,
Fan
,
R.
,
Wan
,
Y.
, &
Luo
,
J.
(
2025
).
Machine learning-based bayesian optimization facilitates ultrafiltration process design for efficient protein purification
.
Separation and Purification Technology
,
363
, 132122. doi: .
Majumdar
,
S.
,
Pramanik
,
P.
, &
Sarkar
,
R.
(
2023
).
Gamma function based ensemble of cnn models for breast cancer detection in histopathology images
.
Expert Systems with Applications
,
213
, 119022. doi: .
Maqsood
,
S.
,
Damaševičius
,
R.
,
Shahid
,
S.
, &
Forkert
,
N. D.
(
2024
).
Mox-net: Multi-stage deep hybrid feature fusion and selection framework for monkeypox classification
.
Expert Systems with Applications
,
255
, 124584. doi: .
Mujahid
,
M.
,
Rustam
,
F.
,
Shafique
,
R.
,
Montero
,
E. C.
,
Alvarado
,
E. S.
,
de la Torre Diez
,
I.
, &
Ashraf
,
I.
(
2024
).
Efficient deep learning-based approach for malaria detection using red blood cell smears
.
Scientific Reports
,
14
(
1
), 13249. doi: .
Nayak
,
T.
,
Chadaga
,
K.
,
Sampathila
,
N.
,
Mayrose
,
H.
,
Gokulkrishnan
,
N.
,
Prabhu
,
S.
, &
Umakanth
,
S.
(
2023
).
Deep learning based detection of monkeypox virus using skin lesion images
.
Medicine in Novel Technology and Devices
,
18
, 100243. doi: .
Pramanik
,
R.
,
Banerjee
,
B.
,
Efimenko
,
G.
,
Kaplun
,
D.
, &
Sarkar
,
R.
(
2023
).
Monkeypox detection from skin lesion images using an amalgamation of cnn models aided with beta function-based normalization scheme
.
PLoS One
,
18
(
4
), e0281815. doi: .
Rabie
,
A. H.
, &
Saleh
,
A. I.
(
2023
).
Monkeypox diagnosis using ensemble classification
.
Artificial Intelligence in Medicine
,
143
, 102618. doi: .
Raghavendra
,
P. V.
,
Charitha
,
C.
,
Begum
,
K. G.
, &
Prasath
,
V.
(
2023
).
Deep learning–based skin lesion multi-class classification with global average pooling improvement
.
Journal of Digital Imaging
,
36
(
5
),
2227
2248
. doi: .
Raha
,
A. D.
,
Gain
,
M.
,
Debnath
,
R.
,
Adhikary
,
A.
,
Qiao
,
Y.
,
Hassan
,
M.M.
,
Bairagi
,
A.K.
, &
Islam
,
S.M.S.
(
2024
).
Attention to monkeypox: an interpretable monkeypox detection technique using attention mechanism
.
IEEE Access
,
12
,
51942
-
51965
. doi: .
Sahin
,
V. H.
,
Oztel
,
I.
, &
Yolcu Oztel
,
G.
(
2022
).
Human monkeypox classification from skin lesion images with deep pre-trained network using mobile application
.
Journal of Medical Systems
,
46
(
11
),
79
. doi: .
Saleh
,
A. I.
, &
Rabie
,
A. H.
(
2023
).
Human monkeypox diagnose (hmd) strategy based on data mining and artificial intelligence techniques
.
Computers in Biology and Medicine
,
152
, 106383. doi: .
Setegn
,
G. M.
, &
Dejene
,
B. E.
(
2025
).
Explainable ai for symptom-based detection of monkeypox: A machine learning approach
.
BMC Infectious Diseases
,
25
(
1
),
419
. doi: .
Shetty
,
B.
,
Fernandes
,
R.
,
Rodrigues
,
A. P.
,
Chengoden
,
R.
,
Bhattacharya
,
S.
, &
Lakshmanna
,
K.
(
2022
).
Skin lesion classification of dermoscopic images using machine learning and convolutional neural network
.
Scientific Reports
,
12
(
1
), 18134. doi: .
Sitaula
,
C.
, &
Shahi
,
T. B.
(
2022
).
Monkeypox virus detection using pre-trained deep learning-based approaches
.
Journal of Medical Systems
,
46
(
11
),
78
. doi: .
Thieme
,
A. H.
,
Zheng
,
Y.
,
Machiraju
,
G.
,
Sadee
,
C.
,
Mittermaier
,
M.
,
Gertler
,
M.
,
 
Gevaert
,
O.
(
2023
).
A deep-learning algorithm to classify skin lesions from mpox virus infection
.
Nature Medicine
,
29
(
3
),
738
747
. doi: .
Thornhill
,
J. P.
,
Barkati
,
S.
,
Walmsley
,
S.
,
Rockstroh
,
J.
,
Antinori
,
A.
,
Harrison
,
L. B.
,
 
Orkin
,
C. M.
(
2022
).
Monkeypox virus infection in humans across 16 countries—april–june 2022
.
New England Journal of Medicine
,
387
(
8
),
679
691
. doi: .
Usman
,
S.
,
Adamu
,
I. I.
, et al.
(
2017
).
Modeling the transmission dynamics of the monkeypox virus infection with treatment and vaccination interventions
.
Journal of Applied Mathematics and Physics
,
5
(
12
),
2335
.
Weintraub
,
K.
(
2025
).
Is there mpox in nc? What to know about monkeypox cases from ncdhhs
.
USA Today. Available from:
 Link to the website (
accessed
 2 May 2025).
World Health Organization
(
2024
).
Mpox outbreak
.
Available from:
 Link to the website (
accessed
 2 May 2025).
Yadav
,
S.
, &
Qidwai
,
T.
(
2024
).
Machine learning-based monkeypox virus image prognosis with feature selection and advanced statistical loss function
.
Medicine in Microecology
,
19
, 100098. doi: .
Yang
,
K.
,
Liu
,
L.
, &
Wen
,
Y.
(
2024
).
The impact of bayesian optimization on feature selection
.
Scientific Reports
,
14
(
1
),
3948
. doi: .
Yogalakshmi
,
G.
, &
Rani
,
B. S.
(
2024
).
Sailfish optimizer based clahe with u-net for mri brain tumour segmentation
.
Measurement: Sensors
,
33
, 101229. doi: .
Yoshimi
,
Y.
,
Mine
,
Y.
,
Ito
,
S.
,
Takeda
,
S.
,
Okazaki
,
S.
,
Nakamoto
,
T.
,
 
Tanimoto
,
K.
(
2024
).
Image preprocessing with contrast-limited adaptive histogram equalization improves the segmentation performance of deep learning for the articular disk of the temporomandibular joint on magnetic resonance images
.
Oral Surgery, Oral Medicine, Oral Pathology and Oral Radiology
,
138
(
1
),
128
141
. doi: .
Yousaf
,
M. Z.
,
Singh
,
A. R.
,
Khalid
,
S.
,
Bajaj
,
M.
,
Kumar
,
B. H.
, &
Zaitsev
,
I.
(
2024
).
Enhancing hvdc transmission line fault detection using disjoint bagging and bayesian optimization with artificial neural networks and scientometric insights
.
Scientific Reports
,
14
(
1
), 23610. doi: .
Zhang
,
J.
,
Zhou
,
H.
,
Niu
,
Y.
,
Lv
,
J.
,
Chen
,
J.
, &
Cheng
,
Y.
(
2021
).
Cnn and multi-feature extraction based denoising of ct images
.
Biomedical Signal Processing and Control
,
67
, 102545. doi: .
Zuiderveld
,
K.
(
1994
).
Contrast-limited adaptive histogram equalization
.
Graphics Gems
,
IV
,
474
485
.
Published in Digital Transformation and Society. Published by Emerald Publishing Limited. This article is published under the Creative Commons Attribution (CC BY 4.0) licence. Anyone may reproduce, distribute, translate and create derivative works of this article (for both commercial and non-commercial purposes), subject to full attribution to the original publication and authors. The full terms of this licence may be seen at Link to the terms of the CC BY 4.0 licence.

Data & Figures

Figure 1
A flowchart shows a 3-layer pipeline for dataset collection, preprocessing, and model training and evaluation.The diagram is a three-layer workflow divided horizontally by dotted lines and labeled on the left as “Layer 1”, “Layer 2”, and “Layer 3”. Layer 1, at the bottom, shows a dataset acquisition diagram inside a rounded orange rectangle. At the center is an icon labeled “Dataset” with a server-and-gear symbol. Four arrows point inward toward the dataset from four surrounding sources. At the upper left, “S N 1” is shown with a cloud and device image. At the upper right, “S N 2” is shown with a database cylinder and a document icon. At the lower right, “S N 3” is shown with a stacked-layer device icon. At the lower left, “S N 4” is shown with a globe network icon. All four sources connect directly to the central dataset through arrows. Layer 2, in the middle, illustrates the processing pipeline. On the left, a dashed box titled “Preprocessing” lists three steps: “CLAHE to enhance local contrast for better feature visibility”, “Resize the image size for the model input”, and “Normalization using Image Net mean and std”. An arrow leads to a central module labeled “Proposed L D S C N N”, showing a neural network diagram with an input layer, hidden layers (1 to ellipsis to N), and an output layer, and a caption reading “Lightweight Depthwise Separable C N N for Feature Extraction”. Another arrow leads to a right module titled “Normalize and Split”. Inside it are three small boxes aligned horizontally labeled “Training”, “Validation”, and “Testing”, each with a small triangle marker below, and a larger box underneath labeled “Normalize extracted features”. Layer 3, at the top, shows a pipeline as a left-to-right flowchart enclosed in a rounded orange border with dashed inner boxes. The first module shows three brain-like icons and is labeled “Training model”. A right-pointing arrow leads to the second module labeled “Hyperparameter optimization”, shown with a large pink icon containing a brain, gear, and cloud. A right-pointing arrow then leads to a vertical multicolored stacked bar bracketed and labeled “Output”. Another arrow points to the final module labeled “Model Evaluation:”, listing evaluation metrics “Precision, Recall, F 1 score, R O C-A U C”.

Proposed architecture for LDSCNN-ABBLM framework

Figure 1
A flowchart shows a 3-layer pipeline for dataset collection, preprocessing, and model training and evaluation.The diagram is a three-layer workflow divided horizontally by dotted lines and labeled on the left as “Layer 1”, “Layer 2”, and “Layer 3”. Layer 1, at the bottom, shows a dataset acquisition diagram inside a rounded orange rectangle. At the center is an icon labeled “Dataset” with a server-and-gear symbol. Four arrows point inward toward the dataset from four surrounding sources. At the upper left, “S N 1” is shown with a cloud and device image. At the upper right, “S N 2” is shown with a database cylinder and a document icon. At the lower right, “S N 3” is shown with a stacked-layer device icon. At the lower left, “S N 4” is shown with a globe network icon. All four sources connect directly to the central dataset through arrows. Layer 2, in the middle, illustrates the processing pipeline. On the left, a dashed box titled “Preprocessing” lists three steps: “CLAHE to enhance local contrast for better feature visibility”, “Resize the image size for the model input”, and “Normalization using Image Net mean and std”. An arrow leads to a central module labeled “Proposed L D S C N N”, showing a neural network diagram with an input layer, hidden layers (1 to ellipsis to N), and an output layer, and a caption reading “Lightweight Depthwise Separable C N N for Feature Extraction”. Another arrow leads to a right module titled “Normalize and Split”. Inside it are three small boxes aligned horizontally labeled “Training”, “Validation”, and “Testing”, each with a small triangle marker below, and a larger box underneath labeled “Normalize extracted features”. Layer 3, at the top, shows a pipeline as a left-to-right flowchart enclosed in a rounded orange border with dashed inner boxes. The first module shows three brain-like icons and is labeled “Training model”. A right-pointing arrow leads to the second module labeled “Hyperparameter optimization”, shown with a large pink icon containing a brain, gear, and cloud. A right-pointing arrow then leads to a vertical multicolored stacked bar bracketed and labeled “Output”. Another arrow points to the final module labeled “Model Evaluation:”, listing evaluation metrics “Precision, Recall, F 1 score, R O C-A U C”.

Proposed architecture for LDSCNN-ABBLM framework

Close modal
Figure 2
A diagram shows depthwise separable convolution and pointwise convolution extracting 1280 features from preprocessed images.The figure is a left-to-right C N N architecture diagram illustrating feature extraction using depthwise separable convolution followed by pointwise convolution. On the far left, four small skin-related example images are grouped under the label “Preprosed images” and point via an arrow to a stack of three colored feature-map layers. From this stack, three parallel paths branch upward, middle, and downward into depthwise separable convolution operations. The upper path shows a single green feature map passing through a block labeled “Depthwise Separable Conv”. The middle path shows a red feature map passing through a block labeled “D subscript k by D subscript k Conv”. The lower path, followed by ellipsis, shows a blue feature map passing through another depthwise convolution block. The outputs of these depthwise operations are shown as gray feature-map blocks, which then merge into a combined stack of three gray layers. An arrow leads to the next stage labeled “Pointwise Conv” with “1 by 1 Conv”, producing another stack of gray feature maps. The final arrow points to a vertical feature vector illustration on the right, enclosed in a dotted rectangle and labeled “1,280 extracted features”, indicating the size of the extracted feature representation.

A proposed lightweight depthwise separable CNN (LDSCNN) architecture for efficient feature extraction from dermatological images

Figure 2
A diagram shows depthwise separable convolution and pointwise convolution extracting 1280 features from preprocessed images.The figure is a left-to-right C N N architecture diagram illustrating feature extraction using depthwise separable convolution followed by pointwise convolution. On the far left, four small skin-related example images are grouped under the label “Preprosed images” and point via an arrow to a stack of three colored feature-map layers. From this stack, three parallel paths branch upward, middle, and downward into depthwise separable convolution operations. The upper path shows a single green feature map passing through a block labeled “Depthwise Separable Conv”. The middle path shows a red feature map passing through a block labeled “D subscript k by D subscript k Conv”. The lower path, followed by ellipsis, shows a blue feature map passing through another depthwise convolution block. The outputs of these depthwise operations are shown as gray feature-map blocks, which then merge into a combined stack of three gray layers. An arrow leads to the next stage labeled “Pointwise Conv” with “1 by 1 Conv”, producing another stack of gray feature maps. The final arrow points to a vertical feature vector illustration on the right, enclosed in a dotted rectangle and labeled “1,280 extracted features”, indicating the size of the extracted feature representation.

A proposed lightweight depthwise separable CNN (LDSCNN) architecture for efficient feature extraction from dermatological images

Close modal
Figure 3
A multi-panel figure shows confusion matrices for five cross-validation folds and a test set across four skin classes.The figure contains six confusion matrix heatmaps arranged in two rows of three panels, labeled (a) through (f): “(a) Fold 1”, “(b) Fold 2”, “(c) Fold 3”, “(d) Fold 4”, “(e) Fold 5”, and “(f) Test set”. Each heatmap has the horizontal axis labeled “Predicted” and the vertical axis labeled “Actual”, with four class labels on both axes: “Acne”, “Chickenpox”, “Monkeypox”, and “Normal”, from top to bottom on the vertical axis and from left to right on the horizontal axis. Each matrix includes a vertical color bar to the right showing count intensity, with larger values displayed as darker squares. The color bars for five folds range from 0 to 120 with an interval of 20, while for the test set, it ranges from 0.0 to 20.0 with an interval of 2.5. The data from the rows for each heatmap are as follows: Fold 1 values by row are: Actual Acne: 130, 2, 0, 0; Actual Chickenpox: 1, 129, 1, 0; Actual Monkeypox: 0, 0, 130, 1; Actual Normal: 0, 0, 0, 131. Fold 2 values are Acne: 131, 0, 0, 0; Chickenpox: 0, 132, 0, 0; Monkeypox: 0, 3, 126, 2; Normal: 0, 0, 0, 131. Fold 3 values are Acne: 131, 0, 0, 0; Chickenpox: 1, 128, 0, 2; Monkeypox: 0, 0, 131, 1; Normal: 1, 0, 0, 130. Fold 4 values are Acne: 130, 1, 0, 0; Chickenpox: 3, 127, 0, 1; Monkeypox: 0, 0, 130, 1; Normal: 0, 1, 0, 131. Fold 5 values are: Acne: 128, 2, 1, 0; Chickenpox: 0, 130, 1, 0; Monkeypox: 0, 1, 130, 0; Normal: 0, 1, 0, 130. The test set confusion matrix values are Acne: 15, 5, 0, 0; Chickenpox: 4, 13, 3, 0; Monkeypox: 0, 1, 18, 1; Normal: 0, 0, 0, 20.

Confusion matrices of the proposed model over five folds and the test set on the MCSI dataset, demonstrating robust and consistent performance

Figure 3
A multi-panel figure shows confusion matrices for five cross-validation folds and a test set across four skin classes.The figure contains six confusion matrix heatmaps arranged in two rows of three panels, labeled (a) through (f): “(a) Fold 1”, “(b) Fold 2”, “(c) Fold 3”, “(d) Fold 4”, “(e) Fold 5”, and “(f) Test set”. Each heatmap has the horizontal axis labeled “Predicted” and the vertical axis labeled “Actual”, with four class labels on both axes: “Acne”, “Chickenpox”, “Monkeypox”, and “Normal”, from top to bottom on the vertical axis and from left to right on the horizontal axis. Each matrix includes a vertical color bar to the right showing count intensity, with larger values displayed as darker squares. The color bars for five folds range from 0 to 120 with an interval of 20, while for the test set, it ranges from 0.0 to 20.0 with an interval of 2.5. The data from the rows for each heatmap are as follows: Fold 1 values by row are: Actual Acne: 130, 2, 0, 0; Actual Chickenpox: 1, 129, 1, 0; Actual Monkeypox: 0, 0, 130, 1; Actual Normal: 0, 0, 0, 131. Fold 2 values are Acne: 131, 0, 0, 0; Chickenpox: 0, 132, 0, 0; Monkeypox: 0, 3, 126, 2; Normal: 0, 0, 0, 131. Fold 3 values are Acne: 131, 0, 0, 0; Chickenpox: 1, 128, 0, 2; Monkeypox: 0, 0, 131, 1; Normal: 1, 0, 0, 130. Fold 4 values are Acne: 130, 1, 0, 0; Chickenpox: 3, 127, 0, 1; Monkeypox: 0, 0, 130, 1; Normal: 0, 1, 0, 131. Fold 5 values are: Acne: 128, 2, 1, 0; Chickenpox: 0, 130, 1, 0; Monkeypox: 0, 1, 130, 0; Normal: 0, 1, 0, 130. The test set confusion matrix values are Acne: 15, 5, 0, 0; Chickenpox: 4, 13, 3, 0; Monkeypox: 0, 1, 18, 1; Normal: 0, 0, 0, 20.

Confusion matrices of the proposed model over five folds and the test set on the MCSI dataset, demonstrating robust and consistent performance

Close modal
Figure 4
A multi-panel figure shows confusion matrices for five folds and a test set across six skin disease classes.The figure contains six confusion matrix heatmaps arranged in two rows of three panels, labeled “(a) Fold 1”, “(b) Fold 2”, “(c) Fold 3”, “(d) Fold 4”, “(e) Fold 5”, and “(f) Test set”. Each heatmap has the horizontal axis labeled “Predicted” and the vertical axis labeled “Actual”. Both axes list six classes: “Chickenpox”, “Cowpox”, “H F M D”, “Healthy”, “Measles”, and “Monkeypox”, from top to bottom on the vertical axis and from left to right on the horizontal axis. Each matrix includes a vertical color bar at the right indicating count intensity, where darker shades represent higher values. The color bars for five folds range from 0 to 300 with an interval of 50, while for the test set, it ranges from 0 to 35 with an interval of 5. The data from the rows for each heatmap are as follows: Fold 1 values by row are Actual Chickenpox: 86, 0, 0, 0, 0, 0; Actual Cowpox: 0, 72, 0, 0, 0, 3; Actual H F M D: 0, 0, 183, 0, 0, 1; Actual Healthy: 1, 0, 0, 128, 0, 1; Actual Measles: 1, 0, 0, 1, 60, 1; Actual Monkeypox: 0, 1, 0, 0, 0, 324. Fold 2 values are Chickenpox: 84, 0, 0, 0, 0, 2; Cowpox: 0, 72, 0, 0, 0, 3; H F M D: 0, 0, 184, 0, 0, 0; Healthy: 0, 0, 0, 128, 0, 2; Measles: 0, 0, 0, 0, 61, 1; Monkeypox: 2, 0, 3, 0, 0, 321. Fold 3 values are Chickenpox: 84, 0, 0, 0, 0, 1; Cowpox: 2, 72, 1, 0, 0, 1; H F M D: 0, 0, 182, 0, 0, 2; Healthy: 1, 0, 0, 126, 0, 3; Measles: 0, 0, 0, 0, 60, 2; Monkeypox: 4, 0, 1, 0, 0, 321. Fold 4 values are Chickenpox: 82, 0, 1, 0, 0, 2; Cowpox: 0, 73, 0, 0, 0, 3; H F M D: 0, 0, 183, 0, 0, 1; Healthy: 0, 0, 0, 127, 1, 2; Measles: 0, 0, 0, 0, 62, 0; Monkeypox: 3, 0, 2, 0, 1, 319. Fold 5 values are Chickenpox: 82, 0, 0, 1, 0, 2; Cowpox: 1, 73, 1, 0, 0, 1; H F M D: 0, 0, 181, 1, 0, 2; Healthy: 0, 0, 2, 125, 1, 1; Measles: 0, 0, 2, 0, 61, 0; Monkeypox: 0, 0, 2, 0, 0, 323. The test set matrix values are Chickenpox: 9, 0, 1, 0, 0, 2; Cowpox: 1, 5, 0, 0, 0, 4; H F M D: 0, 0, 22, 1, 0, 2; Healthy: 0, 0, 1, 15, 0, 2; Measles: 0, 0, 0, 0, 6, 3; Monkeypox: 2, 0, 1, 1, 0, 39.

Confusion matrices of the proposed model over five folds and the test set on the MSLD v2 dataset, demonstrating robust and consistent performance

Figure 4
A multi-panel figure shows confusion matrices for five folds and a test set across six skin disease classes.The figure contains six confusion matrix heatmaps arranged in two rows of three panels, labeled “(a) Fold 1”, “(b) Fold 2”, “(c) Fold 3”, “(d) Fold 4”, “(e) Fold 5”, and “(f) Test set”. Each heatmap has the horizontal axis labeled “Predicted” and the vertical axis labeled “Actual”. Both axes list six classes: “Chickenpox”, “Cowpox”, “H F M D”, “Healthy”, “Measles”, and “Monkeypox”, from top to bottom on the vertical axis and from left to right on the horizontal axis. Each matrix includes a vertical color bar at the right indicating count intensity, where darker shades represent higher values. The color bars for five folds range from 0 to 300 with an interval of 50, while for the test set, it ranges from 0 to 35 with an interval of 5. The data from the rows for each heatmap are as follows: Fold 1 values by row are Actual Chickenpox: 86, 0, 0, 0, 0, 0; Actual Cowpox: 0, 72, 0, 0, 0, 3; Actual H F M D: 0, 0, 183, 0, 0, 1; Actual Healthy: 1, 0, 0, 128, 0, 1; Actual Measles: 1, 0, 0, 1, 60, 1; Actual Monkeypox: 0, 1, 0, 0, 0, 324. Fold 2 values are Chickenpox: 84, 0, 0, 0, 0, 2; Cowpox: 0, 72, 0, 0, 0, 3; H F M D: 0, 0, 184, 0, 0, 0; Healthy: 0, 0, 0, 128, 0, 2; Measles: 0, 0, 0, 0, 61, 1; Monkeypox: 2, 0, 3, 0, 0, 321. Fold 3 values are Chickenpox: 84, 0, 0, 0, 0, 1; Cowpox: 2, 72, 1, 0, 0, 1; H F M D: 0, 0, 182, 0, 0, 2; Healthy: 1, 0, 0, 126, 0, 3; Measles: 0, 0, 0, 0, 60, 2; Monkeypox: 4, 0, 1, 0, 0, 321. Fold 4 values are Chickenpox: 82, 0, 1, 0, 0, 2; Cowpox: 0, 73, 0, 0, 0, 3; H F M D: 0, 0, 183, 0, 0, 1; Healthy: 0, 0, 0, 127, 1, 2; Measles: 0, 0, 0, 0, 62, 0; Monkeypox: 3, 0, 2, 0, 1, 319. Fold 5 values are Chickenpox: 82, 0, 0, 1, 0, 2; Cowpox: 1, 73, 1, 0, 0, 1; H F M D: 0, 0, 181, 1, 0, 2; Healthy: 0, 0, 2, 125, 1, 1; Measles: 0, 0, 2, 0, 61, 0; Monkeypox: 0, 0, 2, 0, 0, 323. The test set matrix values are Chickenpox: 9, 0, 1, 0, 0, 2; Cowpox: 1, 5, 0, 0, 0, 4; H F M D: 0, 0, 22, 1, 0, 2; Healthy: 0, 0, 1, 15, 0, 2; Measles: 0, 0, 0, 0, 6, 3; Monkeypox: 2, 0, 1, 1, 0, 39.

Confusion matrices of the proposed model over five folds and the test set on the MSLD v2 dataset, demonstrating robust and consistent performance

Close modal
Figure 5
A two-panel graph shows R O C curves for skin disease classification on the M C S I and M S L D underscore V 2 datasets.The figure contains two side-by-side ROC plots labeled “(a) R O C curve on M C S I dataset” and “(b) R O C curve on M S L D underscore V 2 dataset”. In both panels, the horizontal axis is labeled “False Positive Rate” and ranges from 0.0 to 1.0 in increments of 0.2. The vertical axis is labeled “True Positive Rate” and ranges from 0.0 to 1.0 in increments of 0.2. Each plot includes a dashed diagonal reference line from (0.0, 0.0) to (1.0, 1.0). Panel (a) shows four R O C curves with a legend listing A U C values: “Acne (A U C equals 0.96)”, “Chickenpox (A U C equals 0.87)”, “Monkeypox (A U C equals 0.96)”, and “Normal (A U C equals 0.99)”. The “Normal” curve rises vertically from (0, 0) to about (0, 1.0) and then runs along the top border near a true positive rate of 1.0. The “Monkeypox” curve rises quickly at low false positive rates, reaching about a 0.85–0.9 true positive rate near a false positive rate below 0.05, then increases to 1.0 by around a false positive rate of about 0.3. The “Acne” curve increases in several steps, starting near a true positive rate of about 0.4 at a false positive rate near 0.02, reaching about 0.8 near 0.06, and reaching 1.0 by around a false positive rate of about 0.2. The “Chickenpox” curve rises more gradually, with multiple steps from about a 0.5 true positive rate near a false positive rate around 0.02, reaching about 0.8 near 0.3, and approaching 1.0 by around a false positive rate near 0.6. Panel (b) shows six R O C curves with legend entries: “Chickenpox (A U C equals 0.93)”, “Cowpox (A U C equals 0.98)”, “H F M D (A U C equals 0.99)”, “Healthy (A U C equals 0.99)”, “Measles (A U C equals 0.88)”, and “Monkeypox (A U C equals 0.92)”. The “Healthy” curve rises steeply to near the top-left corner, reaching about a true positive rate of 0.9 at a false positive rate below 0.05, then reaches 1.0 by roughly a false positive rate near 0.1 and stays along the top border. The “H F M D” curve also rises quickly, reaching about 0.9 true positive rate at a false positive rate below 0.05 and approaching 1.0 by around 0.1. The “Cowpox” curve increases sharply at low false positive rates, reaching roughly 0.9 by about 0.05 and nearing 1.0 by around 0.1–0.15. The “Chickenpox” curve rises in larger steps, reaching about 0.75 at a false positive rate near 0.02, about 0.9 around 0.15–0.2, and reaching 1.0 by roughly 0.35. The “Measles” curve rises early to about 0.65–0.7 near a false positive rate close to 0.02, then stays around 0.88–0.9 across much of the plot before rising to 1.0 near the far right edge. The “Monkeypox” curve rises from low false positive rates to about 0.65 near 0.05, then increases to about 0.9 near 0.1, and remains high (around 0.95) through most of the plot before reaching 1.0 close to a false positive rate near 0.8–0.85. Note: All the numerical data values are approximated.

Test set ROC curves of the proposed model on both datasets, demonstrating strong performance across all classes

Figure 5
A two-panel graph shows R O C curves for skin disease classification on the M C S I and M S L D underscore V 2 datasets.The figure contains two side-by-side ROC plots labeled “(a) R O C curve on M C S I dataset” and “(b) R O C curve on M S L D underscore V 2 dataset”. In both panels, the horizontal axis is labeled “False Positive Rate” and ranges from 0.0 to 1.0 in increments of 0.2. The vertical axis is labeled “True Positive Rate” and ranges from 0.0 to 1.0 in increments of 0.2. Each plot includes a dashed diagonal reference line from (0.0, 0.0) to (1.0, 1.0). Panel (a) shows four R O C curves with a legend listing A U C values: “Acne (A U C equals 0.96)”, “Chickenpox (A U C equals 0.87)”, “Monkeypox (A U C equals 0.96)”, and “Normal (A U C equals 0.99)”. The “Normal” curve rises vertically from (0, 0) to about (0, 1.0) and then runs along the top border near a true positive rate of 1.0. The “Monkeypox” curve rises quickly at low false positive rates, reaching about a 0.85–0.9 true positive rate near a false positive rate below 0.05, then increases to 1.0 by around a false positive rate of about 0.3. The “Acne” curve increases in several steps, starting near a true positive rate of about 0.4 at a false positive rate near 0.02, reaching about 0.8 near 0.06, and reaching 1.0 by around a false positive rate of about 0.2. The “Chickenpox” curve rises more gradually, with multiple steps from about a 0.5 true positive rate near a false positive rate around 0.02, reaching about 0.8 near 0.3, and approaching 1.0 by around a false positive rate near 0.6. Panel (b) shows six R O C curves with legend entries: “Chickenpox (A U C equals 0.93)”, “Cowpox (A U C equals 0.98)”, “H F M D (A U C equals 0.99)”, “Healthy (A U C equals 0.99)”, “Measles (A U C equals 0.88)”, and “Monkeypox (A U C equals 0.92)”. The “Healthy” curve rises steeply to near the top-left corner, reaching about a true positive rate of 0.9 at a false positive rate below 0.05, then reaches 1.0 by roughly a false positive rate near 0.1 and stays along the top border. The “H F M D” curve also rises quickly, reaching about 0.9 true positive rate at a false positive rate below 0.05 and approaching 1.0 by around 0.1. The “Cowpox” curve increases sharply at low false positive rates, reaching roughly 0.9 by about 0.05 and nearing 1.0 by around 0.1–0.15. The “Chickenpox” curve rises in larger steps, reaching about 0.75 at a false positive rate near 0.02, about 0.9 around 0.15–0.2, and reaching 1.0 by roughly 0.35. The “Measles” curve rises early to about 0.65–0.7 near a false positive rate close to 0.02, then stays around 0.88–0.9 across much of the plot before rising to 1.0 near the far right edge. The “Monkeypox” curve rises from low false positive rates to about 0.65 near 0.05, then increases to about 0.9 near 0.1, and remains high (around 0.95) through most of the plot before reaching 1.0 close to a false positive rate near 0.8–0.85. Note: All the numerical data values are approximated.

Test set ROC curves of the proposed model on both datasets, demonstrating strong performance across all classes

Close modal
Figure 6
A figure shows hyperparameter importance bar charts and optimization history plots for “M C S I” and “M S L D v 2”.The figure contains two rows and two columns of plots labeled (a) through (d), comparing hyperparameter importance and optimization history for two datasets: “M C S I” and “M S L D v 2”. Panel (a), “Param importance (M C S I)” (left, top row): A horizontal bar chart titled “Hyperparameter Importances”. The horizontal axis is labeled “Hyperparameter Importance” and runs from 0.0 to about 0.6 with an interval of 0.1. The vertical axis is labeled “Hyperparameter” and lists four parameters: “kernel”, “C”, “degree”, and “gamma”. The bars show kernel: 0.60 (longest bar), C: 0.20, degree: 0.11, and gamma: 0.08. Panel (b), “Opt history (M C S I)” (right, top row): A scatter-and-line plot titled “Optimization History Plot”. The horizontal axis is labeled “Trial” and runs from 0 to 14 with an interval of 2. The vertical axis is labeled “Objective Value” and ranges from 0.7 to 1 with an interval of 0.05. Circular data points labeled “Objective Value” are plotted across trials, and a line labeled “Best Value” tracks the best value so far. The best-value line jumps from about 0.76 at trial 0 to about 0.98 at trial 1, then remains near 0.98 with a small increase to about 0.99 around trial 11, staying flat through trial 14. Most blue points lie between about 0.97 and 0.99, with two noticeable low outliers near trial 9 (around 0.70) and trial 10 (around 0.78). Panel (c), “Param importance (M S L D v 2)” (left, bottom row): A horizontal bar chart titled “Hyperparameter Importances”. The horizontal axis is labeled “Hyperparameter Importance” and runs from 0.0 to about 0.7 with an interval of 0.1. The vertical axis is labeled “Hyperparameter” with the same four parameters: “kernel”, “C”, “degree”, and “gamma”. The bars show kernel: 0.73 (longest bar), C: 0.15, degree: 0.06, and gamma: 0.06. Panel (d), “Opt history (M S L D v 2)” (right, bottom row): A scatter-and-line plot titled “Optimization History Plot”. The horizontal axis is labeled “Trial” and runs from 0 to 14 with an interval of 2. The vertical axis is labeled “Objective Value” and ranges from near 0.2 to 1 with an interval of 0.2. Circular data points labeled “Objective Value” appear across trials, and a “Best Value” line shows the best value so far. The best-value line starts near 0.93 at trial 0, rises to about 0.99 at trial 1, and stays flat close to 0.99 through trial 14. Most objective-value points lie between about 0.85 and 1.0, with two very low outliers around trials 2 and 4 near 0.08 and a lower point around trial 14 near 0.83. Note: All the numerical data values are approximated.

Hyperparameter tuning results for both datasets showing parameter importance and optimization progress

Figure 6
A figure shows hyperparameter importance bar charts and optimization history plots for “M C S I” and “M S L D v 2”.The figure contains two rows and two columns of plots labeled (a) through (d), comparing hyperparameter importance and optimization history for two datasets: “M C S I” and “M S L D v 2”. Panel (a), “Param importance (M C S I)” (left, top row): A horizontal bar chart titled “Hyperparameter Importances”. The horizontal axis is labeled “Hyperparameter Importance” and runs from 0.0 to about 0.6 with an interval of 0.1. The vertical axis is labeled “Hyperparameter” and lists four parameters: “kernel”, “C”, “degree”, and “gamma”. The bars show kernel: 0.60 (longest bar), C: 0.20, degree: 0.11, and gamma: 0.08. Panel (b), “Opt history (M C S I)” (right, top row): A scatter-and-line plot titled “Optimization History Plot”. The horizontal axis is labeled “Trial” and runs from 0 to 14 with an interval of 2. The vertical axis is labeled “Objective Value” and ranges from 0.7 to 1 with an interval of 0.05. Circular data points labeled “Objective Value” are plotted across trials, and a line labeled “Best Value” tracks the best value so far. The best-value line jumps from about 0.76 at trial 0 to about 0.98 at trial 1, then remains near 0.98 with a small increase to about 0.99 around trial 11, staying flat through trial 14. Most blue points lie between about 0.97 and 0.99, with two noticeable low outliers near trial 9 (around 0.70) and trial 10 (around 0.78). Panel (c), “Param importance (M S L D v 2)” (left, bottom row): A horizontal bar chart titled “Hyperparameter Importances”. The horizontal axis is labeled “Hyperparameter Importance” and runs from 0.0 to about 0.7 with an interval of 0.1. The vertical axis is labeled “Hyperparameter” with the same four parameters: “kernel”, “C”, “degree”, and “gamma”. The bars show kernel: 0.73 (longest bar), C: 0.15, degree: 0.06, and gamma: 0.06. Panel (d), “Opt history (M S L D v 2)” (right, bottom row): A scatter-and-line plot titled “Optimization History Plot”. The horizontal axis is labeled “Trial” and runs from 0 to 14 with an interval of 2. The vertical axis is labeled “Objective Value” and ranges from near 0.2 to 1 with an interval of 0.2. Circular data points labeled “Objective Value” appear across trials, and a “Best Value” line shows the best value so far. The best-value line starts near 0.93 at trial 0, rises to about 0.99 at trial 1, and stays flat close to 0.99 through trial 14. Most objective-value points lie between about 0.85 and 1.0, with two very low outliers around trials 2 and 4 near 0.08 and a lower point around trial 14 near 0.83. Note: All the numerical data values are approximated.

Hyperparameter tuning results for both datasets showing parameter importance and optimization progress

Close modal
Table 1

Comparative analysis of existing methods in Mpox prediction and their challenges

Related workYearDatasetClassificationAlgorithmContributionUnaddressed challenges/Reasons for limitation
Campana, Colussi, Delmastro, Mascetti, and Pagani (2024) 2024MCSIMulticlassMobileNetV3Introduced new dataset of skin images (lesion/non-lesion) for Mpox detectionLimited optimization for edge deployment and latency-sensitive applications
Ahsan et al. (2024) 2024MDS22MulticlassM-ResNet50Investigated Mpox diagnosis using CNN with transfer and federated learningInsufficient labeling diversity and class ambiguity hinder generalization
Ahsan et al. (2023) 2023MDS22MulticlassXceptionApplied GRA-TLA for optimization and CNN enhancementInability to capture fine-grained lesion variations and spatial dependencies
Bala et al. (2023) 2023MSIDMulticlassM-DenseNet201Proposed MonkeyNet for Mpox image classificationFailure to emphasize discriminative lesion regions reduces precision
Nayak et al. (2023) 2023MSLDBinaryM-ResNet18Detection of Mpox lesions using deep learningPoor performance under racial and illumination variations
Rabie and Saleh (2023) 2023MPX-Data, MPPDMulticlass/BinarySNB, LKNN, DLCEnsemble classification for integrated AMDS Mpox systemLack of deep or hybrid ensemble models limits robustness
Saleh and Rabie (2023) 2023MPX-DataBinaryIBCO, WNB, WKNN, LSTMHuman Mpox classification using hybrid traditional methodsNon-scalable for mobile or real-time deployment
Sahin, Oztel, and Yolcu Oztel (2022) 2022MSLDBinaryMobileNetV2Human Mpox classification with transfer learningFails to benchmark against state-of-the-art CNNs or transformers
Sitaula and Shahi (2022) 2022MDS22MulticlassComparative DL modelsCompared multiple pre-trained models for MpoxInefficient inference and high computational demand
Thieme et al. (2023) 2023MPXVBinaryCNNBinary Mpox detection using CNNsSimple CNN backbone limits adaptability to diverse lesion types
Yadav and Qidwai (2024) 2024MSLDBinaryM-ResNet50 + MXGBoostRN-50-ZCA model enhances feature extractionLack of regularization and dataset diversity causing overfitting
Asif, Zhao, Tang, Zhu, and Zhao (2023) 2023MSLDBinaryDenseNet201, MobileNet, DenseNet169MO-WAE model integrating metaheuristic optimizationUnbalanced data distribution affects reproducibility and model stability

Note(s): MCSI: Mpox Close Skin Images; MDS22: Monkeypoxdataset-2022; MPXV: Monkeypox Virus; MPX-Data: Monkeypox-Data; MSLD: Monkeypox Skin Lesion Dataset; MSID: Monkeypox Skin Images Dataset; M-DenseNet201: Modified DenseNet-201; M-ResNet18: Modified ResNet-18; M-XGBoost: Modified XGBoost; M-ResNet50: Modified ResNet50; CNN: Convolutional Neural Network; LSTM: Long Short-Term Memory; WKNN: Weighted K-Nearest Neighbors; WNB: Weighted Naïve Bayes; IBCO: Improved Binary Chimp Optimization; AMDS: Accurate Monkeypox Diagnosing Strategy; LKNN: Layered K-Nearest Neighbors; DLC: Deep Learning Classifier; GRA-TLA: Generalization and Regularization-based Transfer Learning; MO-WAE: Metaheuristic-Optimization-based Weighted Average Ensemble; RN-50-ZCA: Residual Network-50-Zero Phase Component Analysis

Table 2

Performance metrics used to evaluate the proposed model’s performance

Performance measureFormulaEquation
AccuracyTp+TnTp+Tn+Fp+Fn(1)
PrecisionTpTp+Fp(2)
RecallTpTp+Fn(3)
F1-Score2×Precision×RecallPrecision+Recall(4)
Table 3

5-fold cross-validation results with 95% confidence intervals and inference time on MSCI dataset

ModelAccPreRecF1 − scoreAv. IT (ms/image)
W-Random Forest0.9539(0.9445–0.9632)0.9543(0.9452–0.9634)0.9539(0.9445–0.9632)0.9538(0.9444–0.9632)0.3061
W-L-SVM0.9779(0.9650–0.9908)0.9782(0.9654–0.9909)0.9779(0.9640–0.9908)0.9778(0.9649–0.9908)0.0554
W-LightGBM0.9691(0.9579–0.9804)0.9694(0.9583–0.9805)0.9691(0.9579–0.9804)0.9690(0.9577–0.9804)0.1291
W-extra Trees0.9524(0.9367–0.9680)0.9527(0.9375–0.9680)0.9524(0.9367–0.9680)0.9523(0.9366–0.9680)0.8191
W-XGBoost0.9425(0.9225–0.9625)0.9428(0.9229–0.9626)0.9424(0.9225–0.9625)0.9423(0.9222–0.9625)0.0190
Proposed0.9893(0.9872–0.9914)0.9894(0.9873–0.9916)0.9893(0.9872–0.9914)0.9893(0.9872–0.9914)1.3966

Note(s): Acc–Accuracy, Pre–Precision, Rec–Recall, Av. IT–Average Inference Time

Table 4

5-fold cross-validation results with 95% confidence intervals and inference time on MSLD v2

ModelAccPreRecF1 − scoreAv. IT (ms/image)
W-Random Forest0.9089(0.9032–0.9146)0.9137(0.9092–0.9181)0.9089(0.9032–0.9146)0.9081(0.9022–0.9140)0.3444
W-L-SVM0.9592(0.9472–0.9712)0.9595(0.9475–0.9715)0.9592(0.9472–0.9712)0.9592(0.9472–0.9712)0.0406
W-LightGBM0.9511(0.9417–0.9604)0.9515(0.9422–0.9608)0.9511(0.9417–0.9604)0.9510(0.9416–0.9604)0.3370
W-Extra Trees0.9325(0.9217–0.9433)0.9341(0.9241–0.9441)0.9325(0.9217–0.9433)0.9325(0.9218–0.9432)0.9917
W-XGBoost0.9302(0.9195–0.9409)0.9309(0.9205–0.9414)0.9302(0.9195–0.9409)0.9301(0.9195–0.9408)0.0319
Proposed0.9828(0.9781–0.9876)0.9831(0.9786–0.9876)0.9828(0.9781–0.9876)0.9828(0.9782–0.9875)5.3471

Note(s): Acc–Accuracy, Pre–Precision, Rec–Recall, Av. IT–Average Inference Time

Table 5

Final test performance on MSLD v2 and MCSI datasets

ModelsMSLD v2 datasetMCSI dataset
Pre (%)Rec (%)F1 (%)Pre (%)Rec (%)F1 (%)
W-Random Forest73.088.088.076.095.084.0
W-Extra Trees74.091.081.079.095.086.0
W-XGBoost74.086.080.079.095.086.0
W-LightGBM78.084.081.077.0100.087.0
W-L-SVM78.081.080.095.0100.098.0
Proposed75.091.082.095.0100.098.0

Note(s): Pre–Precision, Rec–Recall, and F1–F1-score denote Monkeypox class-specific performance on unseen test data after cross-validation

Table 6

Ablation study (5-fold cross-validation with 95% CI) on MCSI dataset

ModelAccPreRecF1 − score
w/o Depthwise-Separable conv0.9893(0.9872–0.9914)0.9894(0.9873–0.9916)0.9893(0.9872–0.9914)0.9893(0.9872–0.9914)
w/o CLAHE0.9874(0.9835–0.9914)0.9875(0.9835–0.9914)0.9874(0.9835–0.9914)0.9874(0.9834–0.9914)
w/o BO0.9882(0.9856–0.9908)0.9884(0.9859–0.9908)0.9882(0.9856–0.9908)0.9882(0.9856–0.9908)
w/o Class Weights0.9783(0.9734–0.9832)0.9784(0.9735–0.9834)0.9783(0.9734–0.9832)0.9783(0.9734–0.9832)
Proposed Model0.9893(0.9872–0.9914)0.9894(0.9873–0.9916)0.9893(0.9872–0.9914)0.9893(0.9872–0.9914)

Note(s): Observation: Acc–Accuracy, Pre–Precision, Rec–Recall

Table 7

Ablation study (5-fold cross-validation with 95% CI) on MSLD v2 dataset

ModelAccPreRecF1 − score
w/o Depthwise-Separable conv0.9831(0.9787–0.9875)0.9833(0.9790–0.9876)0.9831(0.9787–0.9875)0.9831(0.9787–0.9874)
w/o CLAHE0.9875(0.9825–0.9925)0.9876(0.9827–0.9926)0.9875(0.9825–0.9925)0.9875(0.9824–0.9925)
w/o BO0.9821(0.9765–0.9878)0.9824(0.9769–0.9879)0.9821(0.9765–0.9878)0.9822(0.9766–0.9878)
w/o Class Weights0.9682(0.9626–0.9739)0.9694(0.9642–0.9745)0.9682(0.9626–0.9739)0.9682(0.9625–0.9739)
Proposed0.9828(0.9781–0.9876)0.9831(0.9786–0.9876)0.9828(0.9781–0.9876)0.9828(0.9782–0.9875)

Note(s): Observation: Acc–Accuracy, Pre–Precision, Rec–Recall

Table 8

Hyperparameter search space for proposed model

ParameterTypeSearch range/Options
CLog-uniform10–3 – 103
KernelCategoricallinear, poly, rbf, sigmoid
GammaCategoricalscale, auto
DegreeInteger2–5
Class_weightComputedInversely proportional to class frequency
ProbabilityFixedTrue
Random_stateFixed42
Table 9

Optimal hyperparameters for the proposed model on MSLD and MCSI datasets

HyperparameterMCSIMSLD v2
C27.3567373.8548
Kernelrbfrbf
Gammaautoauto
Degree42
Class_weight1.01.0
ProbabilityTrueTrue
Random_state4242

Note(s): Optimal values were obtained using Optuna's TPE sampler over 15 trials for each dataset

Table 10

Comparison of key metrics for Mpox detection models

AuthorsMethodsPerformanceCLAHEL-CNNBayes opt
Kundu, Siddiqi, and Rahman (2022) ViTPr: 84.82; Re: 80.33; Fs: 82.73×××
Bala et al. (2023) MonkeyNetPr: 79.48; Re: 77.85; Fs: 78.56×××
Pramanik, Banerjee, Efimenko, Kaplun, and Sarkar (2023) CNN with beta functionPr: 88.91; Re: 96.28×××
Shetty et al. (2022) ML and CNNPr: 86; Re: 85×××
Raha et al. (2024) MobileNetV2Pr: 90; Re: 90; Fs: 93.39×××
ProposedLDSCNN-ABBLMMCSI: Pr: 75; Re: 91; Fs: 82
  MSLD v2: Pr:95; Re:100; Fs:98   

Note(s): Pr–Precision, Re–Recall, FsF1 − Score

Supplements

References

Ahsan
,
M. M.
,
Uddin
,
M. R.
,
Ali
,
M. S.
,
Islam
,
M. K.
,
Farjana
,
M.
,
Sakib
,
A. N.
,
 
Luna
,
S. A.
(
2023
).
Deep transfer learning approaches for monkeypox disease diagnosis
.
Expert Systems with Applications
,
216
, 119483. doi: .
Ahsan
,
M. M.
,
Alam
,
T. E.
,
Haque
,
M. A.
,
Ali
,
M. S.
,
Rifat
,
R. H.
,
Nafi
,
A. A. N.
,
 
Islam
,
M. K.
(
2024
).
Enhancing monkeypox diagnosis and explanation through modified transfer learning, vision transformers, and federated learning
.
Informatics in Medicine Unlocked
,
45
, 101449. doi: .
Al-Gaashani
,
M. S.
,
Xu
,
W.
, &
Obsie
,
E. Y.
(
2024
).
Mobilenetv2-based deep learning architecture with progressive transfer learning for accurate monkeypox detection
.
Applied Soft Computing
,
169
, 112553. doi: .
Albawi
,
S.
,
Bayat
,
O.
,
Al-Azawi
,
S.
, &
Ucan
,
O. N.
(
2018
).
Social touch gesture recognition using convolutional neural network
.
Computational Intelligence and Neuroscience
,
2018
(
1
), 6973103. doi: .
Ali
,
S. N.
,
Ahmed
,
M. T.
,
Jahan
,
T.
,
Paul
,
J.
,
Sani
,
S. S.
,
Noor
,
N.
,
 
Hasan
,
T.
(
2024
).
A web-based mpox skin lesion detection system using state-of-the-art deep learning models considering racial diversity
.
Biomedical Signal Processing and Control
,
98
, 106742. doi: .
Asif
,
S.
,
Zhao
,
M.
,
Tang
,
F.
,
Zhu
,
Y.
, &
Zhao
,
B.
(
2023
).
Metaheuristics optimization-based ensemble of deep neural networks for mpox disease detection
.
Neural Networks
,
167
,
342
359
. doi: .
Asif
,
S.
,
Zhao
,
M.
,
Li
,
Y.
,
Tang
,
F.
, &
Zhu
,
Y.
(
2024a
).
Cfi-net: A choquet fuzzy integral based ensemble network with pso-optimized fuzzy measures for diagnosing multiple skin diseases including mpox
.
IEEE Journal of Biomedical and Health Informatics
, Vol.
28
No.
9
, pp.
5573
-
5586
, doi: .
Asif
,
S.
,
Zhao
,
M.
,
Li
,
Y.
,
Tang
,
F.
, &
Zhu
,
Y.
(
2024b
).
Cgo-ensemble: Chaos game optimization algorithm-based fusion of deep neural networks for accurate mpox detection
.
Neural Networks
,
173
, 106183. doi: .
Bala
,
D.
,
Hossain
,
M. S.
,
Hossain
,
M. A.
,
Abdullah
,
M. I.
,
Rahman
,
M. M.
,
Manavalan
,
B.
,
 
Huang
,
Z.
(
2023
).
Monkeynet: A robust deep convolutional neural network for monkeypox disease detection and classification
.
Neural Networks
,
161
,
757
775
. doi: .
Campana
,
M. G.
,
Colussi
,
M.
,
Delmastro
,
F.
,
Mascetti
,
S.
, &
Pagani
,
E.
(
2024
).
A transfer learning and explainable solution to detect mpox from smartphones images
.
Pervasive and Mobile Computing
,
98
, 101874. doi: .
Cao
,
Y.
,
Yue
,
Y.
,
Ma
,
X.
,
Liu
,
D.
,
Ni
,
R.
,
Liang
,
H.
, &
Li
,
Z.
(
2025
).
Robustly detecting mpox and non-mpox using a deep learning framework based on image inpainting
.
Scientific Reports
,
15
(
1
),
1576
. doi: .
CDC
(
2024
).
Signs and symptoms
.
Available from:
 Link to the website
Debnath
,
J. P.
,
Hossen
,
K.
,
Sayed
,
S. B.
,
Khandaker
,
M. S.
,
Dev
,
P. C.
,
Sarker
,
S.
, &
Hossain
,
T.
(
2025
).
Identification of potential biomarkers for 2022 mpox virus infection: A transcriptomic network analysis and machine learning approach
.
Scientific Reports
,
15
(
1
),
2922
. doi: .
Gabriel
,
C. I.-O.
,
Kumar
,
R.
, &
Prasad
,
K.
(
2025
).
Deep digital twin services for personalized mpx treatment
. In
2025 17th International Conference on COMmunication Systems and NETworks (COMSNETS)
(pp. 
54
59
).
IEEE
.
Han
,
J.
,
Choi
,
B.
,
Kim
,
J. Y.
, &
Lee
,
Y.
(
2025
).
Bo-clahe enhancing neonatal chest x-ray image quality for improved lesion classification
.
Scientific Reports
,
15
(
1
),
4931
. doi: .
Ji
,
H.
,
Li
,
J.
,
Zhu
,
X.
,
Fan
,
L.
,
Jiang
,
W.
, &
Chen
,
Y.
(
2024
).
Enhancing assisted diagnostic accuracy in scalp psoriasis: A multi-network fusion object detection framework for dermoscopic pattern diagnosis
.
Skin Research and Technology
,
30
(
4
), e13698. doi: .
Karaddi
,
S. H.
,
Sharma
,
L. D.
, &
Bhattacharya
,
A.
(
2024
).
Softflatten-net: A deep convolutional neural network design for monkeypox classification from digital skin lesions images
.
IEEE Sensors Journal
, Vol.
24
No.
20
, pp.
32566
-
32576
, doi: .
Kesav
,
N.
, &
Jibukumar
,
M.
(
2022
).
Efficient and low complex architecture for detection and classification of brain tumor using rcnn with two channel cnn
.
Journal of King Saud University-Computer and Information Sciences
,
34
(
8
),
6229
6242
. doi: .
Kesav
,
N.
, &
MG
,
J.
(
2023
).
A deep learning approach with bayesian optimized kernel support vector machine for covid-19 diagnosis
.
Computer Methods in Biomechanics and Biomedical Engineering: Imaging & Visualization
,
11
(
3
),
623
637
. doi: .
Khairandish
,
M. O.
,
Sharma
,
M.
,
Jain
,
V.
,
Chatterjee
,
J. M.
, &
Jhanjhi
,
N.
(
2022
).
A hybrid cnn-svm threshold segmentation approach for tumor detection and classification of mri brain images
.
Irbm
,
43
(
4
),
290
299
. doi: .
Kumari
,
V.
, &
Ghosh
,
R.
(
2023
).
A magnification-independent method for breast cancer classification using transfer learning
.
Healthcare Analytics
,
3
, 100207. doi: .
Kundu
,
D.
,
Siddiqi
,
U. R.
, &
Rahman
,
M. M.
(
2022
).
Vision transformer based deep learning model for monkeypox detection
. In
2022 25th International Conference on Computer and Information Technology (ICCIT)
(pp. 
1021
1026
).
IEEE
.
Li
,
Z.
,
Liu
,
F.
,
Yang
,
W.
,
Peng
,
S.
, &
Zhou
,
J.
(
2021
).
A survey of convolutional neural networks: Analysis, applications, and prospects
.
IEEE Transactions on Neural Networks and Learning Systems
,
33
(
12
),
6999
7019
. doi: .
Li
,
X.
,
Zhou
,
S.
, &
Wang
,
F.
(
2025
).
A cnn-bigru sea level height prediction model combined with bayesian optimization algorithm
.
Ocean Engineering
,
315
, 119849. doi: .
Liu
,
W.
,
Zhang
,
E.
,
Li
,
W.
,
Lv
,
R.
,
Lin
,
Y.
,
Xu
,
Y.
,
 
Sun
,
Y.
(
2024a
).
Advances and challenges of mpox detection technology
.
Biosafety and Health
,
6
(
5
),
260
269
. doi: .
Liu
,
Z.
,
Jiang
,
P.
,
De Bock
,
K. W.
,
Wang
,
J.
,
Zhang
,
L.
, &
Niu
,
X.
(
2024b
).
Extreme gradient boosting trees with efficient bayesian optimization for profit-driven customer churn prediction
.
Technological Forecasting and Social Change
,
198
, 122945. doi: .
Lu
,
Q.
,
Zhang
,
H.
,
Fan
,
R.
,
Wan
,
Y.
, &
Luo
,
J.
(
2025
).
Machine learning-based bayesian optimization facilitates ultrafiltration process design for efficient protein purification
.
Separation and Purification Technology
,
363
, 132122. doi: .
Majumdar
,
S.
,
Pramanik
,
P.
, &
Sarkar
,
R.
(
2023
).
Gamma function based ensemble of cnn models for breast cancer detection in histopathology images
.
Expert Systems with Applications
,
213
, 119022. doi: .
Maqsood
,
S.
,
Damaševičius
,
R.
,
Shahid
,
S.
, &
Forkert
,
N. D.
(
2024
).
Mox-net: Multi-stage deep hybrid feature fusion and selection framework for monkeypox classification
.
Expert Systems with Applications
,
255
, 124584. doi: .
Mujahid
,
M.
,
Rustam
,
F.
,
Shafique
,
R.
,
Montero
,
E. C.
,
Alvarado
,
E. S.
,
de la Torre Diez
,
I.
, &
Ashraf
,
I.
(
2024
).
Efficient deep learning-based approach for malaria detection using red blood cell smears
.
Scientific Reports
,
14
(
1
), 13249. doi: .
Nayak
,
T.
,
Chadaga
,
K.
,
Sampathila
,
N.
,
Mayrose
,
H.
,
Gokulkrishnan
,
N.
,
Prabhu
,
S.
, &
Umakanth
,
S.
(
2023
).
Deep learning based detection of monkeypox virus using skin lesion images
.
Medicine in Novel Technology and Devices
,
18
, 100243. doi: .
Pramanik
,
R.
,
Banerjee
,
B.
,
Efimenko
,
G.
,
Kaplun
,
D.
, &
Sarkar
,
R.
(
2023
).
Monkeypox detection from skin lesion images using an amalgamation of cnn models aided with beta function-based normalization scheme
.
PLoS One
,
18
(
4
), e0281815. doi: .
Rabie
,
A. H.
, &
Saleh
,
A. I.
(
2023
).
Monkeypox diagnosis using ensemble classification
.
Artificial Intelligence in Medicine
,
143
, 102618. doi: .
Raghavendra
,
P. V.
,
Charitha
,
C.
,
Begum
,
K. G.
, &
Prasath
,
V.
(
2023
).
Deep learning–based skin lesion multi-class classification with global average pooling improvement
.
Journal of Digital Imaging
,
36
(
5
),
2227
2248
. doi: .
Raha
,
A. D.
,
Gain
,
M.
,
Debnath
,
R.
,
Adhikary
,
A.
,
Qiao
,
Y.
,
Hassan
,
M.M.
,
Bairagi
,
A.K.
, &
Islam
,
S.M.S.
(
2024
).
Attention to monkeypox: an interpretable monkeypox detection technique using attention mechanism
.
IEEE Access
,
12
,
51942
-
51965
. doi: .
Sahin
,
V. H.
,
Oztel
,
I.
, &
Yolcu Oztel
,
G.
(
2022
).
Human monkeypox classification from skin lesion images with deep pre-trained network using mobile application
.
Journal of Medical Systems
,
46
(
11
),
79
. doi: .
Saleh
,
A. I.
, &
Rabie
,
A. H.
(
2023
).
Human monkeypox diagnose (hmd) strategy based on data mining and artificial intelligence techniques
.
Computers in Biology and Medicine
,
152
, 106383. doi: .
Setegn
,
G. M.
, &
Dejene
,
B. E.
(
2025
).
Explainable ai for symptom-based detection of monkeypox: A machine learning approach
.
BMC Infectious Diseases
,
25
(
1
),
419
. doi: .
Shetty
,
B.
,
Fernandes
,
R.
,
Rodrigues
,
A. P.
,
Chengoden
,
R.
,
Bhattacharya
,
S.
, &
Lakshmanna
,
K.
(
2022
).
Skin lesion classification of dermoscopic images using machine learning and convolutional neural network
.
Scientific Reports
,
12
(
1
), 18134. doi: .
Sitaula
,
C.
, &
Shahi
,
T. B.
(
2022
).
Monkeypox virus detection using pre-trained deep learning-based approaches
.
Journal of Medical Systems
,
46
(
11
),
78
. doi: .
Thieme
,
A. H.
,
Zheng
,
Y.
,
Machiraju
,
G.
,
Sadee
,
C.
,
Mittermaier
,
M.
,
Gertler
,
M.
,
 
Gevaert
,
O.
(
2023
).
A deep-learning algorithm to classify skin lesions from mpox virus infection
.
Nature Medicine
,
29
(
3
),
738
747
. doi: .
Thornhill
,
J. P.
,
Barkati
,
S.
,
Walmsley
,
S.
,
Rockstroh
,
J.
,
Antinori
,
A.
,
Harrison
,
L. B.
,
 
Orkin
,
C. M.
(
2022
).
Monkeypox virus infection in humans across 16 countries—april–june 2022
.
New England Journal of Medicine
,
387
(
8
),
679
691
. doi: .
Usman
,
S.
,
Adamu
,
I. I.
, et al.
(
2017
).
Modeling the transmission dynamics of the monkeypox virus infection with treatment and vaccination interventions
.
Journal of Applied Mathematics and Physics
,
5
(
12
),
2335
.
Weintraub
,
K.
(
2025
).
Is there mpox in nc? What to know about monkeypox cases from ncdhhs
.
USA Today. Available from:
 Link to the website (
accessed
 2 May 2025).
World Health Organization
(
2024
).
Mpox outbreak
.
Available from:
 Link to the website (
accessed
 2 May 2025).
Yadav
,
S.
, &
Qidwai
,
T.
(
2024
).
Machine learning-based monkeypox virus image prognosis with feature selection and advanced statistical loss function
.
Medicine in Microecology
,
19
, 100098. doi: .
Yang
,
K.
,
Liu
,
L.
, &
Wen
,
Y.
(
2024
).
The impact of bayesian optimization on feature selection
.
Scientific Reports
,
14
(
1
),
3948
. doi: .
Yogalakshmi
,
G.
, &
Rani
,
B. S.
(
2024
).
Sailfish optimizer based clahe with u-net for mri brain tumour segmentation
.
Measurement: Sensors
,
33
, 101229. doi: .
Yoshimi
,
Y.
,
Mine
,
Y.
,
Ito
,
S.
,
Takeda
,
S.
,
Okazaki
,
S.
,
Nakamoto
,
T.
,
 
Tanimoto
,
K.
(
2024
).
Image preprocessing with contrast-limited adaptive histogram equalization improves the segmentation performance of deep learning for the articular disk of the temporomandibular joint on magnetic resonance images
.
Oral Surgery, Oral Medicine, Oral Pathology and Oral Radiology
,
138
(
1
),
128
141
. doi: .
Yousaf
,
M. Z.
,
Singh
,
A. R.
,
Khalid
,
S.
,
Bajaj
,
M.
,
Kumar
,
B. H.
, &
Zaitsev
,
I.
(
2024
).
Enhancing hvdc transmission line fault detection using disjoint bagging and bayesian optimization with artificial neural networks and scientometric insights
.
Scientific Reports
,
14
(
1
), 23610. doi: .
Zhang
,
J.
,
Zhou
,
H.
,
Niu
,
Y.
,
Lv
,
J.
,
Chen
,
J.
, &
Cheng
,
Y.
(
2021
).
Cnn and multi-feature extraction based denoising of ct images
.
Biomedical Signal Processing and Control
,
67
, 102545. doi: .
Zuiderveld
,
K.
(
1994
).
Contrast-limited adaptive histogram equalization
.
Graphics Gems
,
IV
,
474
485
.

Languages

or Create an Account

Close Modal
Close Modal