

This study aims to analyze the underlying relational structure in the prioritization of factors that may influence strategic planning, to identify patterns that affect the achievement of consensus among organizational actors.
This study adopted a multi-methodological approach, combining three techniques: 1) the analytic hierarchy process to prioritize factors that can improve strategic planning; 2) social network analysis to contrast its results and assess whether the relational structure affects consensus; 3) robust linear regression (HC3) to estimate the relationship between network structure and proximity to consensus.
The results suggest that the highest-priority factors for promoting sales improvement are commitment, plan development and organizational culture. In relational terms, the study observes that a relevant mechanism for consensus is homophily, governed by operational functions; that is, process improvements, such as sales, benefit those who perform similar tasks rather than heterogeneity.
This work is limited to organizational aspects. The study was conducted in collaboration with a Mexican commercial company, in which 110 of 150 employees responded (3 executive managers, 8 managers and 99 operational staff), with an average of 5 years of experience. Although the data analyzed are individual judgments, the inference is at the organizational level, to understand the whole and its relationships with the parts.
This work can help academics and professionals allocate resources more effectively, adopt more equitable deliberation processes, and reduce the unintended dominance of any actor in organizational processes.
This work contrasts with previous research by proposing a systemic perspective to prioritize factors that can improve critical processes and to understand how group preferences are affected by the structural position of actors. Therefore, this study invites the adoption of methodological complementarity to improve group decision-making processes.
1. Introduction
Our work addresses organizational aspects in small and medium-sized industrial enterprises (SMEs), particularly decision-making and consensus-building. We seek not only to inform the prioritization of factors that can improve strategic planning, but also to understand the relational factors that influence decision-making. These types of organizations, SMEs, are relevant because they contribute to the economy of countries by generating formal employment and promoting innovation in goods and services (Valdez-Juárez et al., 2023). They are also relevant in the Mexican context, not only because they generate 45% of formal jobs (INEGI, 2025), but also because they have structural vulnerabilities in which small misalignments can be amplified, increasing their failure rate (Ahmad and Pirzada, 2014).
According to Audretsch and Guenther (2023), despite the relevance of SMEs to the formal market in different economies, they are vulnerable because they lack coordination mechanisms that promote agile internal decision-making and viability. In this same vein, Audretsch et al. (2023) indicated that the fragility of this type of organization is accentuated because they have to operate with limited resources and overloaded functions that affect, among other factors, strategic planning, turning it into a problem that impacts the coordination of operations rather than an exercise or analytical reflection. Therefore, in an adverse context, it is necessary to adopt a framework that enables managers and collaborators to prioritize organizational factors such as commitment, planning routines, culture, management capabilities and communication. Subsequently, it is not only necessary to decide quickly but also to translate these decisions appropriately to implement mechanisms that convert prioritized criteria into coordinated actions. Thus, this translation problem is related to how agreements between organizational actors are formed and disseminated.
Prioritizing factors to improve processes and achieve organizational goals involves building consensus without ignoring context, which remains a challenge for many SMEs (Wen et al., 2025). Among the obstacles hindering this task are structural frictions, operational imbalances, inadequate resource allocation, poor communication and duplication of functions (Vásquez-Ruiz et al., 2024). In this regard, there is still an opportunity not only to identify the aspects that promote the improvement of key processes, but also to understand how and to what extent organizational design shapes consensus and decision-making (Yuan and van Knippenberg, 2022).
Various research efforts have linked decision-making to organizational structure within relational frameworks, but, according to Wang et al. (2023), the structure in which consensus or decision-making occurs has not received the same level of attention as the decision-making process itself or its application. This has led to the omission that higher-level positions must generate results-oriented plans. Therefore, building consensus in SMEs is a challenge that requires reviewing the mechanisms that govern it, rather than reducing it to aspects such as workplace hierarchy (Utama and Abirfatin, 2023) or organizational cultur (Wen et al., 2025). Thus, consensus requires analyzing structural or relational aspects, as the environment in which SMEs operate imposes multiple pressures. Along these lines, research efforts have focused on two areas: on the one hand, the development of multi-criteria methods and aggregation processes to support planning and, on the other, the examination of structural factors that influence collective agreement.
Under the aforementioned framework, consensus is often treated as the direct output of deliberation, with agreement reflecting only the quality of deliberation or hierarchical influence. In contrast, in the context of our work, we consider consensus from a systemic perspective, that is, as an emergent and relational property observable through patterns of alignment among decision-makers’ profiles (Marchiori et al., 2022). In a sense, this suggests a guideline for exploring a critical link between the micro and the meso, i.e. how individual judgments shape the aggregation of consensus and affect strategic planning. This idea is considered relevant in the context of SMEs, where organizational position or informal communication can affect the implementation of plans (Morton and Iglesias Ruiz, 2024). In this regard, this perspective broadens the use of multi-criteria techniques beyond the development of a factor classification. It enables individual results to characterize the network architecture, thereby facilitating an understanding of agreement generation.
Considering the above, the article addresses the following research question: To what extent does consensus on strategic prioritization in an SME depend on the alignment structure between actors rather than on normative assumptions about hierarchical influence? to operationalize this question, we propose a framework based on the analytical hierarchy process (AHP) (Saaty, 2008) and social network analysis (Brede, 2012) to prioritize the factors that promote better strategic planning and assess the relationship between consensus building and organizational structure, addressing the gap between strategic planning and implementation. We also seek to highlight the importance of evaluating network factors that enable decision-making and foster adaptation to a changing environment (Fadda et al., 2022). Considering to van Kuppevelt et al. (2022), we think that the originality of our work lies not only in the combination of analytical tools from a systemic perspective, but also, from a methodological point of view, in proposing an approach to treat AHP results as a multivariate object and using social network analysis (SNA) as an analytical perspective that allows for a structural interpretation of consensus to improve the decision-making capacity of SME managers by integrating the knowledge of participants through methodological complementarity.
This article also seeks to contribute to organizational studies by proposing consensus as a structural phenomenon. Empirically, we seek to provide findings on how cohesion can coexist with modular segmentation and structural roles, using an industrial SME as an example. Subsequently, our article is organized as follows: a literature review advocating a multi-method approach to address the organizational problems of industrial SMEs comprehensively. Next, the methodological section describes the application of AHP and SNA to examine the relationship between structural centrality and consensus building in strategic planning processes. Finally, an analysis of the results and a brief conclusion highlight the theoretical implications and propose avenues for future research.
2. Literature review
Building consensus within the organizational framework means that decision-makers promote the legitimacy of the organization’s plans and objectives by involving employees in both the design and implementation of these plans (Cinelli et al., 2022). Therefore, addressing planning and coordination mechanisms is considered relevant for operating in an environment whose characteristics threaten business viability. This encompasses a theoretical aspect: consensus is not merely procedural but an organizational capacity that can be sustained or eroded depending on levels of access to information, coordination mechanisms and the architecture of the organizational system.
The problem mentioned above is relevant to the organizational and management domain because consensus serves as a link between formulation and action. However, the literature suggests that a substantial part of the work on the subject continues to prioritize the formulation phase, underestimating the role of interpersonal relationships, autonomy in decision-making, and methodological complementarities in promoting effective agreements (Christie and Tippmann, 2024). Along these lines, (Samson and Bhanugopan, 2022) highlighted the importance of the human factor and motivational mechanisms, emphasizing that strategic management requires cross-functional coordination and collective commitment. Based on these ideas, it should be noted that planning failure is not only related to poor plan design, but also to the social system that should support this process to facilitate cross-functional transition and maintain coordination (Zhao et al., 2024). Thus, to address the persistent gap between planning and consensus and to support professionals, Wen et al. (2025) proposed studying the factors that hinder consensus building among key actors in organizations, especially in environments where planning-related situations become unstructured.
At this point, it is worth noting that in emerging economic contexts, environmental constraints can put pressure on SME coordination mechanisms, thereby increasing the likelihood of failure (Utama and Abirfatin, 2023). In this sense, the Mexican context is considered analytically relevant, since it combines a high dependence on formal employment with organizational vulnerabilities, in which internal coordination becomes a determinant of viability.
In terms of the literature, Morton and Iglesias Ruiz (2024) indicated that the study of the relationship between strategic planning and consensus building has essentially focused on five areas: 1) the role of organizational structure or design; 2) consensus as an organizational property or process; 3) methodological development; 4) the efficiency of approaches; and 5) implementation in specific contexts. Although these topics address the issue at hand in this article, they differ in their methodological and ontological assumptions, leading to distinct approaches. According to Marchiori et al. (2022), this fragmentation can lead managers to have a partial understanding of the interactions necessary to promote strategic action.
The study on organizational design provides a perspective for understanding the problem, as Pongboonchai-Empl et al. (2025) argue that design influences the speed and clarity of communication, as well as the transfer and management of resources, thereby contributing to organizational balance. In this regard, Zhang and Lim (2025) identified that structures oriented toward operational efficiency tend to leverage their configuration to seek flexibility and coordination, setting aside their principles or policies, while overly centralized structures tend to become vulnerable to external disturbances because the ability to study the environment and implement changes in response to it is often incompatible with their capacity for resolution (Muñoz-Valero et al., 2025). From the consensus perspective, these properties are important because they imply that, in both formal and informal structures, differences in profiles, educational level, social relationships and membership in a specific group affect the process of aggregating references to form a consensus (Fadda et al., 2022; Bernstein et al., 2022). In particular, this argument challenges the assumption of symmetrical relative influence in preference aggregation (Mirbagheri et al., 2023) by arguing that norms should allow collaborators to have equal influence on consensus and outcomes (Chang et al., 2025).
The above ideas raise a critical point: consensus can be understood as an organizational process or a systemic property that should not be reduced solely to hierarchical terms. From an organizational process perspective, Cinelli et al. (2022) and Coucke et al. (2025) argued that norms, organizational culture and relational topologies often influence the consensus-planning pair. In addition, Wen et al. (2025) and Yuan and van Knippenberg (2022) suggested that the study of planning and consensus has focused on properties that derive from alignment mechanisms, such as relationship frequency, communication quality, coordination and even friction between functions. In this regard, Shan and Mostaghim (2024) argued that organizational structure can serve as an indicator of influence and how it affects various aspects, such as the integration of human and technological resources, communication for collaboration and the design of collective solutions (Audretsch and Guenther, 2023; Audretsch et al., 2023). Considering this idea, Bayrak (2021) and Rizwan et al. (2025) indicated that, as a systemic or emergent property, consensus affects a company’s ability to organize itself, mainly by incorporating the normative perspective, specifically the principle of rationality (Bernstein et al., 2022). This approach aligns with the ideas of Bocoya-Maline et al. (2023) who proposed conducting studies that directly relate positional metrics to consensus in industrial environments, seeking to explore the existence of bridges or factors that integrate heterogeneity without collapsing it into superficial agreements.
In parallel, methodological frameworks and tools have been proposed to model consensus, improve planning and support better communication of plans. In this context, it is worth highlighting the application of approaches such as fuzzy logic, multi-criteria analysis and game theory, which are often combined to enhance their practical impact on the operation of organizations(Zhou et al., 2024; Greco et al., 2025). Regarding the efficiency of consensus models, Zhao et al. (2024) and Wen et al. (2025) used adaptive approaches with penalty mechanisms to reduce dissenting behavior and increase the fairness of consensus (van Kuppevelt et al., 2022; Ma et al., 2024). However, at least two recurring limitations persist concerning these approaches: on the one hand, the reliance on cross-sectional data, which restricts the longitudinal understanding of consensus and its effects on performance (Audretsch et al., 2023; Shan and Mostaghim, 2024); on the other hand, consensus is often treated as an algorithmic endpoint, without explicitly incorporating the relational structure that conditions why certain actors converge more than others, or why certain substructures consolidate local agreements that do not necessarily translate into organizational alignment. Despite the limitations, studies focused on methodological development provide valuable information, as they often examine the integration of the human factor and technological resources as an alternative to address the challenges of adaptability to the environments in which SMEs operate (Huang et al., 2023). According to Zhong et al. (2024) and Greco et al. (2020), this opens the door to analyzing how trust, noncooperative behavior and organizational culture can serve as indicators to improve the integration of the aforementioned factors. In this regard, the results obtained by Yuan and van Knippenberg (2022) suggested a positive impact of group size on decision-making. However, the lack of feedback may limit the applicability of these models in SMEs (Utama and Abirfatin, 2023), while balancing speed and depth of consensus remains a challenge. According to van der Heijden (2022), communication tools have received attention for their potential to improve transparency in decision-making and consensus. Along these lines, Zhou et al. (2024) indicated that communication infrastructure and the effective use of information technologies are positively correlated with optimal staff performance and organizational leadership. In this regard, studying the technological capacity gap in SMEs remains a challenge and requires attention to inform data-driven design recommendations (Qin et al., 2026).
The above briefly presents some approaches to researching strategic planning and consensus. Regarding their application in specific contexts, the works of Wang et al. (2023) and Tran et al. (2024) reported on the usefulness of decision-making models in sectors such as manufacturing, automotive and food services, highlighting the adoption of a networked organizational design to promote joint decision-making. Nonetheless, Audretsch and Guenther (2023) indicated that the heterogeneity of contexts makes it difficult to generalize the results, especially when extending them to more complex scenarios. Regarding the latter, the measurement of decision outcomes, in which performance systems have attempted to reinforce the evaluation of effectiveness (Shan and Mostaghim, 2024). However, focusing primarily on short-term metrics, coupled with a scarcity of standardized indicators and underutilization of qualitative variables such as commitment and perceived quality, tends to affect the robustness of conclusions (Huang et al., 2023). In addition, the social dynamics of planning and consensus have been addressed from perspectives such as the SNA (Ma et al., 2024; Zhou et al., 2024), trust relationships and behavior classification to manage diverse attitudes (Yuan and van Knippenberg, 2022; Utama and Abirfatin, 2023). In this regard, models have been developed to incorporate behavioral factors related to overconfidence, which improves the modeling of group decisions (Muñoz-Valero et al., 2025; Zhong et al., 2024).
Considering the literature reviewed, it was observed that works on consensus and strategic planning in organizational frameworks have focused on two main avenues: on the one hand, identifying and prioritizing factors that favor or hinder consensus based on a multi-criteria perspective; on the other hand, contributions that address the organizational structure and relationships within it, which, despite describing positions, roles or types of influence, tend not to incorporate the structure with the empirical study of positions and preferences, which together shape consensus. However, both avenues of work seem poorly integrated, and this lack of coordination contributes to the analytical gap addressed in this paper, namely, the gap between adopting an analytical framework that links multi-criteria prioritization mechanisms in planning to the structure of similarity between decision-makers and their structural positions. In other words, to address empirically, and not in a normative sense, whether proximity to consensus depends on the centrality of actors in the organizational structure, rather than considering that consensus emerges solely from a deliberative process. Within this framework of ideas, our work is justified because it does not rank judgments but rather articulates the relational perspective to understand how some actors converge more than others toward collective agreement.
3. Methodological approach
Our study followed a single-case cross-sectional design (Brooks et al., 2025). The unit of analysis was the vector of priorities related to strategic planning provided by each participant. We used a multi-methodological approach to analyze the data, following a strategy of deriving individual and group priorities and modeling participants’ structural positions using network structures and measures. Next, we describe the integration of tools for both prioritizing factors and analyzing the relationships that shape consensus. First, we select AHP (Saaty, 2008), a multi-criteria technique for selecting the best alternative based on importance, while for the second task, we used SNA.
We consider AHP suitable because of its systemic nature, its practical orientation and its incorporation of participants’ experience (Saaty, 2008). In addition, it has been applied across various fields, including education, medicine and defense, as well as in the context of strategic planning (Marques et al., 2021). Regarding the latter, recent methodological reviews have documented not only the continued application of AHP in management, planning and strategic decision-making contexts, but also its evolution through its pairing with other analytical tools (Birgani et al., 2022).
For example, Arbel and Orgler (1990) applied AHP to evaluate and plan a strategy for a banking institution facing acquisition and merger issues, whose model was tested only with the company’s board of directors. Likewise, in the context of strategic planning, Ahmad and Pirzada (2014) prioritized functional strategies to improve the operations of a company’s automotive sector departments, indicating that the strategy and marketing departments are the most relevant, but that financial and human resources are often neglected. For its part, Riahi and Moharrampour (2016) used AHP to select the best strategy and thus guide the expansion process of a medium-sized company, involving all staff. Along these lines, Canco et al. (2021) proposed a guide for its use in the context of SMEs, emphasizing that it should be part of decision-makers’ toolkit. In addition, using the AHPDo (2025), they prioritized critical areas for planning a company’s internationalization.
Regarding the application of the AHP-SNA-based methodological approach, Liebowitz (2005) reported using individual AHP prioritizations as connection attributes to generate a weighted network and analyze how knowledge shapes relationships and affects decisions within departments. Following the same approach, but in the opposite direction, Grady et al. (2015) used network metrics as input to the AHP algorithm and improved project selection by accounting for node popularity. Romero-Gelvez and Garcia-Melon (2016) applied SNA to calculate node-level metrics and used AHP to evaluate those metrics to select the best actor for project planning. In contrast, Shi et al. (2020) used this pair of tools to select the evaluators who would participate in the decision. In turn, Birgani et al. (2022) evaluated whether the institutional role of an expert influences organizational decisions. Complementarily, more recent applications of this approach reinforce the idea that consensus can be explicitly modeled as a network (Zhong et al., 2024), in which trust has been studied as a condition for the convergence of opinions (Zhou et al., 2024) or as a factor in the evolution of consensus (Qin et al., 2026). In the context of our work, we use the multivariate network perspective (Crane, 2018); that is, we start from the decision vectors of the participants, which form a data matrix, and analyze them using SNA.
3.1 Expressing the hierarchical structure of analytical hierarchy process
At this stage, we present the problem to facilitate understanding. According to Saaty (2008), this representation comprises three levels: level 0 expresses the purpose of decision-making, which in our study is to prioritize factors that positively influence strategic planning; levels 1 and 2 contain the factors and subfactors, respectively. To define the components of the model, we used the literature review, which addressed aspects such as: 1) strategic relevance, considered as the ability of a factor to influence resource allocation and planning (Jinghua and Haiying, 2023); 2) empirical relevance, that is, the consistency with which a factor is used in the literature Wang et al. (2023); 3) applicability, that is, the possibility of operationalizing a factor using the scale of Saaty (2008). We gave priority to articles less than 10 years old and distinguished them by analytical level (structural, interpersonal, cultural, planning). Based on the above, Table 1 presents the factors that make up the conceptual model (Figure 1).
 The hierarchical flowchart has three levels of labelled boxes connected by lines. The top box reads Prioritise factors to positively influence strategic planning. Five middle boxes below read Commitment, Communication, Managerial skills, Organisational culture, and Plans development. Five lower boxes contain grouped phrases. From left to right, they read Responsibility, Loyalty, Sense of need; Clarity, Simplicity, Involvement; Convincement, Resource alignment, Prioritise common interest; Motivation, Feedback, Corrective actions; Fostering consensus, Tasks clearly assigned, Consistent goals. Lines connect the top box to all middle boxes and the middle boxes to multiple lower boxes.
Conceptual model
Source: Self-elaboration based on literature review
The hierarchical flowchart has three levels of labelled boxes connected by lines. The top box reads Prioritise factors to positively influence strategic planning. Five middle boxes below read Commitment, Communication, Managerial skills, Organisational culture, and Plans development. Five lower boxes contain grouped phrases. From left to right, they read Responsibility, Loyalty, Sense of need; Clarity, Simplicity, Involvement; Convincement, Resource alignment, Prioritise common interest; Motivation, Feedback, Corrective actions; Fostering consensus, Tasks clearly assigned, Consistent goals. Lines connect the top box to all middle boxes and the middle boxes to multiple lower boxes.Conceptual model
Source: Self-elaboration based on literature review
Selected components for AHP prioritization
| Component | Operational definition for AHP assessment | Rationale |
|---|---|---|
| Commitment | The degree to which staff identify with objectives, maintain sustained effort, and assume shared responsibility for results | Enhances adherence and reduces friction in execution, which is critical in resource-constrained environments |
| Communication | Quality, frequency and bidirectionality of relevant information flow to coordinate tasks, provide feedback and align expectations | Improves coordination and response times; reduces uncertainty and rework |
| Managerial skills | Management skills (mostly Middle management) for planning, coordinating, allocating resources, prioritizing, resolving conflicts and monitoring performance | They translate strategy into operations, serving as the bridge between objectives and daily tasks |
| Organizational culture | Set of values and norms (collaboration, learning, customer focus, continuous improvement) that guide behavior and cross-functional cooperation | Shapes behavior and cooperation; conditions acceptance of change and consensus |
| Plans development | Ability to translate objectives into actionable plans (goals, responsible parties, timelines, indicators and follow-up) | Ensures strategy traceability, reducing ambiguity and facilitating execution |
Based on the above, the conceptual model for this work was constructed in the second phase (Figure 1), considering the information in Table 1 and contrasting it with the work of Vásquez-Ruiz et al. (2024).
Figure 1 also shows the second level with the factors and the third level with the elements to be evaluated. It should be noted that no alternatives were introduced, as we used AHP to prioritize without discarding any factors, rather than deciding on a single element (López-Torres et al., 2023).
3.2 Phase 2. Collecting data from experts
To collect the information, the National Chamber of the Transformation Industry (CANACINTRA, Spanish acronym) in Mexico provided a list of five SMEs to participate in the study, of which only one agreed. This is a medium-sized company that sells industrial equipment and employs 150 people. The final group of participants consisted of operators, analysts, coordinators and managers, with an average length of service of 5 years in the organization. The AHP questionnaire was emailed to all company members, and virtual meetings were held to explain how to complete it. Finally, we obtained complete responses from 110 employees (73%).
Regarding the sample size in our study, we consider it relevant to note that AHP is not a parametric tool and therefore does not depend on the normal distribution of data, since the object of analysis is the decision-making process, not the number of participants in that process. Thus, even with small sample sizes, valid data can be obtained (Saaty, 2008). Regarding this last idea, some studies have reported valid results with smaller samples: Baek (2025) worked with 15 experts to plan health information strategies aimed at Korean consumers. Lin and Lu (2012) presented results on the characterization of disagreement, using 18 experts in the strategic evaluation of educational performance. In turn, Somsuk and Laosirihongthong (2014) incorporated 50 experts in strategic management and business creation to identify the minimum and sufficient factors for allocating resources to new organizations in emerging markets. For example, Table 2 describes the scale used to make pairwise comparisons in the model; that is, participants assigned a level of importance to one factor relative to another based on their experience. In addition, an excerpt from the data collection instrument is shown.
AHP Scale and instrument sample
| Applied scale for pairwise comparison | ||
|---|---|---|
| Scale | Intensity | Definition |
| 1 | Equal importance | Two activities contribute equally to the objective |
| 2 | Weak or slight | Experience and judgment slightly favor One activity over another |
| 3 | Moderate importance | Experience and judgment strongly favor One activity over another |
| 4 | Moderate plus | An activity is favored very strongly over another; its dominance is demonstrated in practice |
| 5 | Strong importance | The evidence favoring One activity over another is of the highest possible order of affirmation |
| 6 | Strong plus | A reasonable assumption |
| 7 | Very strong or demonstrated importance | May be difficult to assign the best value but when compared with other contrasting activities the size of the small numbers would not be too noticeable, yet they can still indicate the relative importance of the activities |
| 8 | Very, very strong | – |
| 9 | Extreme importance | – |
| Reciprocals: | ||
| If activity i has One of the above non-zero numbers assigned to it when compared with | ||
| Activity j, then j has the reciprocal value when compared with i | ||
| If the activities are very close, a reasonable assumption may be made | ||
| Factors comparison example | ||||||||||||||||||
| Factor A | 9 | 8 | 7 | 6 | 5 | 4 | 3 | 2 | 1 | 2 | 3 | 4 | 5 | 6 | 7 | 8 | 9 | Factor B |
| Commitment | Communication | |||||||||||||||||
| Commitment | Managerial skills | |||||||||||||||||
| Commitment | Organizational culture | |||||||||||||||||
| Commitment | Plans development | |||||||||||||||||
| Communication | Managerial skills | |||||||||||||||||
| Communication | Organizational culture | |||||||||||||||||
| Communication | Plans development | |||||||||||||||||
| Subfactors comparison example | ||||||||||||||||||
| Subfactor A | 9 | 8 | 7 | 6 | 5 | 4 | 3 | 2 | 1 | 2 | 3 | 4 | 5 | 6 | 7 | 8 | 9 | Subfactor B |
| Responsability | Loyalty | |||||||||||||||||
| Responsability | Sense of need | |||||||||||||||||
3.3 Phase 3. Apply analytical hierarchy process algorithm
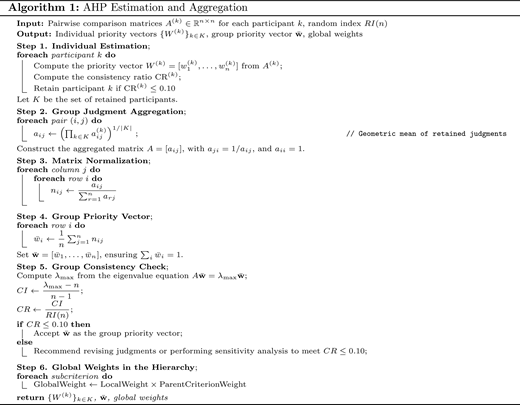
Each participant compared the factors in the model using the 9-point scale mentioned above, and the results were obtained using the algorithm from Saaty (2008) described below:
The algorithm consists of six phases: first, the matrices A(k) ∈ ℝn×n are formed, with the paired comparisons of each participant, which were used to calculate the vector of individual priorities W(k). The consistency index (CR) allowed the consistency of the judgments to be evaluated, and those that meet the criterion CR(k) ≤ 0.10 were retained to ensure the validity of the individual judgments. Subsequently, the judgments were aggregated to obtain group consensus using the geometric mean, as this allows multiplicative aggregation. Calculating for each pair (i, j) the aggregate value aij as the |K|-th root of the product of the corresponding individual values, where K is the set of valid participants. At this point, it should be noted that the resulting matrix is reciprocal symmetric, with aji = 1/aij and aii = 1. The next step was to normalize the aggregated matrix, yielding a relative priority matrix that allows the group priority vector to be derived as the average of the normalized rows. It is necessary to verify whether the collective judgment is consistent or whether there was consensus, so the maximum eigenvalue λmax was determined, as well as the consistency index CI = (λmax – n)/(n – 1), and the CR = CI/RI(n), where RI(n) is the random index corresponding to the size of the matrix provided by Saaty (2008). In this sense, the vector was accepted as a representation of the group if CR ≤ 0.10 was satisfied; otherwise, it was recommended to review the judgments. Finally, the global weights were obtained, allowing us to determine the importance of the upper levels relative to the terminal elements of the model. Subsequently, we analyzed the wi for each participant using SNA, employing a similarity network based on Pearson’s correlation of normalized vectors, to calculate network metrics and assess proximity to consensus.
3.4 Phase 4. Network formation and analysis based on analytical hierarchy process results
In the next phase, we incorporate the SNA, considering the AHP results as a rectangular data object from the perspective of multivariate networks (Crane, 2018). Then, we defined W ∈ ℝn × m as the normalized matrix of AHP, where wi ∈ ℝm corresponds to the vector of priorities of each participant i on the m factors of the construct. Therefore, to estimate the structural similarity between participants, we use Pearson’s correlation between each pair of vectors (Brede, 2012):
where
sij ∈ [−1, 1] indicates the degree of similarity between participants, and based on the similarity matrix S = [sij], we defined a symmetric weighted adjacency matrix A = [aij] with threshold τ (Brede, 2012; Crane, 2018) with sii = 0, to exclude self-relations:
We adopted τ = 0.75, because the objective was to preserve relationships with moderate to high similarity (Brede, 2012; Crane, 2018). Therefore, we present an undirected and weighted network G = (V, E), where |V| = n and each edge eij ∈ E has a weight aij > 0.
Once the network has been constructed, we analyze it using the measures suggested by Crane (2018): 1) Degree centrality, to determine the number of connections each participant shares with other people whose preferences are similar, which can be interpreted as the ability to broaden consensus. 2) Density, to report on the degree of agreement among participants and reveal patterns of preference; therefore, low density would reflect fragmentation and difficulty in reaching consensus. 3) Clustering coefficient, which reports on the tendency to form subgroups with similar preferences, which could facilitate local coordination but limit pluralism. 4) Transitivity coefficient, to assess the proportion of closed triads in relation to the total number of possible triads in the network. It is used as a complementary measure of clustering. 5) Betweenness, which provides information on the bridges between subgroups with different preferences, which can stimulate or block the flow of information and the integration of perspectives. 6) Eigenvector, which suggests the number of connections and influence of neighbors, so a high index suggests that a participant shares preferences with influential actors, positioning themselves as a catalyst for consensus without playing a hierarchical role. 7) Closeness, to reflect an actor’s average proximity to the rest of the network, suggesting that access to different perspectives facilitates alignment with group consensus and accelerates coordination. 8) Communities and modularity, we evaluate community detection algorithms to analyze structural homophily, using modularity (Q) to identify similar substructures and understand the alliances that influence consensus.
3.4.1 Phase 5. Consensus and structural influence analysis.
The consensus vector w* was calculated using the geometric mean of the individual vectors (Saaty, 2008):
The distance of each decision maker i from the consensus was estimated using the Euclidean distance:
To ease interpretation, we used a normalized proximity measure:
Ultimately, evaluate the relationship between structural influence and proximity to consensus using correlations via linear regression (Molina-Abril et al., 2025):
being CE(i) and CB(i) eigenvector and betweenness centralities. Considering the model, the following hypotheses were proposed: H0 : β1 = β2 = β3 = β4 = 0 to suggest that structural position does not explain proximity to consensus. Therefore, HA : at least one of βj ≠ 0 implying that factors such as prestige, betweenness, the ability to have effective contacts, and cohesion jointly explain the variation in proximity to consensus.
4. Results
A construct enables the analysis of social structures that can influence critical processes such as strategic planning. Therefore, we present the results according to the four stages outlined in the previous section. Table 3 reports the aggregate results of the paired comparisons based on algorithm 1. It should be noted that we obtained a consistency ratio of 0.016, which is ≤ 0.10, indicating that the construct is an adequate proxy for the context of strategic planning. Considering the results, we report the following order of relevance: commitment (W = 0.401) > plans development (W = 0.224) > organizational culture (W = 0.153) > managerial skills (W = 0.114) > communication (W = 0.108).
Aggregate results for the conceptual model
| Factors | Commitment | Communication | Managerial skills | Organizational culture | Plans development | Weights (W) | Consistency test |
|---|---|---|---|---|---|---|---|
| Commitment | 1 | 4.216 | 3.587 | 3.369 | 1.236 | 0.401 | λmax = 5.073 |
| Communication | 0.237 | 1 | 0.992 | 0.675 | 0.572 | 0.108 | CI = 0.018 |
| Managerial skills | 0.279 | 1.000 | 1 | 0.593 | 0.652 | 0.114 | RI = 1.12 |
| Organizational culture | 0.297 | 1.481 | 1.687 | 1 | 0.673 | 0.153 | CR = 0.016 |
| Plans development | 0.809 | 1.748 | 1.533 | 1.486 | 1 | 0.224 |
The obtained weights W (Table 3) also allow us to understand the intensity between the factors of the conceptual model. For instance, the ratio and , that is, appealing to commitment to the organization is prioritized as three times more important than managerial skills or even communication mechanisms. Subsequently, the comparison could suggest that strengthening the planning, coordination and monitoring process doubles the contribution of communication from an impact perspective. From an organizational policy perspective, the figures suggest that normative and affective factors are prioritized because they serve as bridges that can enhance strategic planning in contexts where resources are limited.
Regarding the network formation, each vector wi resulting from AHP was treated as the distinctive feature of each decision maker i. Based on this, the next step was to explore whether any patterns or relationships existed between the judgments made by each participant, which we achieved by using a similarity matrix.
In Figure 2, the denser areas represent a higher degree of affinity. In contrast, the less colored areas could be considered areas of divergence, suggesting that an underlying social mechanism influences judgments. Some statistics that describe the similarity matrix are: the average moderate level of similarity (), which could be considered as the diversity of perspectives associated deriving from the heterogeneity of roles, experience and training among participants. The median , which exceeded the mean, suggests that a proportion of participants achieve higher than average correlations, suggesting the presence of more aligned subgroups. As for the standard deviation (σs = 0.516), it indicates a trait of heterogeneity because some participants are strongly aligned [max(sij) = 1.000]. In contrast, others exhibit negative correlations [min(sij) = −0.895], indicating substantial disagreements in prioritization. It is worth mentioning that the proportion of pairs that exceeded the threshold τ = 0.75 was 34%, which not only allowed us to identify relationships of similarity but also variation, suggesting the presence of a structure susceptible to topological exploration, for which SNA was used (Ma et al., 2024; Verma et al., 2016).
 The square clustered heat map occupies the centre of the image. Dendrogram trees appear above the columns and along the left side of the rows, indicating hierarchical grouping. The matrix contains many small cells arranged in a grid. Several large dark square and rectangular blocks appear along the diagonal and nearby sections. Lighter regions fill surrounding areas. Row labels are listed vertically on the right edge as e numbers. Column labels appear along the bottom edge as e numbers rotated vertically. The pattern forms multiple clustered sections across rows and columns.
AHP vector similarity matrix
Source: Self-elaboration using R
The square clustered heat map occupies the centre of the image. Dendrogram trees appear above the columns and along the left side of the rows, indicating hierarchical grouping. The matrix contains many small cells arranged in a grid. Several large dark square and rectangular blocks appear along the diagonal and nearby sections. Lighter regions fill surrounding areas. Row labels are listed vertically on the right edge as e numbers. Column labels appear along the bottom edge as e numbers rotated vertically. The pattern forms multiple clustered sections across rows and columns.AHP vector similarity matrix
Source: Self-elaboration using R
Figure 3 illustrates the undirected and weighted graph resulting from the similarity matrix. G contains n = |V| = 110 vertices or employees and |E| = 2019 edges with a density of 0.337, that is, ≈ 33.7% of the possible links above the level of τ are present, which implies sufficient cohesion for the exchange of criteria (Brede, 2012). The average path length and the diameter diam(G) = 6, which limits the separation and implies high accessibility, since on average any pair of participants is < 2 steps away, while extreme cases do not exceed 6. The visualization is consistent with the global transitivity T(G) = 0.8526, which can be considered an indicator of triadic closure in preferences. Overall, the results suggest a cohesive topology that enables rapid production of prioritization criteria. Following this line of thought, we compared the empirical network and the Erdős–Rényi null model G(n, p), we find that the data structure is not random (Crane, 2018). That is, for a random graph with the same number of nodes and the same density (p ≈ 0.337), the expected clustering coefficient would be [CER] ≈ 0.337, with a 95% confidence interval between [0.324, 0.349]. This range reflects the consistency of the prediction under a purely random link formation process. However, the empirical network has an overall clustering coefficient of C(G) = 0.8471, which is more than twice the expected value under randomness, and an overall transitivity of 0.8526, meaning that participants tend to form interconnected groups more than expected in a scenario lacking organizational structure.
 The network diagram contains many circular labelled nodes connected by thin lines. Two large dense clusters appear, one on the left and one on the right. The clusters contain many internal connections. A narrow chain of several nodes links the two clusters across the centre. Additional smaller connected groups appear near the lower left of the left cluster. Three isolated nodes sit below the central area with no visible links. Each node is labelled with an e number.
Initial graph based on similarity matrix with threshold τ = 0.75
Source: Self-elaboration using igraph (Csárdi and Nepusz, 2006)
The network diagram contains many circular labelled nodes connected by thin lines. Two large dense clusters appear, one on the left and one on the right. The clusters contain many internal connections. A narrow chain of several nodes links the two clusters across the centre. Additional smaller connected groups appear near the lower left of the left cluster. Three isolated nodes sit below the central area with no visible links. Each node is labelled with an e number.Initial graph based on similarity matrix with threshold τ = 0.75
Source: Self-elaboration using igraph (Csárdi and Nepusz, 2006)
Regarding the distribution of degrees (Figure 4), we obtained a kmin = 0, a kmax = 56, a and a median of k0.5 = 37, meaning that the graph shows wide dispersion, as some decision-makers do not share sufficient similarity with their peers, while others are highly connected, involved in more than half of the possible connections (Brede, 2012). The Q1 = 28 and Q3 = 49 suggest that at least 50% of the participants have a medium to high range of connectivity. Figure 4 also illustrates a pattern of concentration around intermediate values. Regarding the drop in the right tail, we evaluated the fit using maximum likelihood and bootstrap testing, which indicate that the tail of the distribution is compatible with a power law starting at kmin ≈ 26, with exponent α ≈ 3.1. Although the goodness of fit was 0.19 when compared to a log-normal distribution, it was observed that this distribution fits better in intermediate segments of the distribution (Crane, 2018). Subsequently, to broaden the description of the graph, we illustrate its structure by coloring each collaborator’s department, educational level and seniority within the company, and we maintain the layout using the Fruchterman-Reingold algorithm (Fruchterman and Reingold, 1991).
 The scatter plot has Degree k on the horizontal axis and P of K greater than or equal to k on the vertical axis. The vertical scale ranges from 0.01 to 1.00. Data points begin near one at lower degree values. The points gradually decrease as degrees increases. Around the mid to high degree range, the decline becomes steeper. The highest degree values correspond to the lowest probabilities, dropping to below 0.01 near the far right.
Degree distribution
Source: Self-elaboration using R
The scatter plot has Degree k on the horizontal axis and P of K greater than or equal to k on the vertical axis. The vertical scale ranges from 0.01 to 1.00. Data points begin near one at lower degree values. The points gradually decrease as degrees increases. Around the mid to high degree range, the decline becomes steeper. The highest degree values correspond to the lowest probabilities, dropping to below 0.01 near the far right.Degree distribution
Source: Self-elaboration using R
When coloring the network by department (Figure 5), we observed that the right block is dominated by sales staff, with complementarity from employees in operations and finance. We also observe that executive managers comprise this group, but not brokers, as suggested by Yuan and van Knippenberg (2022) and Jinghua and Haiying (2023), which could create imbalances since their decisions tend to spread quickly within the block but do not reach the opposing module, resulting in gaps in execution. The figure also shows that the filtering and interpretation of information is shaped by management and sales personnel. For its part, the left block combines sales, marketing and operations personnel with the participation of finance employees, showing greater interdepartmental involvement, which suggests that consensus is based more on business logic or best practices than on formal hierarchy.
 The network diagram contains many circular labelled nodes connected by thin lines. Nodes are grouped into two large dense clusters, one on the left and one on the right, linked by a narrow central chain of nodes. Smaller connected groups appear near the lower left of the left cluster. Three isolated nodes sit below the centre with no visible links. Nodes use different colours matched to a legend. The legend lists Executive management, Finance, Management, Marketing, Operations, and Sales. Each node is labelled with an e number.
AHP vectors similarity graph (department-based)
Source: Self-elaboration using igraph (Csárdi and Nepusz, 2006)
The network diagram contains many circular labelled nodes connected by thin lines. Nodes are grouped into two large dense clusters, one on the left and one on the right, linked by a narrow central chain of nodes. Smaller connected groups appear near the lower left of the left cluster. Three isolated nodes sit below the centre with no visible links. Nodes use different colours matched to a legend. The legend lists Executive management, Finance, Management, Marketing, Operations, and Sales. Each node is labelled with an e number.AHP vectors similarity graph (department-based)
Source: Self-elaboration using igraph (Csárdi and Nepusz, 2006)
When depicting by educational level (Figure 6), we observe that the various profiles coexist without this factor modifying the structure. In other words, no pattern of homophily by educational level was observed; therefore, the visualization allows us to conclude that this factor does not affect the structural partitioning of the consensus. In this sense, the level of education or the diversity of profiles could be used more as a complementary resource to design functional bridges and translation mechanisms between departments.
 The network diagram contains many circular labelled nodes connected by thin lines. Two large dense clusters appear, one on the left and one on the right, linked by a narrow central chain of nodes. Smaller connected groups appear near the lower left of the left cluster. Three isolated nodes sit below the centre with no visible links. Nodes use different colours matched to a legend. The legend lists High school, Master, Undergrad, and Vocational. Each node is labelled with an e number.
AHP vectors similarity graph (education level based)
Source: Self-elaboration using igraph (Csárdi and Nepusz, 2006)
The network diagram contains many circular labelled nodes connected by thin lines. Two large dense clusters appear, one on the left and one on the right, linked by a narrow central chain of nodes. Smaller connected groups appear near the lower left of the left cluster. Three isolated nodes sit below the centre with no visible links. Nodes use different colours matched to a legend. The legend lists High school, Master, Undergrad, and Vocational. Each node is labelled with an e number.AHP vectors similarity graph (education level based)
Source: Self-elaboration using igraph (Csárdi and Nepusz, 2006)
Figure 7 shows the graph by seniority in the organization, and it can be seen that, in both modules, most nodes have between 1 and 5 or 6 and 10 years of experience, while veterans are less frequent. This also suggests that seniority does not foster communities. It should be noted that the nodes connecting the modules are mid-tenure. In organizational terms, this nuances the management and dynamics of change in participatory planning, as seniority does not lead to bottlenecks either.
 The network diagram contains many circular labelled nodes connected by thin lines. Two large dense clusters appear, one on the left and one on the right, linked by a narrow central chain of nodes. Smaller connected groups appear near the lower left of the left cluster. Three isolated nodes sit below the centre with no visible links. Nodes use different colours matched to a legend. The legend lists one to five years, six to 10 years, 11 to 15 years, and 16 to 20 years. Each node is labelled with an e number.
AHP vectors similarity graph (by seniority)
Source: Self-elaboration using igraph (Csárdi and Nepusz, 2006)
The network diagram contains many circular labelled nodes connected by thin lines. Two large dense clusters appear, one on the left and one on the right, linked by a narrow central chain of nodes. Smaller connected groups appear near the lower left of the left cluster. Three isolated nodes sit below the centre with no visible links. Nodes use different colours matched to a legend. The legend lists one to five years, six to 10 years, 11 to 15 years, and 16 to 20 years. Each node is labelled with an e number.AHP vectors similarity graph (by seniority)
Source: Self-elaboration using igraph (Csárdi and Nepusz, 2006)
Figure 8 shows the betweenness distribution, and for this metric, we obtained a median of 5.25, a maximum of 1307 and a mean of 67.15. Due to its asymmetry, this indicates that most employees play peripheral roles in the communication process, which allows us to say that a subset of participants modulates communication and becomes critical, as their position gives them the ability to control the transmission of priorities between groups in the network, in turn generating high dependence on these nodes concerning coordination between departments (Cinelli et al., 2022; Mackenzie and Barry Barnes, 2008). Therefore, we evaluated the tail of the distribution using the Cluaset-Shalizi-Newman procedure (Clauset et al., 2009) and found that a continuous power-law model adequately describes it with a threshold xmin = 293 and exponent α = 1.75, since when contrasting the likelihood against a log-normal distribution, we obtained LR = 1.75, p 1-sided = 0.04 and although the difference with the two-tailed test is marginal (p 2-sided = 0.08), overall, the idea of a small number of bridge nodes dominating the intermediation process above xmin is supported.
 The scatter plot has Betweenness k on the horizontal axis and P of Betweenness greater than or equal to k on the vertical axis. The horizontal scale ranges from one to above 1000. The vertical scale ranges from 0.01 to 1.00. Data points start above 0.50 at low betweenness values. The points decline steadily as betweenness increases. The decrease becomes steeper in the higher range. The largest betweenness values correspond to the lowest probabilities, falling to below 0.01 near the far right.
Betweenness distribution (log-log)
Source: Self-elaboration using R
The scatter plot has Betweenness k on the horizontal axis and P of Betweenness greater than or equal to k on the vertical axis. The horizontal scale ranges from one to above 1000. The vertical scale ranges from 0.01 to 1.00. Data points start above 0.50 at low betweenness values. The points decline steadily as betweenness increases. The decrease becomes steeper in the higher range. The largest betweenness values correspond to the lowest probabilities, falling to below 0.01 near the far right.Betweenness distribution (log-log)
Source: Self-elaboration using R
Concerning closeness (Figure 9), we obtained moderate values , suggesting that the current structure combines density and accessibility, which should reduce coordination problems or costs while accelerating the dissemination of agreements. However, a standard deviation of 0.070 and the range (0.38–0.71) indicate heterogeneous accessibility, i.e. values in the lower tail (CC ≲ 0.45) correspond to nodes that are systematically further from the core, which in turn may translate into delays or exclusions that affect consensus formation.
 The histogram displays Closeness on the horizontal axis and Frequency on the vertical axis. Values range from about 0.37 to 0.71. Light bars show the distribution of observations. A smooth density curve overlays the bars. The curve rises to a main peak near 0.52, dips slightly, then rises again near 0.59 before declining. Lower and higher ends contain fewer observations.
Closeness centrality distribution
Source: Self-elaboration using R
The histogram displays Closeness on the horizontal axis and Frequency on the vertical axis. Values range from about 0.37 to 0.71. Light bars show the distribution of observations. A smooth density curve overlays the bars. The curve rises to a main peak near 0.52, dips slightly, then rises again near 0.59 before declining. Lower and higher ends contain fewer observations.Closeness centrality distribution
Source: Self-elaboration using R
Reviewing closeness by department provided a better understanding of asymmetries in structural accessibility (Figure 10). For example, management exhibited greater accessibility , suggesting that middle managers are in positions that allow them to reach most people with few effective steps. Therefore, from the perspective of consensus building, they can quickly absorb and redistribute changes in priorities. Executive management reported a similar average , although with greater variability, consistent with heterogeneous forms of coordination and leadership among managers (Pongboonchai-Empl et al., 2025). In contrast, marketing exhibited the lowest average proximity but the highest relative variability (sd = 0.077), which could be considered a characteristic of subgroups that require more steps to reach the core where consensus is developed (Zhang and Lim, 2025). Finance and sales were in the middle (medians ≈ 0.574 and 0.529, respectively) but with greater heterogeneity. For example, finance combines highly accessible actors with others who are frankly distant (min. 0.391). At the same time, sales reported a minimum of 0.378, suggesting that department staff operate further away from the decision-making core. Based on the above, management and operations staff operate as hinges, while marketing condenses the periphery.
 The box plot compares Closeness Centrality across six departments on the horizontal axis: Executive manager, Finance, Management, Marketing, Operations, and Sales. The vertical axis ranges from about 0.37 to 0.71. Median values for most groups lie between about 0.50 and 0.58. Management has the highest upper range, extending above 0.70. Marketing has a median near 0.50. Sales and Management each show low outlier points near 0.38. Box and whisker spreads vary across departments.
Closeness centrality by department
Source: Self-elaboration using R (Csárdi and Nepusz, 2006)
The box plot compares Closeness Centrality across six departments on the horizontal axis: Executive manager, Finance, Management, Marketing, Operations, and Sales. The vertical axis ranges from about 0.37 to 0.71. Median values for most groups lie between about 0.50 and 0.58. Management has the highest upper range, extending above 0.70. Marketing has a median near 0.50. Sales and Management each show low outlier points near 0.38. Box and whisker spreads vary across departments.Closeness centrality by department
Source: Self-elaboration using R (Csárdi and Nepusz, 2006)
Figure 11 presents the top ten nodes considering betweenness and closeness as the primary ordering criteria. The results suggest at least two patterns: a) a core of brokers with high betweenness, such as employees 48, 46, 50, 65 and 14, who work as marketing analysts, management operatives, sales operatives, sales coordinators and sales operatives, respectively, concentrate the geodesic paths between modules (Muñoz-Valero et al., 2025; Chang et al., 2025). Some brokers exhibit a moderate degree and strength, such as e48 and e46, but high betweenness constitutes critical bridges that connect dense communities. In this sense, it is the operational profiles that control permeability between areas and modulate the transmission of AHP consensus between areas. However, dependence on these nodes increases the risk of bottlenecks as well as increasing departmental bias or the imposition of opinions; b) A group of local disseminators, including employees 50, 48, 31, 51 and 53 from the sales-operations, marketing-analysis, management-analysis and operations-analysis departments, respectively, reach the rest of the network through short distances, although they do not always function as bridges. In a sense, these nodes accelerate the communication, verification and adoption of ideas within their working groups, consolidating the execution of consensus-based courses of action (Hao et al., 2024; Bernstein et al., 2022; Bocoya-Maline et al., 2023). To better understand patterns at the local level, we identify subsets of decision-makers who are more connected not only to each other but also to the rest of the graph, because in terms of consensus coordination, communities provide us with information about preferences within the groups where agreements should emerge and spread faster.
 The top table is titled Sorted by betweenness. The bottom table is titled Sorted by closeness. Both tables have six columns: id, degree, closeness, eigenvector, betweenness, and strength. Each table lists 10 rows of node identifiers beginning with e numbers. Cells are shaded with varying intensity to represent relative values. In the top table, entries are ordered by descending betweenness values. In the bottom table, entries are ordered by descending closeness values. Numerical values are printed inside each cell.
Node-level metrics sorted by betweenness and closeness
Source: Self-elaboration using the results from igraph (Csárdi and Nepusz, 2006)
The top table is titled Sorted by betweenness. The bottom table is titled Sorted by closeness. Both tables have six columns: id, degree, closeness, eigenvector, betweenness, and strength. Each table lists 10 rows of node identifiers beginning with e numbers. Cells are shaded with varying intensity to represent relative values. In the top table, entries are ordered by descending betweenness values. In the bottom table, entries are ordered by descending closeness values. Numerical values are printed inside each cell.Node-level metrics sorted by betweenness and closeness
Source: Self-elaboration using the results from igraph (Csárdi and Nepusz, 2006)
To select an alternative, we compared the most frequently used community detection algorithms (Crane, 2018). Table 4 shows consistent results between Fast Greedy and Girvan-Newman, which replicated the same cut (Q ∈ [0.4286, 0.4332]), while, from a flow perspective, the Infomap algorithm found six communities; however, the difference is not substantial, as it only separates one additional microgroup. Therefore, considering modularity, we selected the Louvain algorithm for its performance (0.4340). The visualization of the selected algorithm displays two main modules: one, shaded in purple, with 58 nodes, and another, shaded in orange, with 48 vertices (Figure 12).
 The network diagram contains many labelled circular nodes connected by thin lines. Two large dense clusters dominate the image, one in the lower left and one in the upper right. Each large cluster is enclosed by a coloured translucent boundary shape. Several links connect these two clusters through a few bridging nodes in the centre. Three small separate groups appear near the middle and right side, each enclosed by its own boundary shape. One small group contains a single node on the right. All nodes are labelled with e numbers.
Louvain community
Source: Self-elaboration using igraph (Csárdi and Nepusz, 2006)
The network diagram contains many labelled circular nodes connected by thin lines. Two large dense clusters dominate the image, one in the lower left and one in the upper right. Each large cluster is enclosed by a coloured translucent boundary shape. Several links connect these two clusters through a few bridging nodes in the centre. Three small separate groups appear near the middle and right side, each enclosed by its own boundary shape. One small group contains a single node on the right. All nodes are labelled with e numbers.Louvain community
Source: Self-elaboration using igraph (Csárdi and Nepusz, 2006)
Comparison of algorithm modularity results
| Algorithm | Communities | Size | Modularity |
|---|---|---|---|
| Fast greedy | 5 | 59, 48, 1, 1, 1 | 0.4332 |
| Girvan newman | 5 | 60, 47, 1, 1, 1 | 0.4286 |
| Louvain | 5 | 58, 49, 1, 1, 1 | 0.4340 |
| Infomap | 6 | 58, 47, 2, 1, 1, 1 | 0.4317 |
This visualization made it possible to identify which departments those who control the flow of information belong to. Nodes 33, 64, 57, 101, 47 and 58 correspond to the sales department; nodes 26 and 48 belong to marketing; node 46 is part of the management team; and one node (34) belongs to the sales team. In functional terms, the configuration that generates consensus promotes local efficiency but systemic fragility, as the dependence on the nodes that control information is disproportionate (Muñoz-Valero et al., 2025; Bayrak, 2021). For example, the sales department introduces bottlenecks in the consensus process, which affects the strategic planning process due to the low participation of actors critical to sales, such as managers and salespeople, thereby distancing planning from a pluralistic vision. Subsequently, the viability and coordination of the planning process fail to meet at least the following aspects: reducing dependence on critical individuals, promoting faster exchange without falling into confirmation bias, and monitoring communication mechanisms (Bernstein et al., 2022).
Subsequently, we evaluated the extent to which each contributor’s structural position is associated with the way in which it aligns with their consensus. To do this, we estimated (proximityi ∈ [0, 1]), derived from the Euclidean distance of wi to the aggregate vector w*, as a function of network elements such as eigenvector (global prestige), betweenness, degree, understood as the ability to have effective contacts, and cohesion or clustering (Hao et al., 2024; Kogetsidis, 2023; Coucke et al., 2025). We consider that this specification statistically addresses assumptions derived from network analysis such as: a) brokers should be more exposed to heterogeneous perspectives; b) those with more connections and high cohesion should influence the triadic closure; c) an actor’s prestige could be aligned with the preferences or ideas of influential subgroups, which could lead to gaps or misalignment with the global consensus (Audretsch and Guenther, 2023; Tran et al., 2024). Considering the above, the linear model is expressed as follows:
The results related to the proposed model are presented below:
The model explains 42% of the variability in proximity to consensus, which is considered significant due to the complexity of communication or deliberation processes in organizational contexts. In this context, the network structure can be considered a proxy for the alignment of participants with the overall consensus.
Based on Table 5 and considering the test F(4, 105) = 20.41, p < 0.001 we rejected H0 (overall F-test significant), suggesting evidence of a global linear association between network characteristics or metrics and proximity to consensus. Given that heteroscedasticity was found, we present the inference at the coefficient level using robust standard errors and, considering the HC3 results, the eigenvector centrality showed a negative and significant coefficient , indicating that occupying prestigious positions or being connected to prestigious collaborators does not imply closeness or the ability to influence consensus, but rather is associated with less alignment. In the context of industrial SMEs, the result is consistent with the idea that certain actors can and should introduce cognitive heterogeneity in the face of group judgment. In contrast, degree or frequency of connections is positive and significant where each additional link is associated with ≈ +0.005 proximity points, that is, decision-makers with more effective contacts converge through social averages and greater exchange of criteria, generating a pull toward the midpoint of the group. As for the betweenness (p = 0.323) and clustering (p = 0.191) coefficients, they are not significantly different from zero under HC3, so neither the position nor role of the bridge nor triadic closure shows an independent marginal effect once prestige and volume of contacts are controlled for (Jochmans, 2022).
Linear model for proximity with robust inference (HC3)
| Predictor | Estimate | Robust SE (HC3) | t | p | 95% CI (HC3) |
|---|---|---|---|---|---|
| Intercept | 0.4933 | 0.0820 | 6.016 | < 0.001*** | [0.331, 0.656] |
| Eigenvector† | −0.0902 | 0.0266 | −3.391 | 0.001*** | [−0.143, −0.038] |
| Betweenness† | 0.0410 | 0.0412 | 0.994 | 0.323 | [−0.041, 0.123] |
| degree | 0.00514 | 0.00201 | 2.558 | 0.012* | [0.00116, 0.00912] |
| Clustering† | 0.0444 | 0.0337 | 1.316 | 0.191 | [−0.0224, 0.1112] |
| R2 | 0.438 | ||||
| Adj. R2 | 0.416 | ||||
| Residual SE | 0.087 (df = 105) | ||||
| Model F (OLS) | F(4, 105) = 20.41, p < 0.001 |
Collinearity was not problematic (VIF: eigenvector = 3.27; betweenness = 1.13; degree = 3.45; clust = 1.29). The deviation from normality of the residuals using Shapiro–Wilk was W = 0.950, p = 0.0004 with substantive heteroscedasticity (Breusch–Pagan BP = 71.04, df = 4, p < 10–9). In this sense, classical inference may underestimate uncertainty, so we consider robust standard errors for heteroscedasticity (HC3) and robust t contrasts for all coefficients. Given that proximity ∈ [0, 1], the specification was reviewed using a fractional regression, and the signs and relative magnitude of the effects are consistent. In addition, we inspected residuals, leverage, Cook’s distances (4/n) and partial linearity to rule out the disproportionate influence of individual cases. It is also worth noting that proximity and intermediation metrics were calculated with distance weights (transforming similarities wij to dij = 1/wij) to facilitate the interpretation of minimum paths when using unweighted metrics. Standard errors and t tests are HC3-robust (heteroscedasticity) (Jochmans, 2022). Predictors with superscript † are standardized; degree is in number of links. The 95% CIs were calculated with t-quantiles (df = 105). Point estimators and R2 are OLS; Significance codes: ***p < 0.001, **p < 0.01, *p < 0.05
5. Discusion
The aggregate results we obtained for the conceptual model (Table 3) coincide with the contributions of López-Torres et al. (2023), Vásquez-Ruiz et al. (2024) and Michie et al. (2006), which broadly suggest that the rationality of the hierarchical model is oriented toward implementation. In this regard, we can infer that the study participants considered that the most relevant aspect is, first, to ensure the behavioral disposition and norms that guide and sustain collective effort, which is consistent with the idea that the results of strategic planning depend on mechanisms that stabilize coordinated effort and reduce organizational friction (Zhang and Lim, 2025; Christie and Tippmann, 2024; Hooi, 2021). A second point is the ability to translate objectives into clear courses of action without neglecting the cultural component, as it can serve as a coordinating axis for collective agreement, especially if culture is viewed from a systemic perspective and operates at different levels as a social infrastructure to promote cooperation, adaptation to change and learning capacity. We consider it pertinent to mention that, unlike the ideas of Ma et al. (2024), Molina-Abril et al. (2025) and Thomas et al. (2009), our model suggests that both managerial skills and the volume and form of information exchange, although relevant, are of lesser relative importance. In a way, this asymmetry should not be understood as a denial of the role of communication or leadership, but rather as a result that emphasizes that, in industrial SME contexts, the viability of strategic actions is primarily based on normative and, at times, affective aspects that tend to activate and sustain cooperation, and only then on managerial capabilities and styles of exchange, which tend to be effective when the organization already has anchors of commitment and minimal coordination routines in place.
Turning back to the methodological framework adopted, it should be noted that the multivariate networks perspective was used because the network studied arises from the similarity between vectors obtained through the application of AHP, meaning that the network analyzed does not represent communication between nodes but rather cognitive proximity from the perspective of consensus formation. This perspective differs from the proposals of Wang et al. (2023), Greco et al. (2025), Vásquez-Ruiz et al. (2024) who adopt a more optimization-focused algebraic framework, as well as Mirbagheri et al. (2023) and Chang et al. (2025); Bocoya-Maline et al. (2023) who suggest approaching the issue from the perspective of structural equations and focusing on the causality of consensus to generate conceptual recommendations and recommendations on the functioning dynamics of work teams. In our case, the methodological distinction we make shifts the analysis from “which node communicates with which node” to “who prioritizes similarly to whom,” which allows us to approach consensus from a relational structure of preferences perspective. From this perspective, the results derived from multi-criteria tools such as AHP are interpreted as a space of preferences that allows for a reading in which the topology of G serves as a proxy for the degree of alignment and the possible underlying coordination mechanisms. Therefore, in agreement with Fadda et al. (2022); Huang et al. (2023), the application of SNA becomes relevant since metrics such as density, transitivity and modularity can inform about the degree of cohesion of collective judgment and about the existence of substructures where agreements stabilize more quickly; otherwise, low values or pronounced partitions would suggest poor integration of views and, therefore, higher coordination costs (Ma et al., 2024; Bernstein et al., 2022). In line with this idea, the literature has noted that network measures have evolved from being descriptors to also functioning as indicators of collective judgment alignment and agreement diffusion, thus offering a systemic perspective on social systems (Aalbers et al., 2014; Wu et al., 2020).
Regarding the structural results of the network, our findings converge with those proposed by Fadda et al. (2022), Molina-Abril et al. (2025) and Cinelli et al. (2022), as we observed a typical tension in idea generation or consensus-building processes in organizations. In other words, on the one hand, we observed a topology that was sufficiently cohesive to sustain coordination. However, we observed features of stratification and functional concentration that could introduce vulnerabilities into an organizational system. In particular, the observed degree distribution suggests that actors with a high convergence of preferences were found with respect to a large fraction of the network, which is considered consistent with the notion that connectivity promotes alignment through repeated exposure to shared criteria and through the averaging of preferences in social terms (Ma et al., 2024; Bernstein et al., 2022). However, unlike perspectives based solely on structural or multi-criteria (Morton and Iglesias Ruiz, 2024; Marchiori et al., 2022), the SNA allowed us to identify the simultaneous presence of nodes with low connectivity, reflecting cognitive heterogeneity and areas of disagreement that can introduce tensions into consensus. Let us consider this critical point, as such tensions should not necessarily be understood as dysfunctional. That is, under conditions of organizational alignment, they could operate as a source of cognitive diversity, expand the space for alternatives, and strengthen strategic deliberation, avoiding superficial consensus that appears only to be coordination (Bernstein et al., 2022; Michie et al., 2006). Considering what has been said so far, the empirical contribution does not simply lie in affirming that more consensus is always better, but in showing how the structure of similarity contains, in turn, a core of alignment as well as the relevance of the periphery, which can be interpreted as reservoirs of variety useful for maintaining organizational adaptability.
The exploration of the graph by departments, whose visual partitioning suggests that cognitive proximity is not distributed homogeneously but rather organized modularly, with areas such as sales, operations and finance dominating the configuration of agreements, converges with the idea that organizational structure and coordination influence the formation of sub-consensus and the dissemination of priorities (Liebowitz, 2005; Grady et al., 2015), particularly in planning processes under resource constraints and functional asymmetries. However, in a descriptive sense, the fact that a block is dominated by sales personnel and complemented by the areas mentioned above would imply that consensus is based on execution and commercial performance logic. In contrast, a more pluralistic block suggests that agreements could be established by the convergence of shared practices rather than by formal hierarchy. Based on the above, it is possible to say that, even with overall cohesion, modularity can fragment planning and create implementation gaps if consensus and agreements do not circulate beyond departmental boundaries (Zhang and Lim, 2025; Muñoz-Valero et al., 2025).
This is complemented by the results at the node level (Figure 11), as they support the coexistence of different structural roles that impact consensus in at least two ways: on the one hand, the presence of brokers with high intermediation would indicate that only a fraction of actors concentrate geodesic routes between modules, i.e. increasing dependence on specific nodes to connect other groups with different preferences (Mirbagheri et al., 2023; Hao et al., 2024). This characteristic coincides with a scenario in which consensus-building becomes fragile, where coordination mechanisms may be efficient at the local level but systemically vulnerable to information saturation or the unavailability of intermediaries. On the other hand, identifying nodes with high closeness but not necessarily bridges suggests an alternative mechanism in which the acceleration of agreement dissemination within communities enables the consolidation of local consensus for implementation (Thomas et al., 2009). Therefore, node-level metrics revealed a heterogeneous topology in which certain nodes support connectivity between groups, while others enable rapid intra-community adoption, which aligns with the idea that effective coordination simultaneously requires permeability between modules and efficiency within groups (Bernstein et al., 2022; Shan and Mostaghim, 2024).
Based on what has been mentioned so far, the linear model complements the structural analysis and empirically contributes to the limited systemic view of the problem indicated by Cinelli et al. (2022), Coucke et al. (2025) and Shan and Mostaghim (2024). In this sense, and based on the results, it is possible to say that proximity to consensus does not depend uniformly on being central in an organization, but rather on the type of centrality and the associated relational pattern. This contrasts with the findings of Audretsch and Guenther (2023), Audretsch et al. (2023) and Greco et al. (2020), who agrees that consensus depends heavily on how central an actor is in the organizational chart. In particular, in our model, the negative coefficient and the significance of the eigenvector centrality suggest that occupying prestige positions or being associated with actors with high prestige do not indicate better alignment with the aggregate consensus. We consider this relevant because it questions the implicit assumption of the normative approach that having prestige in certain organizational systems mechanically leads to convergence or directly influences decision-making and planning processes.
Considering the results of the linear model and the graph topology together enabled us to describe the underlying mechanism: consensus should be understood as a systemic property, since it does not emerge automatically from central nodes. For example, eigenvector centrality (prestige) is associated with less alignment (differentiation), while degree (number of effective links) is associated with greater proximity to consensus. In contrast, intermediation and cohesion describe structural roles relevant to interpreting the architecture of preferences, but their marginal effects are not statistically different from zero once prestige and contact volume are controlled for (van der Heijden, 2023; van Kuppevelt et al., 2022; Shan and Mostaghim, 2024).Within this framework, for strategic management, it should be noted that three predictors are standardized, while the degree is not; therefore, a direct comparison of magnitudes must be based on the t-values and standard errors on the coefficients in the original scale (Ma et al., 2024). From a methodological point of view, the relevant finding is considered operational: consensus is not the automatic result of prestigious nodes, but rather of configurations that connect communities and densify neighborhoods of deliberation. The design of participatory processes that maximize cross-sectional exposure and local cohesion, while managing the uniqueness of high-eigenvector nodes, can shorten alignment times and improve traceability between planning and execution.
6. Implications
In summary, the information derived from AHP was not only analyzed as an aggregate of criteria; the SNA also enabled this information to be analyzed as a relational space and to identify patterns of alignment and heterogeneity. The articulation between AHP → similarity network → linear model enabled the objective of proposing an analytical framework for evaluating consensus information. In this way, the second objective was achieved, namely, transforming the AHP results into a similarity matrix. The third objective was achieved by estimating the linear model and describing the underlying mechanism in the network. Although the proposed framework does not replace the prioritization algorithm, it does have some implications.
From a theoretical perspective, we consider two aspects. First, when applying the AHP, we prioritize the factors that decision-makers in an industrial SME should consider relevant to improving the planning process. In addition, we use each participant’s priority vectors as input for network analysis. Our work differs from other approaches, such as those based on system dynamics or structural equation modeling, which allow for the evaluation and comparison of causal relationships among latent variables. However, the interpretation of these tools is based on assumptions about measurement and collinearity (Audretsch et al., 2023; Michie et al., 2006). Although useful, these instruments are not usually the most informative when the objective is to prioritize and bring factors into the operational sphere in social or organizational contexts. In contrast, applying AHP transforms an initially unstructured problem into a structured network problem that incorporates expert judgment, thereby promoting the design of actions aligned with participatory strategic planning (Ma et al., 2024). Second, from a systemic perspective, we incorporate a relational criterion that the planning literature has addressed from different approaches. To do this, we use AHP priorities to design a network of similarities among decision-makers, allowing for both meso and micro-level analysis using measures such as density, triadic closure, modularity and intermediation functions. From a theoretical perspective, this links consensus-building to the social architecture that promotes or limits it.
In terms of practical implications, the work of Zhao et al. (2024), van der Heijden (2023) and Chong and Benli (2005) suggests that prioritizing factors does not fully capture the gap between planning and the social mechanisms that lead to implementation, i.e. complementarity between prioritization and organizational design is necessary (van Kuppevelt et al., 2022). The results obtained address this complementarity by first evaluating and prioritizing criteria using the AHP method. Second, using the SNA to identify not only who can convey consensus and with what fractions, but also the pattern within the network. Organizational architecture can foster rapid local consensus, but it also increases the risk of bottlenecks by relying on a few intermediaries. Based on this idea, organizational design should be adjusted to focus on coordination and control at all levels (Molina-Abril et al., 2025) to reduce intermediation concentration by duplicating critical links. This can be achieved by identifying and appointing spokespersons within and outside working groups, as well as by designing alternative communication channels (López-Torres et al., 2023). In addition, to improve participation in planning processes, managers could periodically collect and synthesize employee information using AHP to visualize consensus through strategic maps and visual dashboards. We also suggest redistributing effective contacts and avoiding overburdening prestigious actors as sole spokespersons, as their role should be to introduce cognitive diversity rather than monopolize dissemination. Furthermore, improve feedback mechanisms and the autonomy of work cells by using the proposed cycle: AHP → SNA → coordination adjustments.
7. Conclusion
Improving operations in strategic areas for SMEs, such as the sales department, requires not only staff involvement but also the harmonization of organizational structure, intelligence or strategy mechanisms, and coordination systems with the commercial strategy, while considering incentive schemes that facilitate implementation. Within this framework of ideas, our work addressed the challenge from a systemic perspective, proposing a framework to integrate and extend the capabilities of AHP, relying on the relational architecture underlying a network of similarity among decision-makers, linking structural position with consensus building. With this approach, we aim to provide decision-makers in industrial SMEs with greater insights.
Our approach to the problem adopted systemic thinking as an alternative to approaches that vertically treat social or organizational issues. In this regard, we relied on methodological complementarity to suggest that consensus building can be treated as a co-production initiative rather than a top-down design, without neglecting the relationships present in a system, such as the function present in the factors evaluated with AHP; the network structure that shows how these criteria circulate and consolidate; and the environment that could be observed in the commercial constraints and demands that affect adoption. Regarding the usefulness that consensus building could represent for executives or managers of industrial SMEs, it could be managed by complementing analytical tools that promote a learning cycle. In this sense, AHP can be used, in addition to prioritizing, to identify the factors that require investment of time and resources, as well as to translate decisions into a network that is subject to monitoring, allowing for the detection of deviations from objectives and the implementation of adjustments to the structure of working groups. We believe that adopting the approach outlined above could offer quality in terms of how to align organizational structure with strategic planning, that is, adjusting roles and links between areas by designing operational objectives linked not only to organizational metrics but also to network metrics, such as intra-team density, proximity between areas or distance to consensus, considering factors such as departmentalization and trying to incorporate incentives that promote exposure or closure of communication. From a systemic perspective, the synergy between collaborators, processes and information could be observed in the design of a viable network with greater accessibility and less fragility. The proposed framework (AHP prioritization, network diagnosis and monitoring with the proximity model) can be used to improve consensus, which can help decide what to change, where to intervene, and how intensely coordination can be exercised to close the gap between strategic planning and execution.
Ultimately, this work explored the concept of expanding the capabilities of AHP. In addition, our findings emphasize the importance of understanding before implementation to generate or articulate actions that prioritize the flow of information within an organization. Adopting a systemic approach proved helpful as a framework that allowed for the combination of analytical tools.
Regarding the question of how and to what extent organizational design shapes consensus and decision-making, our results suggest that proximity to consensus is associated with structural position. In particular, the degree of each node is related to greater alignment , while eigenvector centrality has a weaker association (hat β1 = −0.0902, p = 0.001), i.e. employee prestige does not imply being closer to consensus and may even introduce noise into the consensus and planning process. However, if certain factors such as prestige, frequency or volume of contacts, intermediation and triadic closure are controlled, no independent marginal effect was observed (betweenness p = 0.323; clustering p = 0.19). In addition, the model’s overall contrast allowed us to reject the null hypothesis, so the findings are consistent with the alternative hypothesis in that at least one structural descriptor contributes to explaining variation in proximity to consensus.
On the other hand, this work is not without limitations. Among the limitations identified, we note that our study was based on a single case study of a medium-sized organization, so the results should be considered with caution. In other words, our findings should be understood as analytical generalizations related to the proposed mechanism, rather than as statistical generalizations for all SMEs. In addition, the network analyzed is not dynamic, and the nature of the information prompted revisions with fractional regression. Therefore, for future research, we suggest conducting longitudinal analyses and replicating them across different departments. In addition, an exponential random graph model (ERGM) analysis should be performed to evaluate relational dependencies. We also believe that the study offers academics and professionals a path to discuss the application of collaborative action research, providing a flexible framework for collecting and analyzing data to translate this information into meaningful actions.
