


Choosing the right contractor is very important for the successful management of construction projects, especially when it comes to road maintenance. In order to improve the contractor for road maintenance, this study aims to create a thorough and efficient multiple-criteria decision-making (MCDM) model that goes beyond price-only assessments to include a wider range of criteria.
The study used both the Fuzzy Analytic Hierarchy Process (F-AHP) and the Technique for Order Preference by Similarity to the Ideal Solution (TOPSIS). There were six main groups of 26 sub-criteria: Contract Bid Price and Financial Capacity, Technical Capacity, Experience, Management Capacity, Safety and Environment. F-AHP was used to figure out how important each of these groups was compared to the others. TOPSIS was then used to rank possible contractors based on these weighted criteria.
The analysis showed that some criteria were especially important when choosing a contractor. Bid Price, Financial Performance, History of Non-Performance of Contracts, and Timely Completion of Projects were the most important factors in deciding whether a contractor was right for the job. These results show how important it is to use both financial and performance-related indicators when evaluating the appropriate contractor.
By addressing significant flaws in the conventional selection model, this study offers a fresh methodical approach to contractor evaluation. It provides a standard for enhancing the Roads Administration's procurement procedures and establishes a strong basis for upcoming studies and policy creation targeted at boosting accountability, efficacy and transparency in the execution of road maintenance.
1. Introduction
1.1 Background
The selection of contractors for road maintenance projects is a critical decision-making process that directly impacts the quality, cost and timeliness of infrastructure development. In Ethiopia, where road networks form the backbone of economic growth, the Ethiopian Roads Administration (ERA) faces numerous challenges in identifying the most suitable contractors for maintenance projects. These challenges include financial constraints, varying environmental conditions and the need for long-term sustainability in road infrastructure (Belay et al., 2022; Birhan, 2022). The predominant reliance on the lowest bid method often leads to delays, cost overruns and compromised project quality, undermining the sustainability of the road network (Aminbakhsh et al., 2013; Ogunsanmi, 2013). Unlike building maintenance projects, road maintenance involves unique complexities such as terrain adaptability, pavement rehabilitation, traffic management and minimizing environmental and social disruptions. In addition, generic contractor selection criteria fail to account for these distinct requirements, resulting in inefficiencies and unsatisfactory project outcomes (Zavadskas et al., 2009; Hadidi and Khater, 2015).
The existing contractor selection methods for road maintenance fail to incorporate a comprehensive evaluation of contractors' technical capabilities, past performance, management capacity and adherence to safety and environmental standards. This narrow focus on financial bids leaves the ERA vulnerable to selecting contractors ill-equipped to handle the complexities of road maintenance projects, including traffic management, terrain challenges and long-term sustainability (Gituro and Mwawasi, 2016; Kishore et al., 2020). Given the budgetary limitations at the national level, optimizing contractor selection through an integrated, multi-criteria decision-making approach is essential. Such optimization can significantly reduce inefficiencies, improve project outcomes and ensure the effective allocation of scarce resources.
The contractor selection has evolved significantly over the years, with numerous studies emphasizing the importance of multi-criteria decision-making (MCDM) techniques in addressing the complexities of contractor evaluation. MCDM methods such as the Analytical Hierarchy Process (AHP) and the Technique for Order Preference by Similarity to Ideal Solution (TOPSIS) have been widely adopted to facilitate a more balanced and comprehensive evaluation of contractors. These methods allow decision-makers to consider both qualitative and quantitative factors, such as financial stability, technical capability, past performance and sustainability, thereby enabling a more informed and effective selection process (Marzouk et al., 2013; Aghazadeh et al., 2022). An ineffective contractor selection process can adversely affect future decisions (Aje et al., 2009; Jokar et al., 2020). Most of the time, the selection of a Contractor takes place purely based on the lowest bid instead of the best value criteria (Nguyen et al., 2018). Mostly, a bidder is selected based on the lowest cost, a practice that might not guarantee the lowest cost upon completion due to potential claims, litigation during construction, project delays and poor work quality (Khoso and Md Yusof, 2020).
For maintenance work, Contractor selection have been used various methodologies (Antuchevičiene et al., 2010; Jembere et al., 2020). The contractor selection process requires evaluating numerous qualitative and quantitative criteria, such as financial stability, technical capability, quality assurance and past performance. MCDM approaches, such as AHP and TOPSIS, are widely used to facilitate such evaluations. The advantages of AHP in structuring complex decision-making problems hierarchically, enabling decision-makers to derive priorities among criteria systematically (Ibadov, 2015; Acheamfour et al., 2023). Similarly, TOPSIS has been praised for its straightforward approach in ranking alternatives based on their closeness to the Ideal Best and Ideal Worst solutions (Abdul Jawwad and Abunaffa, 2022; Shume and Mitikie, 2024).
The Ethiopian Roads Administration (ERA) faces unique challenges in contractor selection, including budget constraints, diverse environmental conditions and varying contractor capabilities (Asrat, 2020; Ayfokru et al., 2023). The integration of fuzzy AHP and TOPSIS offers a promising solution by combining the benefits of structured hierarchy analysis and precise ranking mechanisms under uncertainty (Alhyari and Hyari, 2024; San Cristóbal, 2012). The Fuzzy AHP method, which is formed with the integration of the fuzzy logic and the AHP methods, was also frequently utilized. It was also observed that the integration of different MCDM methods can be an effective tool for Contractor selection and evaluation (Singh et al., 2017). Fuzzy MCDM performance ratings and weights are usually represented by fuzzy numbers. An alternative is calculated by aggregating all criteria weights and alternative ratings, where alternatives with a higher utility are preferred (Fong and Choi, 2000; Palczewski and Sałabun, 2019). A linguistic variable is a variable that applies words or sentences in a natural or artificial language to describe their degree of value (Ruppert and Duncan, 2017; Çelikbilek and Tüysüz, 2020; Keikha, 2022).
Expert opinions are quantified, allowing the alternatives to be ranked on a numerical scale. A detailed explanation of the AHP approach (Saaty and Vargas, 2012). The analytic hierarchy process (AHP) is a powerful method to solve complex decision problems. Any complex problem can be decomposed into several sub-problems using AHP in terms of hierarchical levels, where each level represents a set of criteria relative to each sub-problem (Huang et al., 2011). TOPSIS is based on the concept that the chosen alternative should have the shortest geometric distance from the positive ideal solution (PIS) and the longest geometric distance from the negative ideal solution. In practice, TOPSIS has been successfully applied to solve selection (evaluation) problems with a finite number of alternatives because it is intuitive and easy to understand and implement (Behzadian et al., 2012; Pandey et al., 2023; Safa et al., 2016).
Road projects demand distinct considerations, including terrain adaptability, traffic management, pavement durability and minimizing environmental and social disruptions (Holt, 2010; Huang, 2011). These factors necessitate a tailored approach to contractor evaluation that differs from those used in building projects (Parvaneh and El-Sayegh, 2016).
Improper contractor selection causes serious problems during project delivery, including poor quality, schedule delays and resulting cost overruns, sometimes leading to project suspension or failure. In many public and governmental projects, officials select the lowest-priced bid if the bidder meets the minimum technical score set by the authority, regardless of other qualitative or performance criteria. This price-driven approach is irrational from a project management and value-for-money standpoint and therefore requires critical review and revision (Mergawy et al., 2023). A substantial body of empirical research in procurement evaluation needs to be demonstrated and practiced, contract award decisions continue to be predominantly driven by price considerations. Consequently, comparatively lower weight is assigned to non-price criteria such as technical capacity, past performance, management systems and environment, safety and health (ESHS) capability within the overall evaluation framework (Enyinda et al., 2011).
The selection of inappropriate contractors has a markedly adverse impact on project performance. Although many projects are still awarded primarily based on the lowest bid, a price-only selection strategy entails substantial risk. First, there is an increased likelihood of deficient quality. Contractors who lack adequate technical competence, relevant experience or sufficient resources frequently deliver substandard work, which in turn necessitates rework, prolongs project duration, and degrades the overall quality of the final asset. Second, the probability of cost overruns is elevated. Inaccurate cost estimation and weak resource planning and control can generate unforeseen expenditures and contribute to schedule slippage, undermining the reliability of initial budgets and timelines.
Third, schedule performance is compromised. When a contractor's technical, managerial or logistical capacity is misaligned with project requirements, contractual milestones are more likely to be missed, resulting in cascading delays and potential liquidated damages or other penalties. Fourth, safety risks are exacerbated. Deficient safety management systems, inadequate workforce training and poor regulatory compliance increase the incidence of accidents, legal liabilities, work stoppages and associated reputational damage. Fifth, the frequency of disputes and related reputational harm tends to rise. Insufficient prequalification and due diligence processes heighten the occurrence of contractual disputes, claims and litigation, further contributing to project delays and transaction costs.
Collectively, poor contractor performance erodes trust among key stakeholders including clients, investors, regulatory bodies, and subcontractors thereby jeopardizing opportunities for future work and diminishing the project owner's capacity to secure subsequent projects (Okereke et al., 2022).
Effective contractor selection is vital to meet project time, cost and quality targets. Prequalification should therefore assess a broad set of criteria tender price, completion time, technical and managerial competence, past experience, safety record and financial strength to identify the most suitable contractor. The choice and weighting of these criteria strongly influence project success. Recent studies recommend Multi-Criteria Decision-Making (MCDM) methods such as AHP, ANP, TOPSIS and fuzzy logic approaches for contractor selection, as they systematically combine technical capacity, performance history, managerial capability and Environmental, Social, Health, and Safety (ESHS) factors often overlooked in price-only awards (Fawzy et al., 2024).
International road procurement guidance (e.g. World Bank and PBC) requires prequalification and assessment of performance and ESHS, addressing weaknesses in price-only approaches and supporting performance-based and prequalification methods. The evaluation method and criteria must follow the borrower's Project Procurement Strategy for Development. Bidders must first meet predefined minimum criteria such as historical contract performance and average annual construction turnover on a pass-fail basis; bids that do not meet these are rejected (Antoniou et al., 2012). The transition toward Performance-Based Road Contracts (PBRCs) reflects an acknowledgment that procurement strategies relying primarily on lowest-price selection are inadequate for ensuring sustained service quality over the asset's life cycle. PBRCs base payment on clearly defined, measurable performance indicators and emphasize contractor technical capacity, quality management systems and effective supervision (Gajurel, 2014). The integration of the Fuzzy–Analytical Hierarchy Process (Fuzzy-AHP) with the Technique for Order of Preference by Similarity to Ideal Solution (TOPSIS) is suitable for the selection of road maintenance contractors, as such decisions are intrinsically multicriteria, frequently involve conflicting objectives, and are characterized by substantial uncertainty. In developing-country contexts such as Ethiopia, contractor assessment processes seldom rely on complete or strictly quantitative datasets. Instead, decision-making is predominantly guided by expert judgment, prior experience and qualitative descriptors such as good performance or adequate equipment.
Fuzzy logic provides a rigorous mathematical framework for representing and processing such linguistic assessments, thereby facilitating the explicit modelling and management of uncertainty and imprecision in the decision-making process (Mitikie et al., 2026). The selection of road maintenance contractors requires the systematic evaluation and trade-off of multiple criteria, including technical competence, financial capacity, equipment ownership and availability, historical performance, safety practices and regulatory compliance. The combined application of Fuzzy-AHP and TOPSIS allows decision-makers from diverse professional backgrounds, such as engineers, procurement specialists and administrative personnel, to articulate their preferences and assessments using linguistic variables rather than being constrained to precise numerical inputs. This feature is especially pertinent in the Ethiopian institutional context, where procurement and contractor selection decisions are typically reached through consensus-oriented deliberations and where expert opinions may diverge due to heterogeneous regional conditions and project-specific characteristics.
Another key justification for employing Fuzzy-AHP in conjunction with TOPSIS is its capacity to attenuate subjectivity and bias in public-sector decision-making processes. Contractor selection in Ethiopia, like other developing countries, is highly sensitive and demands elevated levels of transparency and accountability (Shume and Mitikie, 2024). Using systematic pairwise comparisons and consistency checks, Fuzzy-AHP establishes a rational, traceable and verifiable procedure for determining the weights of evaluation criteria. This, in turn, enhances the credibility and defensibility of the resulting decisions and promotes equitable competition among contractors. TOPSIS complements Fuzzy-AHP by providing a simple yet powerful method for ranking road maintenance contractors once the criteria weights are established. The method is based on the intuitive concept that the best contractor should be closest to the ideal solution and farthest from the worst solution. This logic is easy for decision makers and stakeholders to understand, which is particularly valuable in Ethiopia, where procurement decisions must often be justified to oversight bodies and the public.
The integration of Fuzzy-AHP and TOPSIS is particularly appropriate for handling the heterogeneous nature of the data employed in contractor selection. In the Ethiopian context, certain criteria such as bid price or the number of equipment are inherently quantitative, whereas others such as managerial capability, technical reputation and past performance are qualitative in nature. The combined methodology enables the concurrent evaluation of both data types without resorting to excessive simplification, thereby yielding more balanced and realistic contractor rankings. Furthermore, from an implementation standpoint, the Fuzzy-AHP–TOPSIS framework is well-suited to developing-country conditions, as it does not rely on sophisticated data infrastructure or advanced computational software.
To address these challenges, this study proposes an integrated decision-making model combining FAHP and TOPSIS. FAHP is used to handle the subjective and imprecise nature of evaluating contractor selection criteria, while TOPSIS ranks contractors based on their proximity to ideal solutions across multiple criteria (Afolayan et al., 2020). This approach ensures a balanced evaluation by incorporating both quantitative and qualitative factors, such as technical capacity, financial stability and environmental sustainability (Matić et al., 2019; Koc et al., 2023; Chatterjee et al., 2018). The main objective of this research is to propose an integrated Fuzzy AHP-TOPSIS model for selecting Road maintenance contractors, ensuring a systematic, efficient and objective decision-making process in the case of the Ethiopian Roads Administration.
2. Research methodology
2.1 Research design
The study employed a multi-method approach, incorporating both quantitative and qualitative research methods. This approach was used to gather the necessary information to meet the study's objectives. The study utilized the integration of FAHP and TOPSIS methods to complete the research. Initially, an extensive literature review of related studies was conducted to determine the criteria for selecting Contractors for road maintenance projects. Following this, an expert-based questionnaire survey and discussion method were employed to finalize and categorize the Contractor selection Main and sub-criteria. Finally, the FAHP method was used to assign weights and prioritize the weighted criteria according to their importance and the TOPSIS method was applied to rank the best Contractor by analyzing the best and worst scenarios according to the weight of the criteria for the Contractor selection process.
2.2 Population and sample
The population for this study comprises procurement officers directly involved in the contractor selection and procurement evaluation processes within the Engineering Procurement Directorate Director of (ERA), who are directly involved in administering the maintenance works. A purposive sampling method was employed to ensure that participants with relevant expertise and substantial experience in the contractor selection process were included. The purposive sampling technique focuses on obtaining detailed, high-quality information from knowledgeable respondents. To gather all the necessary information, primary data were gathered using questionnaire surveys and document analysis, while secondary data were gathered from literature reviews. The present study utilized a questionnaire for experts participating in the selection works for the FAHP study. The first procedure was designed based on a summary of the comprehensive literature review, highlighting sets of criteria. Then the questionnaire is designed based on the findings of content analysis and measures of frequency responses to the questionnaire.
Finally, the study questionnaire was created using a pairwise comparison matrix analysis with fuzzy scales. Questionnaires were administered to experts in the engineering procurement department who participated in the contractor selection process. The survey experts, who were asked to complete a questionnaire, were chosen for the study based on their expertise, experience and knowledge of the issue.
2.3 Fuzzy analytical hierarchy process
Multiple-criteria decision-making (MCDM) is regarded as a sophisticated decision-making process that incorporates both quantitative and qualitative variables. To select the most likely ideal solutions, a number of MCDM strategies and approaches have recently been proposed (Balioti et al., 2018). The Analytical Hierarchy Process (AHP) approach is also suitable primarily for challenges involving several evaluation criteria and ambiguous scenarios. Real-world decision-making typically occurs in fuzzy situations. This is because human judgment is typically ambiguous and cannot be described with a precise term known as fuzzy.
Fuzzy multiple criteria decision-making for selecting the best selections from a variety of options may be better described as decision-making. Crisp statistics fall short in MCDM to faithfully portray real-world situations, but we employ linguistic variables to provide a more thorough explanation of a criterion's degree. A linguistic variable expresses the degree of its value through statements in a natural or artificial language (Ayalew et al., 2022). The fuzzy sets introduced integrated with AHP, referred to as FAHP, as a common method for handling imprecision in AHP. The newly suggested concept of a fuzzy set seeks to resolve the fuzziness and uncertainty in actual problems (Ayfokru et al., 2023).
By incorporating triangular fuzzy numbers into the pairwise comparison matrix using fuzzy set theory, the integrated FAHP approach was able to improve the subjective, incorrect and fuzzy issues. FAHP is a popular strategy for resolving multi-criteria decision-making issues because it can handle uncertain and inaccurate assessments by addressing linguistic variables. This integrated approach, which has been successfully used in other fields, preserves the benefits of AHP (San Cristóbal, 2012; Taylan et al., 2018; Araújo et al., 2015). The FAHP technique is frequently used to resolve multi-criteria decision-making problems in a range of fields because of the aforementioned benefits in dealing with uncertain and imprecise judgments by addressing linguistic variables. To handle the imprecision in AHP, exact numbers are replaced with fuzzy numbers representing linguistic expressions in FAHP. This tolerates vague judgments by assigning membership degrees to exact numbers to describe the extent to which these numbers belong to an expression (Shume and Mitikie, 2024; Pekuri et al., 2015). This integrated method maintains the advantages of AHP. Triangular fuzzy numbers (TFNs) are the most widely used method for representing judgments. The operational laws of the TFN A1= (a1, a2, a3) and A2 = (b1, b2, b3) are presented in the following equations:
Addition of the fuzzy number
Multiplication of the fuzzy number
Subtraction of the fuzzy number h
Division of a fuzzy number
Using criteria and sub-criteria obtained from the literature review and interview study, a hierarchical structure is constructed to apply the fuzzy hierarchy process algorithms (Hosny et al., 2013). Triangular fuzzy number of linguistic variables with fuzzy scale is presented in Table 1.
The triangular fuzzy number of linguistic variables and fuzzy scales
| Linguistic variable | Fuzzy scale | Triangular fuzzy number | Reciprocal triangular fuzzy number |
|---|---|---|---|
| Equal Importance | 1 | (1,1,1) | (1,1,1) |
| Moderate Importance | 3 | (2,3,4) | (1/4,1/3,1/2) |
| Strong Importance | 5 | (4,5,6) | (1/6,1/5,1/4) |
| Very Strong Importance | 7 | (6,7,8) | (1/8,1/7,1/6) |
| Extremely strong Importance | 9 | (9,9,9) | (1/9,1/9,1/9) |
The questionnaire was developed based on a well-defined hierarchical structure. A standard form was utilized to complete the pairwise comparison matrix. Professionals were then asked to rank the importance of the criteria and sub-criteria within the pairwise comparison matrix. Pairwise comparisons were conducted among the relevant criteria and sub-criteria using a specified scale. In this context, experts in the field used the criteria and sub-criteria for Contractor selection. The pairwise comparisons were made using the set. The pairwise comparison judgments are represented by fuzzy triangular numbers denoted by = (, , ), and n judgments are required for each comparison group to construct a positive fuzzy reciprocal comparison matrix A = feeling. The matrix is expressed as follows:
= 3, 5, 7, 9, = Criterion i is of relative importance to Criterion j
1, I = j Criterion I is equal importance to criterion j
3 −1, 5 −1, 7 −1, 9 −1 Criterion i is relatively less important for criterion j
After conducting the expert panel and constructing pairwise comparison matrices with fuzzy scales, the criteria and sub-criteria were converted into a triangular fuzzy scale to reflect the experts' ratings of importance. The fuzzy five-scale linguistic scaling used to weigh the importance of each main criterion and sub-criterion was transformed into triangular fuzzy numbers. In fuzzy multiple-criteria decision-making, the most common operation is the fuzzy geometric mean, which is used to combine expert judgments. Expert judgments can be converted into triangular fuzzy numbers using the following formula. The random consistency index of fuzzy number with ratio index is presented in Table 2 below.
Where:
– are the integrated triangular fuzzy numbers by N experts.
– is the ith to the jth factor pair comparison by expert k.
x – is the symbol of matrix multiplication?
The index of consistency (CI) and ratio index (RI) values were used to determine the consistency ratio. The consistency ratio was gauged whenever the CI and RI calculations were performed. The CR was established by dividing the CI and RI using Equation (11).
To confirm that the preferences were consistent, it was necessary to validate the criterion comparison. The standard states that a matrix can be used only if its consistency ratio (CR) is less than 0.10 (Nasution et al., 2022). The fuzzy analytical operation can be performed in Microsoft Excel to obtain the outcomes of the fuzzy geometric mean and fuzzy weight. The importance coefficient is calculated using the formula shown below.
Where: is fuzzy comparison value of criterion i to criterion n
Is the geometric mean of the fuzzy comparison value of the criterion?
Is the fuzzy weight of the ith criterion, which is indicated by a triangular fuzzy number?
Hence WI = (, ), where Lwi, Mwi and Uwi represent the lower, middle and upper values of the fuzzy weight of the Ith criterion, respectively. Defuzzification is a process used to convert a fuzzy number into a single crisp value. The center of the area converts a fuzzy weight into a nonfuzzy value and has been extensively applied in defuzzification (Ayhan and Kilic, 2015; Jilcha et al., 2017).
Where: X is the Defuzzified Value, L is the lower value, M is the middle value and H is the upper value. After determining the nonfuzzy value, normalization can be used to determine the local weights for each criterion. The local weights for the primary criteria and sub-criteria within the same hierarchy were added to 1.00. The value of the global weight is equal to the value of the local weight within each of the main criteria multiplied by the value of the local weight within each sub-criterion.
This system offers distinct methodological advantages. Specifically, the integration of the Fuzzy Analytic Hierarchy Process (F-AHP) with the TOPSIS establishes a rigorous multi-criteria decision-making framework for the selection of road maintenance contractors. Road maintenance projects are inherently characterized by a combination of qualitative and quantitative assessment dimensions, including technical competence, historical performance, adequacy and reliability of equipment, adherence to safety protocols, environmental compliance and managerial effectiveness. Conventional contractor selection methods – particularly those that primarily emphasize the lowest bid price – are generally insufficient to capture and accurately represent this multidimensional structure of decision criteria.
The application of Fuzzy-AHP facilitates the incorporation of expert judgment under conditions of uncertainty by translating linguistic evaluations into fuzzy numerical values. This process mitigates subjectivity, captures ambiguity inherent in human assessments, and enhances the reliability and precision of criteria weighting. Following the derivation of these weights, TOPSIS is employed as a robust outranking method to generate a performance ranking of candidate contractors based on their relative proximity to an ideal (best) and an anti-ideal (worst) solution.
The resulting hybrid F-AHP–TOPSIS model provides a more transparent, systematic and defensible decision-making process compared with traditional methods. A further key advantage of this integrated approach is its capacity to reduce evaluator bias and inconsistency. Because both F-AHP and TOPSIS are grounded in explicit computational procedures, they constrain the influence of individual preferences and judgmental errors.
Moreover, the combined method is well-suited to complex decision contexts such as road maintenance, where project conditions are uncertain, performance outcomes are heterogeneous and trade-offs among criteria are nontrivial. The model is replicable across different projects and organizational settings, thereby enhancing institutional accountability and ensuring that contractors are assessed equitably across multiple performance dimensions rather than on cost alone.
Despite its advantages, the integrated F-AHP and TOPSIS framework also presents several constraints. The approach is strongly reliant on expert judgment; consequently, any bias, restricted experience base, or subjectivity on the part of the experts can negatively influence the robustness and validity of the results. Furthermore, the execution of fuzzy pairwise comparisons, the implementation of consistency checks, and the subsequent TOPSIS computations are relatively resource-intensive in terms of both time and computational load, and they require specialized methodological expertise. In the absence of adequate training in fuzzy logic and multi-criteria decision-making (MCDM) techniques, practitioners may face substantial challenges in implementing the model accurately and consistently.
Furthermore, the model's outputs are sensitive to variations in criteria weights. Minor inconsistencies, ambiguities or inadequately defined weights can alter the final ranking of alternatives, thereby introducing uncertainty into the decision-making process. The quality and reliability of the decision recommendations are also directly contingent on the quality, completeness and accuracy of the underlying input data. Incomplete performance records or inaccurate information related to contractors can lead to misleading evaluations and suboptimal recommendations.
3. Results and discussions
3.1 Establishing the agreed criteria and fuzzy analytical hierarchy process
A comprehensive review was conducted on contractor selection for maintenance services, guided by the ERA Procurement Manual. Various keyword combinations, such as maintenance contractor, best value selection and related terms, were used to ensure a broad and relevant collection of research materials. Ten primary criteria and thirty-eight sub-criteria/factors were first identified to have in the process of choosing the best Contractor. These elements were categorized into six primary criteria and twenty-six sub-criteria after additional reviews of relevant literature, expert panel talks and questionnaires as described in Table 3.
List of main criteria influencing contractor selection
| The main activities |
|---|
| Contract price (C1) |
| Definition: The total cost proposed by the Contractor for completing the project or delivering the services. This criterion evaluates the competitiveness, reasonableness and alignment of the price with the project's budget |
| Financial Capacity (C2) |
| Definition: The Contractor's ability to finance the project, as evidenced by their financial statements, creditworthiness and cash flow management. It assesses whether the Contractor has sufficient resources to sustain the project without delays or disruptions |
| Technical Capacity (C3) |
| Definition: The Contractor's technical expertise and ability to deliver the project according to the specifications. This includes evaluation of methodologies, equipment and compliance with technical standards |
| Experience and Reputation (C4) |
| Definition: The Contractor's past performance on similar projects and their reputation in the industry. This includes references, testimonials and demonstrated expertise in the field |
| Management Capacity (C5) |
| Definition: The Contractor's capability to plan, organize and execute the project efficiently. This includes project management expertise, organizational structure, leadership and decision-making processes |
| Health, Safety and Environment (C6) |
| Definition: The Contractor's commitment to maintaining high standards in health, safety and environmental management. This includes compliance with regulations, safety records and implementation of sustainable practices |
Based on the responses from the questionnaire, the values for the mean and standard deviation of the scores assigned to each criterion were calculated and ranked as shown in Table 4 and Cronbach's Alpha for validation is also presented in Table 5 below.
List of main and sub-criteria analyzed based on response for validation
| Main criteria in criteria | MS | STD | %Agree | Sub-criteria | MS | STD | %Agree |
|---|---|---|---|---|---|---|---|
| Contract Bid Price (C1) | 4.48 | 0.49 | 100 | ||||
| Financial Capacity (C2) | 4.55 | 0.56 | 96 | Financial Performance (C21) | 4.55 | 0.56 | 97 |
| Guarantee Bond (C22) | 4.45 | 0.56 | 97 | ||||
| Company Turnover (C23) | 4.21 | 0.76 | 93 | ||||
| Credit Rating Liquidity (C24) | 4.38 | 0.67 | 90 | ||||
| Valid tax Clearance certificate (C25) | 4.28 | 0.74 | 90 | ||||
| Technical Capacity (C3) | 4.38 | 0.61 | 93.1 | Experience of Staff (C31) | 4.03 | 0.93 | 72 |
| Work Plan and Scheduling (C32) | 4.21 | 0.66 | 86 | ||||
| Previous Work Quality (C33) | 4.28 | 0.78 | 79 | ||||
| Labor, Plant and Equipment Facility (C34) | 3.93 | 0.9 | 72 | ||||
| Performance in Similar Project (C35) | 4.45 | 0.6 | 97 | ||||
| Technical Approach and Work Methodology (C36) | 4.24 | 0.6 | 86 | ||||
| Experience (C4) | 4.41 | 0.67 | 89.66 | History of Non-Performance of Contract (C41) | 4.00 | 0.87 | 69 |
| Projects Completed on Time (C42) | 4.21 | 0.76 | 79 | ||||
| Similar Work Experiences (C43) | 4.21 | 0.76 | 79 | ||||
| General Experience (C44) | 4.03 | 0.81 | 76 | ||||
| Experience in the Region (C45) | 3.86 | 1.14 | 69 | ||||
| Availability of Required License (C46) | 4.48 | 0.50 | 100 | ||||
| Management Capacity (C5) | 4.31 | 0.75 | 82.76 | Management Knowledge (C51) | 4.10 | 0.84 | 76 |
| Quality, Time, and Cost Management (C52) | 4.31 | 0.83 | 76 | ||||
| Contract Management (C53) | 4.28 | 0.74 | 83 | ||||
| Risk Management (C54) | 4.07 | 0.94 | 72 | ||||
| Understanding Insight of the Project (C55) | 4.21 | 0.85 | 79 | ||||
| Coordination with Clients and/or Consultants (C56) | 4.03 | 1.00 | 76 | ||||
| Health, Safety and Environment (C6) | 4.21 | 0.76 | 79.31 | Health and Safety Records (C61) | 3.97 | 0.89 | 66 |
| Health and Safety Management Plan (C62) | 4.00 | 0.87 | 69 | ||||
| Environmental Protection Plan (C63) | 4.10 | 0.76 | 76 |
3.1.1 Major criteria and transforming fuzzy scales into triangular fuzzy numbers
The respondents comprised professionals from the Engineering Procurement Directorate and the Ethiopian Roads Administration (ERA) Road Network Directorate, each with more than 10 years of professional experience. Although a total of 40 experts were initially targeted, the final sample consisted of 29 experts, which was deemed sufficient for the objectives of this study. Accordingly, these 29 experts completed the pairwise comparison tables used in the Fuzzy-AHP survey.
Subsequently, the fuzzy five-point linguistic scale employed to assess the relative importance of each main criterion and sub-criterion was converted into the corresponding triangular fuzzy numbers and organized into a fuzzy pairwise comparison matrix. In line with the predefined scale, each linguistic judgment was systematically mapped to its associated triangular fuzzy number. Tables 6 and 7 below show the sample expert pairwise comparison for the given criteria, the pairwise comparison matrix of major contractor section criteria in fuzzy scale.
Sample expert pairwise comparison for main criteria
| C1 | C2 | C3 | C4 | C5 | C6 | |
|---|---|---|---|---|---|---|
| Contract Bid Price(C1) | 1 | 1 | 1 | 0.33 | 0.2 | 0.2 |
| Financial Capacity(C2) | 1 | 1 | 1 | 1 | 0.33 | 0.33 |
| Technical Capacity(C3) | 1 | 1 | 1 | 1 | 4 | 5 |
| Experience(C4) | 3 | 5 | 5 | 1 | 5 | 0.2 |
| Management Capacity(C5) | 5 | 5 | 1 | 0.25 | 1 | 5 |
| Health, Safety and Environment(C6) | 5 | 3 | 0.2 | 5 | 0.2 | 1 |
Pairwise comparison matrix of major Contractor selection criteria – fuzzy scale
| C1 | C2 | C3 | C4 | C5 | C6 | |||||||||||||
|---|---|---|---|---|---|---|---|---|---|---|---|---|---|---|---|---|---|---|
| C1 | 1.000 | 1.000 | 1.000 | 1.000 | 1.024 | 2.028 | 0.940 | 0.946 | 1.862 | 1.696 | 2.009 | 2.520 | 0.968 | 1.144 | 1.572 | 1.239 | 1.671 | 2.178 |
| C2 | 0.493 | 0.976 | 1.000 | 1.000 | 1.000 | 1.000 | 0.990 | 0.988 | 1.836 | 0.706 | 0.842 | 1.166 | 1.345 | 1.599 | 2.561 | 1.257 | 1.326 | 2.314 |
| C3 | 0.537 | 1.057 | 1.064 | 0.545 | 1.012 | 1.010 | 1.000 | 1.000 | 1.000 | 0.887 | 0.900 | 1.750 | 0.863 | 0.927 | 1.648 | 2.201 | 2.811 | 3.703 |
| C4 | 0.397 | 0.498 | 0.589 | 0.857 | 1.187 | 1.417 | 0.571 | 1.111 | 1.127 | 1.000 | 1.000 | 1.000 | 2.353 | 3.283 | 4.011 | 2.342 | 2.998 | 3.760 |
| C5 | 1.572 | 0.874 | 0.636 | 0.391 | 0.625 | 0.743 | 0.607 | 1.079 | 1.159 | 0.249 | 0.305 | 0.425 | 1.000 | 1.000 | 1.000 | 2.308 | 2.861 | 3.793 |
| C6 | 0.459 | 0.598 | 0.807 | 0.432 | 0.754 | 0.795 | 0.270 | 0.356 | 0.454 | 0.266 | 0.334 | 0.427 | 0.264 | 0.350 | 0.433 | 1.000 | 1.000 | 1.000 |
Note(s): ʎʹ max = 6.37, CI = 0.075 and CR = 0.06
The elements of the aggregated pairwise comparison matrix of the criteria in the hierarchy were computed by combining the collected data from all 29 experts using a geometric mean method.
Figure 1 illustrates that among the six main criteria categories, “Contract Bid Price” is identified as the top most important Contractor selection criterion with a weight of 0.215, and “Experience is the second criterion with a weight of 0.203”. Whereas, “Health, safety, and Environment” is the least, with a weight of 0.079. The ranking of the Criteria is C1> C4> C3> C2> C5>C6. Table 8 below shows the middle value of the pairwise comparison of the basic criteria.
 The chart titled “Main criteria” displays horizontal bars for six categories labeled on the vertical axis: “Contract Bid Price (C 1)”, “Financial Capacity (C 2)”, “Technical Capacity (C 3)”, “Experience (C 4)”, “Management Capacity (C 5)”, and “Health, Safety and Environment (C 6)”. The horizontal axis ranges from 0.000 to 0.250 in increments of 0.050 units. Each bar represents a numerical weight value, with labels shown at the end of each bar. The values are “Contract Bid Price (C 1)” at 0.215, “Financial Capacity (C 2)” at 0.184, “Technical Capacity (C 3)” at 0.185, “Experience (C 4)” at 0.203, “Management Capacity (C 5)” at 0.135, and “Health, Safety and Environment (C 6)” at 0.079. Note: All numerical data values are approximated.
The ranking of main criteria
The chart titled “Main criteria” displays horizontal bars for six categories labeled on the vertical axis: “Contract Bid Price (C 1)”, “Financial Capacity (C 2)”, “Technical Capacity (C 3)”, “Experience (C 4)”, “Management Capacity (C 5)”, and “Health, Safety and Environment (C 6)”. The horizontal axis ranges from 0.000 to 0.250 in increments of 0.050 units. Each bar represents a numerical weight value, with labels shown at the end of each bar. The values are “Contract Bid Price (C 1)” at 0.215, “Financial Capacity (C 2)” at 0.184, “Technical Capacity (C 3)” at 0.185, “Experience (C 4)” at 0.203, “Management Capacity (C 5)” at 0.135, and “Health, Safety and Environment (C 6)” at 0.079. Note: All numerical data values are approximated.The ranking of main criteria
Middle value of the pairwise comparison of the main criteria
| C1 | C2 | C3 | C4 | C5 | C6 | |
|---|---|---|---|---|---|---|
| C1 | 1.000 | 1.024 | 0.946 | 2.009 | 1.144 | 1.671 |
| C2 | 0.976 | 1.000 | 0.988 | 0.842 | 1.599 | 1.326 |
| C3 | 1.057 | 1.012 | 1.000 | 0.900 | 0.927 | 2.811 |
| C4 | 0.498 | 1.187 | 1.111 | 1.000 | 3.283 | 2.998 |
| C5 | 0.874 | 0.625 | 1.079 | 0.305 | 1.000 | 2.861 |
| C6 | 0.598 | 0.754 | 0.356 | 0.334 | 0.350 | 1.000 |
| SUM | 5.004 | 5.603 | 5.480 | 5.390 | 8.302 | 12.666 |
By using the middle value in Fuzzy, the consistency ratio is calculated. The following pairwise comparison matrix contains the middle value of fuzzy membership based on the criteria comparison. The normalization process begins by summing each criterion in the same column and dividing each criterion value by the summation results. Finally, for each column in the same row, these values were calculated as the average value and are presented in Table 9.
Results of average value
| C1 | C2 | C3 | C4 | C5 | C6 | AVG | |
|---|---|---|---|---|---|---|---|
| C1 | 0.200 | 0.183 | 0.173 | 0.373 | 0.138 | 0.132 | 0.200 |
| C2 | 0.195 | 0.178 | 0.180 | 0.156 | 0.193 | 0.105 | 0.168 |
| C3 | 0.211 | 0.181 | 0.182 | 0.167 | 0.112 | 0.222 | 0.179 |
| C4 | 0.099 | 0.212 | 0.203 | 0.186 | 0.395 | 0.237 | 0.222 |
| C5 | 0.175 | 0.112 | 0.197 | 0.057 | 0.120 | 0.226 | 0.148 |
| C6 | 0.120 | 0.135 | 0.065 | 0.062 | 0.042 | 0.079 | 0.084 |
The average value illustrates the initiation of the criteria weights in the classic AHP. If the consistency ratio fits the threshold, the criteria weight can be used in the weighting and prioritization of the Contractor selection criteria calculation. Otherwise, the pairwise comparison matrix must be adjusted. Furthermore, the following matrix is the product of the middle value of the fuzzy membership and the average value. This step must be performed to calculate the maximum eigenvalue (λ max) from the pairwise comparison matrix and criteria weight. For further clarification, Table 10 is presented in the subsequent text.
Product between the middle value of fuzzy membership and the average value
| C1 | C2 | C3 | C4 | C5 | C6 | SUM Xʹ | |
|---|---|---|---|---|---|---|---|
| C1 | 0.200 | 0.172 | 0.169 | 0.446 | 0.169 | 0.140 | 1.296 |
| C2 | 0.195 | 0.168 | 0.177 | 0.187 | 0.236 | 0.111 | 1.074 |
| C3 | 0.211 | 0.170 | 0.179 | 0.200 | 0.137 | 0.235 | 1.132 |
| C4 | 0.099 | 0.199 | 0.199 | 0.222 | 0.485 | 0.251 | 1.455 |
| C5 | 0.175 | 0.105 | 0.193 | 0.068 | 0.148 | 0.239 | 0.927 |
| C6 | 0.119 | 0.127 | 0.064 | 0.074 | 0.052 | 0.084 | 0.519 |
The eigenvalue is calculated by dividing the x′ Sum by the average x. In this case, x′ is the row summation in the previous matrix, and x is the average value (initial criteria weight). Meanwhile, λmax is the average eigenvalue from every criterion. As mentioned in the previous section, the ratio index (RI) is a constant. Because this research uses six (6) main criteria, the value of RI was 1.24. The results show that the data are consistent at 0.06 < 0.1. Hence, the aggregated comparison matrix is consistent and can process the next steps as it is presented in Table 11.
Consistency ratio index
| AVG | SUM X | ʎʹ | ||
|---|---|---|---|---|
| C1 | 0.200 | 1.296 | 6.491 | |
| C2 | 0.168 | 1.074 | 6.395 | |
| C3 | 0.179 | 1.132 | 6.318 | |
| C4 | 0.222 | 1.455 | 6.557 | |
| C5 | 0.148 | 0.927 | 6.281 | |
| C6 | 0.084 | 0.519 | 6.204 | |
| ʎʹ Max | 6.374 | |||
| CI | 0.074887 | |||
| RI | 1.24 | |||
| CR | 0.060 |
The relative nonfuzzy weights of all criteria were calculated by averaging the fuzzy numbers for all criteria.
Similarly, the remaining fuzzy weights wi of the other criteria were calculated, and Table 12 shows the results. Then, normalization was performed.
Fuzzy geometric mean values with fuzzy weight
| C1 | C2 | C3 | C4 | C5 | C6 | AVG | WT | |
|---|---|---|---|---|---|---|---|---|
| C1 | 1.114 | 1.245 | 1.787 | 0.140 | 0.198 | 0.351 | 0.230 | 0.215 |
| C2 | 0.914 | 1.095 | 1.527 | 0.115 | 0.174 | 0.230 | 0.196 | 0.184 |
| C3 | 0.889 | 1.166 | 1.502 | 0.112 | 0.186 | 0.295 | 0.197 | 0.185 |
| C4 | 1.012 | 1.365 | 1.556 | 0.127 | 0.217 | 0.305 | 0.217 | 0.203 |
| C5 | 0.774 | 0.895 | 0.980 | 0.097 | 0.143 | 0.192 | 0.144 | 0.135 |
| C6 | 0.394 | 0.515 | 0.615 | 0.050 | 0.082 | 0.121 | 0.084 | 0.079 |
| 1.068 | 1 | |||||||
| SUM | 5.097 | 6.280 | 7.966 | |||||
| INV | 0.196 | 0.159 | 0.126 | |||||
| ASSEND | 0.126 | 0.159 | 0.196 |
3.2 Criteria prioritization
In the following section, the aggregated pairwise comparison matrix and the analyzed results of weights and rankings of all sub-criteria results are presented here in Table 13.
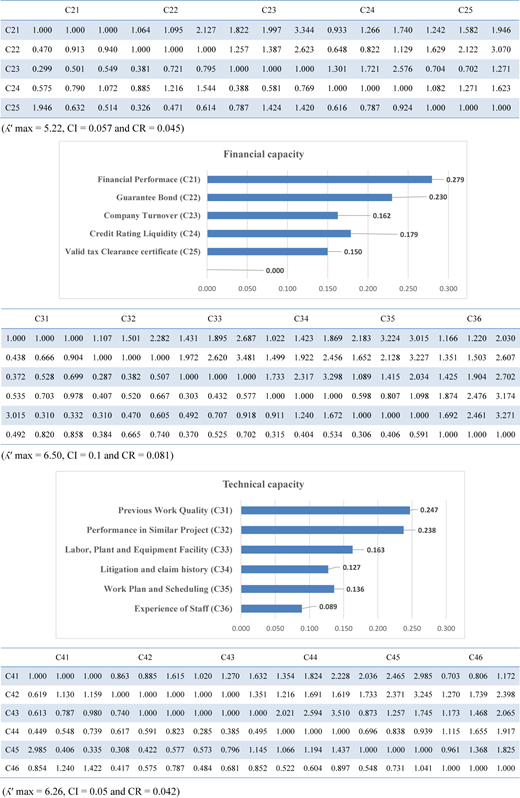
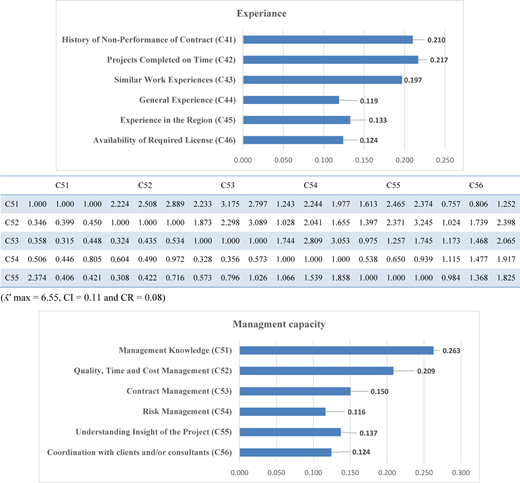
The pairwise comparison matrix present to determine the weights and rankings of the sub-criteria from financial capacity to management Capacity (C2–C5). See Table 14 below.
Summary of the overall ranking
| Major criteria | Normalized local weight | Sub-criteria | Normalized local weight | Global weights |
|---|---|---|---|---|
| Bid Price (C1) | 0.215 | 0.215 | 0.215 | |
| Financial Capacity (C2) | 0.184 | Financial Performance (C21) | 0.279 | 0.051 |
| Guarantee Bond (C22) | 0.231 | 0.043 | ||
| Company Turnover (C23) | 0.162 | 0.030 | ||
| Credit Rating Liquidity (C24) | 0.178 | 0.033 | ||
| Valid tax Clearance certificate (C25) | 0.149 | 0.027 | ||
| Technical Capacity (C3) | 0.185 | Experience of Staff (C31) | 0.247 | 0.046 |
| Work Plan and Scheduling (C32) | 0.238 | 0.044 | ||
| Previous Work Quality (C33) | 0.163 | 0.030 | ||
| Labor, Plant and Equipment Facility (C34) | 0.127 | 0.024 | ||
| Performance in Similar Project (C35) | 0.136 | 0.025 | ||
| Technical Approach and Work Methodology (C36) | 0.089 | 0.016 | ||
| Experience (C5) | 0.203 | History of Non-Performance of Contract (C41) | 0.210 | 0.043 |
| Projects Completed on Time (C42) | 0.217 | 0.044 | ||
| Similar Work Experiences (C43) | 0.197 | 0.040 | ||
| General Experience (C44) | 0.119 | 0.024 | ||
| Experience in the Region (C45) | 0.133 | 0.027 | ||
| Availability of Required License (C46) | 0.124 | 0.025 | ||
| Management Capacity (C4) | 0.135 | Management Knowledge (C51) | 0.263 | 0.035 |
| Quality, Time and Cost Management (C52) | 0.209 | 0.028 | ||
| Contract Management (C53) | 0.150 | 0.020 | ||
| Risk Management (C54) | 0.116 | 0.016 | ||
| Understanding Insight of the Project (C55) | 0.137 | 0.019 | ||
| Coordination with Clients and/or Consultants (C56) | 0.124 | 0.017 | ||
| Health, Safety and Environment (C6) | 0.079 | Health and Safety Records (C61) | 0.391 | 0.031 |
| Health and Safety Management Plan (C62) | 0.240 | 0.019 | ||
| Environmental Protection Plan (C63) | 0.368 | 0.029 |
Initially, a comprehensive set of influential criteria was identified through an extensive review of the literature and subsequently refined with expert input. Twenty-six sub-criteria were finalized under six major criteria categories: Bid Price, Financial Capacity, Technical Capacity, Experience Management Capacity, and Health, Safety, and Environment. The Fuzzy-AHP was employed to ascertain the weights and rankings of each main and sub-criterion. Consequently, the criteria were ranked and weighted according to their relative importance. The final weights of the sub-criteria were derived by multiplying the weight of each sub-criterion by the weight of its respective category. Figure 2 below clearly shows the overall ranking of each sub-criterion
 The chart titled “over all weight” displays horizontal bars for multiple criteria labeled on the vertical axis, with percentage values shown at the end of each bar. The horizontal axis ranges from 0.00 percent to 25.00 percent in increments of 5.00 percent. The criteria and their values are: “Bid Price (C 1)” at 21.50 percent; “Financial Performance (C 21)” at 5.13 percent; “History of Non-Performance of Contract (C 31)” at 4.56 percent; “Projects Completed on Time (C 42)” at 4.40 percent; “Performance in Similar Project (C 32)” at 4.39 percent; “Experience of Staff (C 41)” at 4.26 percent; “Guarantee Bond (C 22)” at 4.25 percent; “Similar Work Experiences (C 43)” at 4.00 percent; “Management Knowledge (C 51)” at 3.55 percent; “Credit Rating Liquidity (C 24)” at 3.27 percent; “Health and Safety Records (C 61)” at 3.08 percent; “Previous Work Quality (C 33)” at 3.01 percent; “Company Turnover (C 23)” at 2.98 percent; “Environmental protection plan (C 63)” at 2.90 percent; “Quality, Time and Cost Management (C 52)” at 2.81 percent; “Valid tax Clearance certificate (C 25)” at 2.74 percent; “Experience in the Region (C 45)” at 2.69 percent; “Availability of Required License (C 46)” at 2.52 percent; “Labor, Plant and Equipment Facility (C 35)” at 2.52 percent; “General Experience (C 44)” at 2.41 percent; “Work Plan and Scheduling (C 34)” at 2.35 percent; “Contract Management (C 53)” at 2.03 percent; “Health and Safety Management Plan (C 62)” at 1.89 percent; “Understanding Insight of the Project (C 55)” at 1.85 percent; “Coordination with clients and or consultants (C 56)” at 1.68 percent; “Technical Approach and Work Methodology (C 36)” at 1.64 percent; and “Risk Management (C 54)” at 1.57 percent. The chart shows a steep drop from the highest value, “Bid Price (C 1)”, to all other criteria, with remaining values gradually decreasing. Note: All numerical data values are approximated.
Overall ranking each sub-criterion after ranking
The chart titled “over all weight” displays horizontal bars for multiple criteria labeled on the vertical axis, with percentage values shown at the end of each bar. The horizontal axis ranges from 0.00 percent to 25.00 percent in increments of 5.00 percent. The criteria and their values are: “Bid Price (C 1)” at 21.50 percent; “Financial Performance (C 21)” at 5.13 percent; “History of Non-Performance of Contract (C 31)” at 4.56 percent; “Projects Completed on Time (C 42)” at 4.40 percent; “Performance in Similar Project (C 32)” at 4.39 percent; “Experience of Staff (C 41)” at 4.26 percent; “Guarantee Bond (C 22)” at 4.25 percent; “Similar Work Experiences (C 43)” at 4.00 percent; “Management Knowledge (C 51)” at 3.55 percent; “Credit Rating Liquidity (C 24)” at 3.27 percent; “Health and Safety Records (C 61)” at 3.08 percent; “Previous Work Quality (C 33)” at 3.01 percent; “Company Turnover (C 23)” at 2.98 percent; “Environmental protection plan (C 63)” at 2.90 percent; “Quality, Time and Cost Management (C 52)” at 2.81 percent; “Valid tax Clearance certificate (C 25)” at 2.74 percent; “Experience in the Region (C 45)” at 2.69 percent; “Availability of Required License (C 46)” at 2.52 percent; “Labor, Plant and Equipment Facility (C 35)” at 2.52 percent; “General Experience (C 44)” at 2.41 percent; “Work Plan and Scheduling (C 34)” at 2.35 percent; “Contract Management (C 53)” at 2.03 percent; “Health and Safety Management Plan (C 62)” at 1.89 percent; “Understanding Insight of the Project (C 55)” at 1.85 percent; “Coordination with clients and or consultants (C 56)” at 1.68 percent; “Technical Approach and Work Methodology (C 36)” at 1.64 percent; and “Risk Management (C 54)” at 1.57 percent. The chart shows a steep drop from the highest value, “Bid Price (C 1)”, to all other criteria, with remaining values gradually decreasing. Note: All numerical data values are approximated.Overall ranking each sub-criterion after ranking
The results revealed the Major criteria Bid Price as the most crucial major criteria category, followed by Experience, Financial Capacity, Technical Capacity, Management Capacity, and Health, Safety, and Environment. Based on the sub-criteria, Bid Price reported receiving the highest weight (21.5%) among all sub-criteria, followed by financial performance (5.13%). and History of Non Performance of the Contract (4.56%) and project completion on time (4.4%) are the most important sub-criteria. The last four sub-criteria in the row with slight weight differences are Understanding Insight of the Project (1.85%), Coordination with clients and/or consultants (1.68%), Technical approach and work methodology (1.64%) and Risk Management (1.57%).
3.3 Implementation of the TOPSIS method
The bid evaluation method is based on the weighted criteria, which were prioritized and ranked according to their importance using the pairwise comparison. The criteria are identified by the expert response and the weight using the Fuzzy-AHP. Finally, a TOPSIS method has been adopted to rank the best Contractor based on the weighted criteria. The Model is needed to simplify the Bid evaluation process to serve as an alternative method for the decision makers to select the best Contractor for maintenance road projects as presented in Table 15.
Bid Evaluation Sample for Contractors road bid document
| Bid price (106) | Financial capacity | Technical capacity | Experience | Management | Health, safety and environment | |
|---|---|---|---|---|---|---|
| Con.1 | 229.88 | 10 | 7.2 | 7.8 | 7.8 | 8.7 |
| Cont.2 | 111.29 | 9.4 | 8.5 | 8.5 | 7.7 | 9.0 |
| Cont.3 | 166.74 | 7.4 | 8.3 | 8.5 | 7.7 | 7.7 |
| Cont.4 | 88.26 | 8.2 | 7.5 | 8.3 | 8.0 | 8.0 |
| Cont.5 | 166.08 | 7.6 | 8.0 | 7.8 | 8.2 | 8.3 |
| Cont.6 | 194.16 | 8.4 | 7.7 | 8.7 | 9.0 | 8.7 |
| Cont.7 | 163.26 | 7.6 | 7.5 | 8.3 | 9.0 | 8.0 |
The first step that the TOPSIS do is to normalize the decision matrix (Contractor's Evaluation criteria result values) using a normalization formula as it is presented in Table 16.
Normalization of the road decision matrix
| Bid price | Financial capacity | Technical capacity | Experience | Management capacity | Health, safety and environment | |
|---|---|---|---|---|---|---|
| Cont1 | 0.5236 | 0.3317 | 0.3463 | 0.3571 | 0.3607 | 0.3925 |
| Cont2 | 0.2535 | 0.4454 | 0.4107 | 0.3875 | 0.3530 | 0.4076 |
| Cont3 | 0.3798 | 0.3506 | 0.4027 | 0.3875 | 0.3530 | 0.3473 |
| Cont4 | 0.2010 | 0.3885 | 0.3624 | 0.3799 | 0.3684 | 0.3623 |
| Cont5 | 0.3783 | 0.3601 | 0.3865 | 0.3571 | 0.3761 | 0.3774 |
| Cont6 | 0.4422 | 0.3980 | 0.3704 | 0.3951 | 0.4144 | 0.3925 |
| Cont7 | 0.3718 | 0.3601 | 0.3624 | 0.3799 | 0.4144 | 0.3623 |
Where Xij = Ith alternative in terms of jth criteria value (data) of the alternative with the selected six criteria.
= Square all alternative values in the listed criteria and add them and square root the value.
The normalized decision matrix presented here is calculated using the normalization formula. See Table 17. It is calculated by dividing each of the Contractor's Criteria Evaluation values by its square root of the summation of the square of each of the Contractor's Criteria Evaluation values.
Weighted normalized decision matrix
| Bid price | Financial capacity | Technical capacity | Experience | Management capacity | Health, safety and environment | |
|---|---|---|---|---|---|---|
| Cont1 | 0.113 | 0.061 | 0.064 | 0.072 | 0.049 | 0.031 |
| Cont2 | 0.055 | 0.082 | 0.076 | 0.079 | 0.048 | 0.032 |
| Cont3 | 0.082 | 0.064 | 0.074 | 0.079 | 0.048 | 0.027 |
| Cont4 | 0.043 | 0.071 | 0.067 | 0.077 | 0.050 | 0.029 |
| Cont5 | 0.081 | 0.066 | 0.071 | 0.072 | 0.051 | 0.030 |
| Cont6 | 0.095 | 0.073 | 0.068 | 0.080 | 0.056 | 0.031 |
| Cont7 | 0.080 | 0.066 | 0.067 | 0.077 | 0.056 | 0.029 |
The Weighted normalized decision matrix is developed by multiplying criteria weight by the result of the normalized decision matrix. The Ideal Value (denoted as V+) represents the most favorable value for each criterion. For benefit criteria, such as Financial Capacity, Technical Capacity, Experience, Management Capacity, and Health and Safety, V+ is the maximum value obtained across all alternatives. Mathematically:
V+ = Max (, . … Vin), Where: V+ = Positive Ideal Value, , , = Values of the road segments (or alternatives) calculated in Step 2 under each criterion. The Negative Ideal Value (denoted as V−) represents the least favorable value for each criterion. For benefit criteria, V− is the minimum value obtained across all alternatives. Mathematically:
Where: V− = Negative Ideal Value, = Values of the road segments (or alternatives) calculated in Step 2 under each criterion. For benefit criteria (e.g. Financial Capacity, Technical Capacity, etc.), the higher the value (closer to V+) and the better the alternative performs. For cost criteria like Bid Price, the lower the value (closer to V+), the more favorable the alternative. Table 18 below is about positive and negative ideal solutions.
Positive and the negative ideal solution
| Bid price | Financial capacity | Technical capacity (C3) | Experience (C4) | Management capacity (C5) | Health, safety and environment (C6) | |
|---|---|---|---|---|---|---|
| V+ | 0.043 | 0.082 | 0.076 | 0.080 | 0.056 | 0.032 |
| V− | 0.113 | 0.061 | 0.064 | 0.072 | 0.048 | 0.027 |
It is calculated using the separation measure formula to measure the separation distance of all road segments from the ideal positive value to the negative ideal value. The Euclidean Distance from the Ideal Best involves calculating the separation measures S+ and S− for each alternative based on the weighted normalized decision matrix as it is clearly presented in Table 19.
Euclidean distance from the ideal best
| Contractor name | S+ | S− |
|---|---|---|
| Contractor one | 0.0742 | 0.0037 |
| Contractor Two | 0.0141 | 0.0633 |
| Contractor Three | 0.0433 | 0.0334 |
| Contractor Four | 0.0158 | 0.0704 |
| Contractor Five | 0.0425 | 0.0328 |
| Contractor Six | 0.0531 | 0.0248 |
| Contractor Seven | 0.0412 | 0.0345 |
The final priority is drafted according to the result gained from step 5 and the best alternative is the one that has the shortest distance to the ideal solution. This means the one that has the larger relative closeness to the ideal solution.
Where: Pi is the performance score, S+ is the separation distance from the Ideal Best, S− is the separation distance from the Ideal Worst. The higher the PS, the closer a Contractor is to the Ideal Best, and higher PS values indicate better performance relative to the Ideal Best.
Table 20 presented the highest performance scores, which indicates their performance is closer to the Ideal Best according to the calculated performance score values. Contractors 2, 4 and 7 are the top-ranked in terms of their performance on the proposed model.
Performance score table and ranking
| Contractor's name | Bid price (106) | Pi | Rank |
|---|---|---|---|
| Cont.1 | 229.88 | 0.0477 | 7 |
| Cont.2 | 111.29 | 0.8182 | 1 |
| Cont.3 | 166.74 | 0.4353 | 4 |
| Cont.4 | 88.26 | 0.8167 | 2 |
| Cont.5 | 166.08 | 0.4352 | 5 |
| Cont.6 | 194.16 | 0.3183 | 6 |
| Cont.7 | 163.26 | 0.4560 | 3 |
From an implementation perspective, the proposed approach can be operationalized through the development of an Excel template that incorporates predefined Triangular Fuzzy Number (TFN) scales, embedded computational formulas and a set of sequentially structured worksheets. This environment allows users to iteratively input pairwise comparison judgments and performance ratings, while automatically computing the associated fuzzy weights and deriving TOPSIS-based rankings. Subsequently, a ready-to-run Python script can be provided. This script takes as input a simple CSV file containing the pairwise comparison matrices and the performance evaluations of the alternatives, and produces as output the corresponding fuzzy weights, the final rankings and graphical sensitivity analyses.
The principal innovation of this study lies in the integration of Fuzzy-AHP and TOPSIS for the selection of contractors for road maintenance. Specifically, the research develops a hybrid MCDM framework in which Fuzzy-AHP is employed to derive the relative weights of evaluation criteria, while TOPSIS is used to generate a prioritized ranking of contractors. This integrated approach yields a more robust and systematic decision-support model that is explicitly tailored to the road maintenance procurement domain in which such hybrid models have been infrequently explored.
The study further contributes by proposing a comprehensive criteria framework that extends beyond conventional price-based evaluation. In contrast to traditional procurement methods that predominantly emphasize the lowest bid, the proposed framework incorporates six main criteria groups and twenty-six associated sub-criteria, encompassing financial, technical, managerial, safety and environmental dimensions of contractor performance. This multi-dimensional structure enables a more holistic and realistic assessment of contractor capabilities and risks. To address uncertainty and imprecision inherent in expert judgments, the model integrates fuzzy logic by employing fuzzy linguistic scales within the pairwise comparison procedure. This methodological enhancement increases the robustness of the criteria weighting process by attenuating subjective bias and reducing inconsistencies that are frequently encountered in conventional AHP implementations.
Overall, the study introduces a rigorously structured and context-aware decision-making framework that is particularly suitable for procurement and contractor selection in developing-country contexts, where data scarcity, pronounced uncertainty and complex trade-offs among multiple criteria are pervasive. The model adapts advanced MCDM techniques to real-world constraints in road maintenance procurement, making it innovative for contexts where data, expertise and documentation may be limited.
This study makes several substantive contributions to the body of knowledge and to the construction industry, with particular relevance for developing countries such as Ethiopia.
First, it proposes a decision-support model for rational and transparent contractor selection. The study develops and empirically validates an evidence-based model that can be adopted by Road Administrations to enhance fairness, accountability and transparency in contractor selection processes.
Second, it identifies the most critical contractor evaluation factors. The findings highlight key determinants of contractor suitability, namely bid price, financial performance, history of nonperformance and timely completion, thereby providing policymakers and procurement professionals with clear guidance on which factors exert the greatest influence on contractor performance and reliability.
Third, it contributes to the enhancement of procurement efficiency and risk mitigation. By emphasizing performance-related and financial indicators, the proposed model assists organizations in reducing contractor-related risks, including project delays, cost overruns and quality deficiencies in road maintenance works.
Fourth, it offers a practical tool for improving public infrastructure management. The hybrid MCDM model constitutes a replicable and scalable instrument for optimizing contractor selection across different regions and contexts, thereby contributing to more effective road maintenance and improved long-term asset management.
Finally, the study addresses a notable research gap in the application of MCDM methods to maintenance-focused projects. While MCDM models are widely applied in general construction project decision-making, relatively few studies concentrate explicitly on maintenance projects, which present distinct performance metrics and risk profiles.
4. Conclusion
In the selection of a contractor for road maintenance, the process involves prioritizing and weighting the main criterion and sub-criterion. The prioritization of criteria and its pairwise comparison are also identified. The pairwise comparisons and ranking of weight are calculated using the FAHP multiple criteria decision method. Ranking of the contractor with multiple criteria bases is conducted using the TOPSIS method. The model assists the decision maker of the ERA's Engineering Procurement management department in selecting the best Contractor for road maintenance.
Traditional methods of contractor selection, such as lowest-bid or experience-based approaches, are often inadequate in capturing the complexity of real-world scenarios.
The TOPSIS method indicates that the contractor with the highest performance score, using the proposed method, is both cost-effective and provides the best value for money.
The expert pairwise comparison and FAHP analysis show that the major criteria Bid Price is the most crucial major criteria category, followed by Experience, Financial Capacity, Technical Capacity, Management Capacity, and Health, Safety, and Environment.
Based on the result of the sub-criteria, Bid Price reported receiving the highest weight (21.5%) among all sub-criteria, followed by financial performance (5.13%). History of Non-Performance of the Contract (4.56%) and project completion on time (4.4%) are the most important sub-criteria.
The lack of structured and comprehensive specific models for maintenance contracts is a significant issue within the Ethiopian Roads Administration (ERA). Currently, ERA relies heavily on the lowest price as the primary criterion for evaluating road maintenance Contractors. While this ensures immediate cost savings, it fails to account for crucial factors such as quality, past performance and life-cycle costs, which are essential for sustainable and effective maintenance solutions.
To conclude, the importance of a contractor selection model for maintenance should be practiced, while ERA projects often use the low bid method, the current performance assessment of contractors in ongoing maintenance projects is ineffective and poorly implemented.

