

To address requirements and specifications of construction project, academics need to build a project classification model. In recent years, project success concept, particularly on large-scale construction projects, has been a controversial issue, especially in developing countries. Hence, in this paper, after introducing a sustainable success index (SSI), a novel method called “rough set approach” had been adopted to induce decision rules and to classify construction projects. The paper aims to discuss these issues.
At first, 20 effective success factors and 15 success criteria based on three pillars of sustainability of economy, society and environment had been categorized. The research data used for analysis had been collected from 26 large-scale construction projects in Iran and five other countries. After collecting data collection, observations had been analyzed and 51 decision rules were generated, and the projects were classified. Eventually, in order to evaluate the performance of the generated rules, confusion matrix was applied, and the model was validated.
The results of the present study show that rough set theory (RST) can be an effective and valuable tool for building expert systems. Practical applications of these results along with limitations and future research are described.
Perhaps for the first time, in the present study, a number of large-scale construction projects are classified based on SSI. Applying RST for building rule-based system and classifying projects in construction project area are novel attempts undertaken in this paper. The rules induced in this study can be applied to develop a sustainable success prediction model in the future studies.
1. Introduction
Conducting a study on successful implementation of infrastructure projects has been a controversial issue in recent years, especially in developing countries. However, since key characteristic of construction industries is unpredictability comparing to static production industries (Safa et al., 2015), there is still no consensus among project management researchers on how project success should be measured, classified and predicted (Elbarkouky, 2012; Pinto and Slevin, 1988). Generally, traditional approaches addressing project success are restricted in delivering the projects economically, on time and with quality. Since construction investment mainly focuses on economic benefits, and these kinds of projects mostly have detrimental effects on social and environmental dimensions, considering sustainable development would be a necessity in presenting a comprehensive prediction model.
As Brundtland (1987) stated, sustainable development is gaining increasing popularity across various sectors including construction industry. There is a wide range of studies conducted on sustainability performance and assessment in the construction field and other areas. Nevertheless, so far, only a few studies, if any, have addressed the project success from this perspective. Hence, assessing and predicting the project success on the basis of three dimensions embodied in sustainable development principles (i.e. economic, environmental, and social) are necessary for successful implementation of the projects (Ugwu and Haupt, 2007). Meanwhile, drawing a distinction between project success (which cannot be measured until the project is completed) and project performance (which can be measured during the lifetime of the project) is of a great importance (Cooke-Davies, 2002). The cogent reason why the concept of sustainable success index (SSI), for the first time, is introduced in this research lies in the fact that in this rule-based system with sustainable success factors (SSFs) as an input and sustainable success criteria (SSC) as an output, the data set must be formed using both results and performance indicators of completed construction projects. Therefore, KPI, which is merely addressed to the project life cycle, cannot be applied.
In order to build the rule-based system, a novel method called “rough set approach” is adopted. The supremacy of the rough set theory (RST) has been proven for discovering the correlation in an incomplete or imprecise data set. This capability is especially important here since acquired data are incomplete and imprecise as a result of the subjective analysis. Additionally, it is demonstrated that the RST is a very effective methodology for data analysis in every attribute-value based domain such as construction industry (Cirovic, 2001).
Accordingly, the objectives of this paper are as follows: determining the effective success factors and criteria for sustainable construction, developing a rough set-based model and generating decision rules, evaluating the performance of the generated rules, classifying large-scale construction projects on the basis of SSI and establishing a rule-based foundation for application in the future studies.
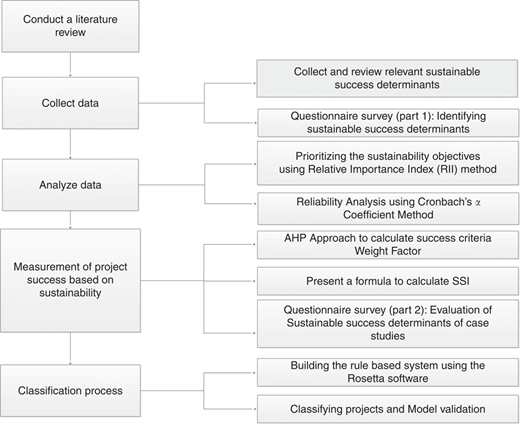
The remainder of the paper is organized as follows. The following section, “Literature Review,” explains the concepts of success in construction projects as well as highlights the previous research conducted in the field of project success and sustainability. Moreover, this section provides the body of the work related to construction project classification as well as methodology background where a summary of common rule-based methods are provided. The subsequent section contains data collection and related results. In this section, at first, the data collection and analysis are discussed, and the next subsection demonstrates the foundation concepts of RST. Subsequently, a rough set-based model is presented and validated. Finally, sensitivity analysis is conducted on prediction model, and its results are discussed as well. The article is concluded by some practical recommendations on the use of this rule-based model in the future works. Figure 1 illustrates the steps used in this study, which is discussed in details in the following sections.
2. Literature review
2.1 Project success
Project success is one of the most frequently discussed topics and of a great importance in project management; however, there is a lack of consensus in this regard among project managers. The definition of project success has undergone a number of transformations over the years. Traditionally, a construction project is deemed successful when it meets criteria related to time, cost and quality (Atkinson, 1999).
As pointed out by Belassi and Tukel (1996), research on project success needs to distinguish success factors and success criteria. Cooke-Davies (2002) has highlighted the difference between the success criteria and success factors. Project success factors are independent variables of a project which contribute to achieving success in a project (Müller and Turner, 2007; Rockart, 1982). On the other hand, project success criteria are dependent variables by which the success or failure of a project will be judged and measured by its stakeholders (Belassi and Tukel, 1996; Pinto and Slevin, 1988; Rockart, 1982). Factors constituting the success criteria are commonly referred to as the key performance indicators or KPIs. The difference between KPIs and CCFs needs to be taken in to account. Cox et al. (2003) has argued that success factors are the efforts made – or strategies adopted – to achieve the success of a project. Whereas, KPIs are the compilations of data measures used to access the performance of the construction project. In fact, the KPIs are essential for comparing effectiveness, efficiency and quality of the actual and estimated performances in both workmanship and product.
Literature regarding the area of project success reveals that various authors have identified a number of success determinants, either from experience or research. Pioneer researchers of project success, Pinto and Slevin (1988) argue that “project success” is something much more complicated than simply meeting cost, time and quality. They added customer satisfaction to the list of important criteria for assessing project success.
Westerveld (2003) reveals that along with the conventional measures of cost, time, quality and scope, there are five KPIs that are used most frequently, including: client’s appreciation; project personnel appreciation; users’ appreciation; contracting partners’ appreciation and stakeholders’ appreciation.
Bryde and Brown (2004), also, suggest that in addition to the measures of iron triangle, overall satisfaction of stakeholders should also be considered in performance evaluation criteria.
Belout and Gauvreau (2004) has emphasized on project team’s ability to manage project risks and to resolve the problems encountered on the project to evaluate the project success. In a study by Cserhati and Szabo (2014), analysis of correlations revealed that relationship-oriented success factors, such as communication, co-operation and project leadership, play a vital role in successful implementation of projects.
Large construction projects generally require large budgets and prolonged schedule, and they involve many complicated procedures. Several attempts have been made to address project success in large-scale construction projects. Brundtland (1987) had identified success factors for large projects using factor analysis method. These factors were grouped into four major categories: incompetent designers and contractors, poor estimation and change management, social and technological issues, and improper techniques and tools. In another research, Ogunlana (2010) argued that these traditional criteria for success were not sufficient to determine whether the project was successful; moreover, quantitative and qualitative criteria such as environmental regulations, building performance and client satisfaction should also be considered.
Al-Tmeemy et al. (2011), for the first time, had measured the success of building projects for sustainable social housing in Nigeria. They have identified several critical success factors influencing the sustainable housing. In the most recent study, Krajangsri and Pongpeng (2017) have addressed the effect of sustainable infrastructure assessments on construction project success using structural equation modeling. In this research construction project success was measured using six criteria: time, cost, quality, client satisfaction, safety and environment.
2.2 Sustainable development
Another concept which needs to be taken into consideration is sustainability, which has been broadly used in many sectors, including construction management. This concept was emerged in the definition given in a report by Brundtland Commission (Cserhati and Szabo, 2014). This most quoted definition states that it is “a process that aims to meet the needs of the present generation and to consider the ability of future generations to meet their needs at the same time.” Choguill (2007) has acknowledged that, to achieve sustainability, construction initiatives must be economically cost-efficient, socially acceptable, technically viable and environmentally attuned. Bakar et al. (2009) have established a theoretical framework for project success factors to achieve sustainability in housing. They identified a list of critical success factors for project management practices which is required for sustainable housing.
Social well-being concerns the benefits of the employees and the future users. Fundamentally, this aspect is derived from the human feelings such as: security, satisfaction, safety and comfort (Abidin, 2009) and human contributions such as skills, health, knowledge and motivation (Parkin, 2000). Sustainability is also care about the extraction of natural resources. Although constructors have little influence on the extraction of natural resources, they are able to discourage this activity by demanding less non-renewable natural resources, more recycled materials, and efficient use of energy and mineral resources (Abidin, 2010). Finally, the economic sustainability focuses on the micro- and macro-economic profits. Micro economic draws attention on the factors or activities which could lead to monetary gains from the construction while macro-economic is attributed to the benefits gained from the project success by the public and government.
2.3 Project classification
In order to address construction project, scholars and researchers need to establish classification approach according to their requirements (Safa et al., 2015). To achieve this, many authors have used different typological frameworks and methodologies in the field of construction management, each of which has a particular domain of application.
During the 1990s, several researchers had focused on this issue. For instance, Tan and Lu (1995) have grouped construction projects with respect to the type of construction work being completed. Meanwhile, Dvir et al. (1998) have presented an applicable project classification model, using linear discriminant analysis, which is applied separately for each group of managerial variables, in order to classify 110 observations (projects). Their findings suggested that some variables are more effective than others in anticipating project success.
In recent years, there have been a few studies that addressed this issue. Shokri et al. (2012) has extended the study of (Baccarini, 1996) by categorizing projects according to complexity, relative size, and organizational risk and maturity level. Safa (2013) asserts that fully categorizing construction projects is impossible due to the various characteristics that could be used to define classes, and the existence of unknown factors. This lead to a lack of consensus on classification of construction projects because of their uniqueness and disparity in terms of size, time, investment, complexity and technological content.
In the recent studies, Bērziša (2015) has developed a set of main project classification features to describe the project resemblance using Case-based reasoning, and Safa et al. (2015) have classified construction projects according to their size, complexity, and risk tolerance. After a comprehensive review of practical project classification methods, they analyzed construction projects by grouping them according to analogous attributes.
Yet, none of existing characterization methods is able to provide a basis for presenting a prediction model. To bridge this gap, this research, in addition to mentioned purposes, aims to establish a rule-based classification system to capture the patterns hidden in the data set.
2.4 Methodology background
In recent years, a wide variety of artificial intelligence techniques have been applied for rule induction in many different disciplines (Sikder and Munakata, 2009). These techniques include data mining tools such as neural network (Fu, 1999), decision tree (Quinlan, 1986), rough sets (Pawlak, 1982) and fuzzy sets (Zadeh, 1965).
RST, proposed by Pawlak (1982), has been proved to be an effective mathematical approach for data mining by applying the rule induction method. This approach is based on the assumption that every set using a lower and an upper approximation will be roughly defined. In fact, RST seeks to find classification rules from vague information by considering classification of indiscernible objects (Pawlak et al., 1988), and the term “rough set” denotes a set that cannot be classified into a group of data with certainty (Pawlak et al., 1988; Walczak and Massart, 1999).
The rough set approach has many advantages. The most important advantage of this approach is its capability to estimate the significance of specific attributes (Liu and Yu, 2009). RST calculates the significance of the attributes by discovering the dependency between attributes (Pawlak et al., 1988; Walczak and Massart, 1999; Liu and Yu, 2009). However, despite these advantages, very little research has adopted RST in the field of construction (Huang et al., 2010; Pheng and Hongbin, 2006; Tam et al., 2006; Choi et al., 2014).
To assess the performance of the classification techniques, some researchers have emphasized on the supremacy and applicability of each of them in different cases. Mak and Munakata (2002) have compared the capability of ID3 decision tree, rough sets, and neural networks with respect to their classification and predictive accuracy. They showed that each of these methods might be more suitable than the others depending on the type of data analyzed and the objective of the analysis. Their findings are as follows:
In neural networks, it is difficult to trace and explain the way in which the data pattern is derived and rule distillation involves intricate analysis as opposed to rough sets and ID3.
Training for neural network requires long computational time before the network stabilizes or converges. If the data are inconsistent or incomplete, neural networks may fail to converge, while the training time for RST is considerably shorter.
ID3 may be more efficient for dealing with excessively large number of rules, but may potentially overlook useful rules.
Compared with ID3, rough set method showed better predictive capability when refines inadequate data. Accordingly, it can be argued that RST works well in a situation in which discovering relationships in incomplete, inadequate or imprecise data is required. This capability is especially important for the current research since experts’ opinions are subjective and involve impreciseness and limited number of large-scaled construction projects is available as well.
3. Research methodology
To identify sustainable success, determinants are initially important step in this research. A number of most important related studies with different perspectives are summarized in Tables I and II. Since, up until now, there is no empirical study incorporating project success indicators in three dimensions of sustainable development, the applications of previous methods for determining sustainable success indicators, namely SSFs and SSC, are restricted. This had driven us to undertake a forerunner research in order to establish a list of success indicators categorized into the three dimensions of sustainability, to reach subsequent possible objectives.
Summary of available previous studies on sustainable success factors
Summary of available previous studies on sustainable success criteria
To identify the potential success determinants, separately for SSFs and SSC, a content analysis method (Holsti, 1969) was adopted. From the content analysis conducted on the former research work, a total set of 49 raw SSFs and SSC were initially obtained from comprehensive literature review on previous studies on KPIs/success determinants. These 49 optional indicators are divided into three groups, including economic, social, and environmental indicators.
It is noteworthy that, as Hill and Bowen (1997) stated that some of the sustainable principles could be categorized as either “social” or “economic,” or both. For instance, “leadership” and “motivation” clearly have influence on economic performance. However, on the basis of aforementioned definition of social sustainability and comprehensive literature review, it is deduced that social aspect of these indicators should be emphasized (Szekely and Knirsch, 2005; Lam et al., 2010; Parkin, 2000; Abidin, 2009; Hill and Bowen, 1997).
To ensure the clarity and relevance of the questionnaire, pilot study was carried out. Five experts, including scholars specialized in sustainable development in construction industry, participated in the pilot study, and their comments had been used in the final questionnaire. In the meantime, they were given a chance to add and remove determinants at the end of each group. With respect to the feedback received, minor amendments were made to the questionnaire. Consequently, questionnaire survey was designed by the use of 20 SSFc and 15 SSC classified into the three sustainable development groups as shown in Tables III and IV, respectively.
List of sustainable success factors
| Factor code | Economical | Factor code | Social | Factor code | Environment |
|---|---|---|---|---|---|
| F1 | Time management | F8 | Safety/Implementation of HSE | F15 | Attempt to preserve environment/environmental protection |
| F2 | Cost management | F9 | Effective communication | F16 | Waste management |
| F3 | Quality management | F10 | Teamwork | F17 | Utilizing Clean and Renewable Energies |
| F4 | Feasibility study | F11 | Job satisfaction | F18 | Environment protection measures in project design |
| F5 | Risk management | F12 | Leadership | F19 | Cleaning up Contaminated Water and Land |
| F6 | Adequate project fund and resources | F13 | Competent project team | F20 | Using Clean Technologies and Materials |
| F7 | Level of local economy | F14 | Motivation |
List of sustainable success criteria
| Criteria code | Economical | Criteria code | Social | Criteria code | Environmental |
|---|---|---|---|---|---|
| C1 | Project completion within time | C6 | Employer satisfaction/Client satisfaction/owner satisfaction | C11 | Environmental degradation |
| C2 | Project completion within budget | C7 | Satisfaction of people in project neighborhood/End user satisfaction/Customer’s satisfaction | C12 | Noise pollution |
| C3 | Project quality | C8 | Provision of employment opportunities | C13 | Effect on air and land pollution |
| C4 | Internal return ratio (IRR)/Return on investment | C9 | Overall health and safety measures | C14 | Adverse impact on historical sites and cultural heritage |
| C5 | Respond to project risks/Overall risk containment | C10 | Satisfaction of staffs/team satisfaction | C15 | Energy consumption |
3.1 Data collection
Based on literature review and experts’ experience, a questionnaire was designed using 20 critical success factors and 15 success criteria which were classified into three sustainable development groups. The questionnaire distributed among the experts, and it was designed based on five-point Likert scale (where 1, 2, 3, 4 and 5 represented “Not Significant,” “Slightly Significant,” “Moderately Significant,” “Very Significant” and “Extremely Significant”, respectively) in order to capture the importance of the critical success factors and criteria. At the end of second step, after gathering questionnaires and analyzing data, the average values were calculated as the relative importance of these determinants which is shown in Tables VI and VII. In order to increase the rate of response and sample representation, the questionnaires were distributed via both e-mail and personal delivery.
Prioritization of the success factors based on the RII
| ID | Factors | Mean | SD | RII | Rank |
|---|---|---|---|---|---|
| F1 | Time management | 4.86 | 0.35 | 0.972 | 1 |
| F2 | Cost management | 4.64 | 0.63 | 0.928 | 2 |
| F12 | Leadership | 4.46 | 0.65 | 0.892 | 3 |
| F4 | Feasibility study | 4.16 | 1.01 | 0.832 | 4 |
| F3 | Quality management | 4.14 | 0.73 | 0.828 | 5 |
| F13 | Competent project team | 4.08 | 0.72 | 0.816 | 6 |
| F15 | Attempt to preserve environment/environmental protection | 4.08 | 0.85 | 0.816 | 7 |
| F14 | Motivation | 4.04 | 0.70 | 0.808 | 8 |
| F9 | Effective communication | 4.02 | 1.03 | 0.804 | 9 |
| F5 | Risk management | 3.98 | 0.74 | 0.796 | 10 |
| F18 | Environment protection measures in project design | 3.92 | 0.90 | 0.784 | 11 |
| F10 | Teamwork | 3.86 | 0.73 | 0.772 | 12 |
| F6 | Adequate project fund and resources | 3.84 | 0.89 | 0.768 | 13 |
| F8 | Safety/implementation of HSE | 3.76 | 0.89 | 0.752 | 14 |
| F16 | Waste management | 3.64 | 0.90 | 0.728 | 15 |
| F11 | Job satisfaction | 3.54 | 0.99 | 0.708 | 16 |
| F19 | Cleaning up contaminated water and land | 3.48 | 0.91 | 0.696 | 17 |
| F20 | Using clean technologies and materials | 3.32 | 0.89 | 0.664 | 18 |
| F7 | Level of local economy | 2.9 | 1.09 | 0.58 | 19 |
| F17 | Utilizing clean and renewable energies | 2.74 | 1.07 | 0.548 | 20 |
Prioritization of the success criteria based on the RII
| ID | Criteria | Mean | SD | RII | Rank |
|---|---|---|---|---|---|
| C3 | Project quality | 4.38 | 0.81 | 0.876 | 1 |
| C1 | Project completion within time | 4.36 | 0.85 | 0.872 | 2 |
| C2 | Project completion within budget | 4.34 | 0.85 | 0.868 | 3 |
| C6 | Employer satisfaction/client satisfaction/owner satisfaction | 4.28 | 0.73 | 0.856 | 4 |
| C11 | Environmental degradation | 4.1 | 0.91 | 0.82 | 5 |
| C9 | Overall health and safety measures | 4.02 | 0.95 | 0.804 | 6 |
| C4 | Internal return ratio (IRR)/return on investment | 3.72 | 1.03 | 0.744 | 7 |
| C15 | Energy consumption | 3.68 | 0.91 | 0.736 | 8 |
| C13 | Effect on land and air pollution | 3.66 | 0.96 | 0.732 | 9 |
| C14 | Adverse impact on historical sites and cultural heritage | 3.66 | 1.01 | 0.732 | 10 |
| C5 | Respond to project risks/overall risk containment | 3.64 | 0.80 | 0.728 | 11 |
| C8 | Provision of employment opportunities | 3.6 | 0.90 | 0.72 | 12 |
| C10 | Satisfaction of staffs/team satisfaction | 3.5 | 0.93 | 0.7 | 13 |
| C7 | Satisfaction of people in project neighborhood/end user satisfaction/customer’s satisfaction | 3.36 | 1.05 | 0.672 | 14 |
| C12 | Noise pollution | 2.8 | 0.83 | 0.56 | 15 |
3.1.1 Case study details and respondent profiles
During the process of conducting this research, in order to determine large-scale projects, 26 various types of infrastructure construction projects had been completed in Iran and five other countries namely Australia, Kazakhstan, Sri Lanka, Norway, Venezuela were also studied. In the current study, numerical threshold around $30 million was considered for determining large-scale construction projects. By applying this tool, 16 out of 44 projects did not meet the required conditions. Therefore, 26 large-scale construction projects were specified as detailed information of these reports is provided in Table V. Moreover, as Han et al. (2009) stated, a megaproject is typically defined as a project that is over 1 billion US dollars with more than five years in durations. According to this definition, in this study 4 out of 44 projects are considered megaproject as well.
Details of large-size construction projects used in study
| Number | Name of project | Location | Project cost (US$Million) | Operation capacity or project size | Source |
|---|---|---|---|---|---|
| 1 | South Pars phase 12 | Iran – Kangan | 7,300 | 71 million cubic meters per day | Contractor |
| 2 | South Pars phase20&21 | Iran – Persian gulf | 4,500 | 57 million cubic meters per day | Contractor |
| 3 | Shazand Arak Refinery | Iran – arak | 203 | 171 Gallon per day | Contractor |
| 4 | Qom monorail system | Iran – Qom | 103 | 6.85 Km | Contractor |
| 5 | Ahwaz Urban Railway Project line one | Iran – Ahvaz | 791 | 23 km, 24 station | Client |
| 6 | Siah Bishe Pumped Storage Project | Iran – Tehran | 260 | 1000 MW | Client |
| 7 | QCLNG Plant | Australia – Queensalnd – Gladstone | 350 | 200 Megalitres a day | Contractor |
| 8 | Tailrace tunnel | Sri Lanka – Wellawaya | 85 | 3600 meters | Contractor |
| 9 | Ohda Residential Complex | Venezuela – Ohda | 500 | 7000 unit | Contractor |
| 10 | Cargo Transportation Route | Kazakhstan – Prorva Port | 1,500 | 8445 km | Contractor |
| 11 | Pareh-sar combined cycle power plant | Iran – Rezvanshahr | 960 | 1000 MW | Client |
| 12 | Abadan Combined Cycle Power Plant | Iran – Abadan | 170 | 210 MW | Client |
| 13 | Oseberg Delta 2 oil field | Norway – North sea | 160 | 18,000 BOE per day | Contractor |
| 14 | Kazeroon combined cycle power plant | Iran – Kazeroon | 153 | 1373 MW | Client |
| 15 | Tabriz Urban Railway Project line two | Iran – Tabriz | 400 | 18000 meters | Contractor |
| 16 | Bandar Abbas Gas Condensate Refinery | Iran – Bandarabbas | 2,600 | 360000 gallon | Consultant |
| 17 | Roudbar Lorestan Dam and Hydro-Power Station | Iran – Roudbar | 330 | 450 MW | Consultant |
| 18 | Tabriz oil refinery | Iran – Tabriz | 198 | 24,000 cubic meters per day | Contractor |
| 20 | Metro project (Section 1 line 3) | Iran – Tehran | 665 | 12000 meters | Client |
| 21 | International Conference Center | Iran – Isfahan | 198 | 16000 square meters | Consultant |
| 22 | Torrens Island Power Station | Australia – Adelaide | 34 | 1280 MW | Contractor |
| 23 | Gotvand Dam | Iran – Gotvand | 68 | 2000 MW | Consultant |
| 24 | Sadr Two-Level Highway | Iran – Tehran | 212 | 5.5 Km | Contractor |
| 25 | Niayesh tunnel | Iran – Tehran | 281 | 10.25 Km | Consultant |
| 26 | Karun-3 Dam | Iran – Khuzestan | 850 | 2000 MW | Consultant |
A total of 54 questionnaires were delivered to the respondents ranging from discipline engineers to project managers participated in the large-size sampled projects. Then, 42 valid questionnaires from 11 contractors, nine clients and 12 consultants were retrieved giving a response rate of 78 percent. Respondents in client and consultant groups were from both private and public sectors in Iran. Their names and addresses were obtained from three main sources: central and local governments such as the Ministry of Roads and Urban Development; educational authorities; public corporations. The target population for contractor and subcontractor groups respondents consisted of large building construction firms (classified and registered as “Grade 1” companies) working in Iran and five other aforementioned countries. Names and addresses of the appropriate people were mainly obtained from the departments of project and construction management in these companies. The average values of working experience (in year) of the clients, consultants and contractors were 15.2, 11.2, and 13.8, respectively. Moreover, all experts had knowledge and experience on implementation of sustainable development.
3.1.2 Using relative importance index method to prioritize the sustainability objectives
In this step, a relative importance index introduced by Kometa et al. (1994) for the first time, had been used and 20 critical success factors and 15 success criteria for each category, from the perspective of project participants, were analyzed and ranked based on the following equation:
Where, wi is the relative importance weight factor (wi) of the expert (i), yi is the rating score ascribed to each success determinant (j) by each expert (i) on the Likert scale from 1 to 5, and z is the highest probable rating value of the Likert scale, which is 5 in this case. The relative importance index (RII) can be derived in a range of 0–1 (0 not inclusive); and the higher its value is, the more important the success determinant will be.
The results of questionnaire are shown in Tables VI and VII. From Table VI and based on SD and RII, top success factors had been selected from each sustainability categories with the thresholds of RII more than 0.7 and standard deviation less than 1. Similarly, from Table VII and based on these thresholds, top three success criteria had been selected from each sustainability categories. As a result, 11 factors and 9 criteria had been selected from three sustainability groups already mentioned. These selected determinants are shown in the success breakdown structure (Figure 2).
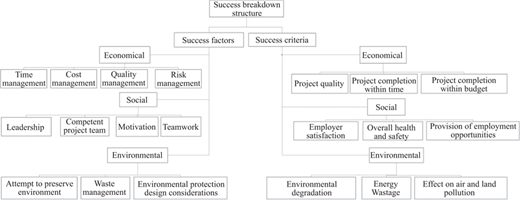
Success breakdown structure based on sustainable development after prioritization
Success breakdown structure based on sustainable development after prioritization
3.1.3 Reliability analysis
In this study, the Cronbach’s α coefficient method (Cronbach, 1951) was used in order to test the reliability of the data. From the information provided by 42 valid respondents, Cronbach’s α coefficient was calculated for three sustainable groups; namely: economic, social, and environmental. The calculation results for success factors and criteria are illustrated in Tables VIII and IX, respectively. Cronbach’s α coefficient for both success factors and criteria are more than 0.7. Therefore, the information derived from the questionnaire is considered reliable.
Cronbach’s α of success factors
| Cronbach’s α=0.89 | Mean=77.08 | SD=9.76 | Number of respondents=42 | Number of items=20 | |||||||
|---|---|---|---|---|---|---|---|---|---|---|---|
| Economical aspect | Social aspect | Environmental aspect | |||||||||
| Code | Mean if item deleted | SD if item deleted | Cronbach’s α if Item deleted | Code | Mean if item deleted | SD if item deleted | Cronbach’s α if item deleted | Code | Mean if item deleted | SD if item deleted | Cronbach’s α if Item Deleted |
| F1 | 72.23 | 9.67 | 0.89 | F8 | 73.29 | 9.20 | 0.88 | F15 | 73.00 | 9.41 | 0.89 |
| F2 | 72.46 | 9.48 | 0.88 | F9 | 73.04 | 9.10 | 0.88 | F16 | 73.44 | 9.22 | 0.88 |
| F3 | 72.98 | 9.30 | 0.88 | F10 | 73.56 | 9.14 | 0.88 | F17 | 74.33 | 9.07 | 0.88 |
| F4 | 72.92 | 9.29 | 0.88 | F11 | 73.46 | 9.16 | 0.88 | F18 | 73.15 | 9.10 | 0.88 |
| F5 | 73.10 | 9.52 | 0.89 | F12 | 72.58 | 9.41 | 0.88 | F19 | 73.60 | 9.10 | 0.88 |
| F6 | 73.27 | 9.37 | 0.89 | F13 | 73.00 | 9.34 | 0.88 | F20 | 73.75 | 9.14 | 0.88 |
| F7 | 74.19 | 9.59 | 0.90 | F14 | 73.23 | 9.39 | 0.88 | ||||
Cronbach’s α of success criteria
| Cronbach’s α=0.87 | Mean=56.63 | SD=8.15 | Number of respondents=42 | Number of items=15 | |||||||
|---|---|---|---|---|---|---|---|---|---|---|---|
| Economical aspect | Social aspect | Environmental aspect | |||||||||
| Code | Mean if item deleted | SD if item deleted | Cronbach’s α if item deleted | Code | Mean if item deleted | SD if item deleted | Cronbach’s α if item deleted | Code | Mean if item deleted | SD if item deleted | Cronbach’s α if item deleted |
| C1 | 52.27 | 7.67 | 0.86 | C6 | 52.38 | 7.82 | 0.87 | C11 | 52.54 | 7.67 | 0.86 |
| C2 | 52.31 | 7.73 | 0.86 | C7 | 53.29 | 7.45 | 0.86 | C12 | 53.85 | 7.70 | 0.86 |
| C3 | 52.27 | 7.54 | 0.85 | C8 | 53.02 | 7.94 | 0.88 | C13 | 53.15 | 7.78 | 0.87 |
| C4 | 52.94 | 7.56 | 0.86 | C9 | 52.63 | 7.33 | 0.85 | C14 | 52.98 | 7.59 | 0.86 |
| C5 | 53.00 | 7.70 | 0.86 | C10 | 53.15 | 7.50 | 0.85 | C15 | 52.98 | 7.62 | 0.86 |
3.2 Measurement of project success based on sustainability
3.2.1 Using analytical hierarchy process (AHP) Approach to calculate success criteria weight factor
The AHP developed by Sikder and Munakata (2009) has been widely used for multi criteria decision making. In this study, in order to measure success of projects based on sustainability and to compare the importance of different aspects of sustainability in successful implementation of projects, after omitting low-effect criteria, a questionnaire was designed based on AHP method for weighting the SSC.
This questionnaire was distributed among 20 experts who had participated in large-scale projects. Those questionnaires that had been retuned at this stage were analyzed by Expert Choice software. We used widely accepted nine-point scale, which is the original scale suggested by Sikder and Munakata (2009). The meaning for each value is shown in Table X.
Pairwise comparison scale
| Level of importance | Definition |
|---|---|
| 1 | Equal importance |
| 3 | Weak importance of one over another |
| 5 | Essential or strong importance |
| 7 | Very strong or demonstrated importance |
| 9 | Absolute importance |
| 2,4,6,8 | Intermediate values between adjacent scale values |
In this approach, the numerical values representing the judgments of the pairwise comparisons were arranged in the upper triangle of the square matrix. For example, aij represents how much criteria i is preferred over criteria j. This means that:
In this step, the analytical hierarchical process was utilized to compute the relative importance weight factor (wi) of the success criteria. The corresponding weight factors for project success criteria are shown in Table XI.
Weight factors for the final project success criteria
| Group of criteria | Criteria code | Project success criteria | Mean rank | Weight factors based on rank method | Weight factors based on AHP |
|---|---|---|---|---|---|
| Economical aspect | C3 | Project quality | 4.38 | 0.33 | 0.31 |
| CC1 | Project completion within time | 4.36 | 0.33 | 0.38 | |
| C7C2 | Project completion within budget | 4.34 | 0.33 | 0.31 | |
| Social aspect | C6 | Employer satisfaction | 4.28 | 0.36 | 0.43 |
| C9 | Overall health and safety measures | 4.02 | 0.34 | 0.34 | |
| C8 | Provision of employment opportunities | 3.6 | 0.3 | 0.23 | |
| Environmental aspect | C11 | Environmental degradation | 4.1 | 0.36 | 0.48 |
| C15 | Energy consumption | 3.68 | 0.32 | 0.37 | |
| C13 | Effect on land and air pollution | 3.66 | 0.32 | 0.15 |
Table XI shows the weight of the project success criteria according to the AHP and rank method. Since the opinions of all experts had been considered to be have an equal importance, the geometric mean was applied as the aggregation method to calculate the weights of the success criteria. With respect to the weight factors, the success indices of the three categories of sustainability are calculated using the following equations:
where ECSI is the economical success index; SOSI is social success index, ENSI is environmental success index.
Furthermore, the results from the pairwise comparison matrices of the sustainable categories are detailed in Table XII. Also, Table XIII shows normalized priorities of these values. As shown in Table XIII, economic category is the most important one (62 percent). It was two to four times greater than that of the social category (24 percent) and environmental category (14 percent), respectively. Therefore, most attention should be paid to economic point of view, whilst less attention is needed for the social and environmental aspects. It should be mentioned that the consistency rate of this model is 0.04. According to Table XIII, the SSI is calculated as follows:
where SSI is the sustainable success index.
3.2.2 Evaluation of success determinants of case studies
At this stage, also, respondents were asked to give a score based on the status of selected success factors and criteria in the aforementioned projects which they were responsible to them; these numbers were between 1 and 5 where: 1 represents “very bad,” 2 – “Slightly bad,” 3 – “Moderate,” 4 – “good,” and 5 – “excellent.” Finally, based on Equation 5, the SSI of these projects had been calculated and a decision table used in RST was created.
3.3 Rough sets: foundations
The fundamental concept of the rough set algorithm for the proposed application is described as follows:
Information Systems
Information systems are the set of objects described by their attributes and attribute values. The information system is defined as follows:
where U is the universe, a finite non-empty set of objects, U={x1, x2 ,..., xm}, and A is the set of attributes. Each attribute a∈A (attribute a, belonging to the considered set of attributes A) defines an information function:
where Va is the a set of values of a, called the domain of attribute a. In all attributes, there are decision attributes and condition attributes:
Indiscernible relation
Let a∈A and B ⊆ A, where B is a subset of attributes. Then, the indiscernibility relation is defined as:
where the partition of U is a family of all equivalence classes of IND(B) and is denoted by U/IND(B). If(x, y)∈IND(B) then x and y are indiscernible (or indistinguishable) by attributes from B:
Lower and upper approximation
The rough sets approach is based on two basic concepts, namely the lower and the upper approximations of a set. Let B ⊆ C and X ⊆ U:
and are the B-lower approximation of X and the B-upper approximation of X, respectively. The B-lower approximation of X is the set of attributes of U that can definitively be classified as belonging to X based on the information of B, while the B-upper approximation of X is the set of attributes of U that can be probably classified to X.
The difference is called a boundary of X in U:
If BNX ≠ ϕ, then X is referred to as rough with respect to B; otherwise, X is crisp:
Partial dependency
If a decision attribute D depends totally on C, denoted as C⇒D, all values of D are uniquely determined by the values of C (Pawlak et al., 1988). To generalize this concept, Pawlak et al. (1988) had introduced the concept of partial dependency of attributes, which means that “some values of D are determined by the values of C.”
When D depends on C to a certain degree γ(0⩽γ⩽1), we can denote the relation as C⇒γ D, where:
if γ is 1, D totally depends on C; otherwise, it partially depends on C:
Core and reduct of attributes
The concepts of core and reduct are two fundamental concepts of the rough sets theory. A reduct is the minimal subset of attributes that enables the same classification of elements of the universe as the entire set of attributes. In other words, properties that do not belong to a reduct are superfluous with regards to the classification of elements of the universe. The core is the necessary element for rules, and is the common portion of all reducts. Let B be a subset of A. The core of B is the set of all indispensable attributes of B. The following equation is an important property, linking the concept of the core and reducts:
where Red(B) is the set of all reducts of B.
The significance of an attribute can be measured by comparing the degree of partial dependency (γ) of a set, which includes the attribute, with the degree of a set without the attribute. This idea can be formally described as follows:
Where a∈C, and σ(a) is the significance of attribute a (0 ⩽ σ(a) ⩽ 1).The significance of a set of attributes can be calculated in the same way as follows:
Where B is a subset of C. The significance of a set B, i.e., σ(B), represents the effect of elimination of the set. Thus, the set of decision attributes D will not be properly classified into the same extent as the degree of σ(B) when taking out set B from C, the set of condition attributes. Thus, we can determine an approximate reduct, the best subset for explaining a decision, by determining the significance of all possible sets.
3.4 Decision language
It is often useful to describe decision tables in logical terms. Every dependency C⇒γ D can be described by a set of decision rules in the form “IF […] THEN […],” written Φ→Ψ, where Φ and Ψ are logical formulas such that Φ∈For(C), Ψ∈ For(D) and C, D are condition and decision attributes, respectively; Φ and Ψ are referred to as condition and decision parts of the rule, respectively. With every decision rule Φ→Ψ, we associate a conditional probability that Ψ is true in S, given Φ is true in S with the probability πS (Φ) called certainty factor and is defined as follows:
where |Φ|S denotes the set of all objects satisfying Φ in S, and the number card (|Φ∧Ψ|S) will be called the support of the rule Φ→Ψ in S. Besides, we will also use a coverage factor of the decision rule defined as:
Which is the conditional probability that Φ is true in S, given Ψ is true in S with the probabilityπS(Ψ).
Let {Φi→Ψ} be a set of decision rules such that all conditions Φi are pairwise mutually exclusive, i.e., {Φi∧Φj}s=Φ, for any <I, j⩽n, i≠j, .
For any decision rule Φ→Ψ the following relationship between the certainty factor and the coverage factor is true:
4. Results and discussion
4.1 Attribute reduction and rules generation
As described earlier, RST is used to identify the most significant features by computing subsets and cores. In order to generate reducts, genetic algorithm is applied as it provides more exhaustive exploration of the search space (Wroblewski, 1995). Generation of reducts has two options; full object reduction and object related reduction. Object-related reduction produces a set of decision rules through minimal attributes subset that distinguishes a per object basis while reduct with full object reduction creates a set of minimal attributes subset that designates functional dependencies (Sulaiman et al., 2008).
In this study, full object reduction approach is adopted. Therefore, the reducts used for generating rules in economic, social and environmental categories are [F15, F16, F18], [F12, F10, F13, F14], [F15, F16, F18], respectively. A unique feature of the RS method is its generation of rules, which has a great importance in prediction of the outputs. For this purpose, the Rosetta system was applied to induce rough-based models. Rosetta tool lists the rules and provides some statistics for the rules which are support, accuracy, coverage, stability and length. The definition of the rule statistics is as follows (Sulaiman et al., 2008):
The rule LHS support is defined as the number of objects in the training data that fully demonstrate attribute described by the IF condition.
The rule RHS support is defined as the number of objects in the training data that fully exhibit the attribute described by the THEN condition.
The rule RHS accuracy is defined as the number of RHS support divided by the number of LHS support.
The rule LHS coverage is the fraction of the records that satisfied the IF conditions of the rule. It is calculated by dividing the support of the rule by the total number of records in the training sample.
The rule RHS coverage is the fraction of the training records that satisfied the THEN conditions. It is obtained by dividing the support of the rule by the number of objects in the training that satisfied the THEN condition.
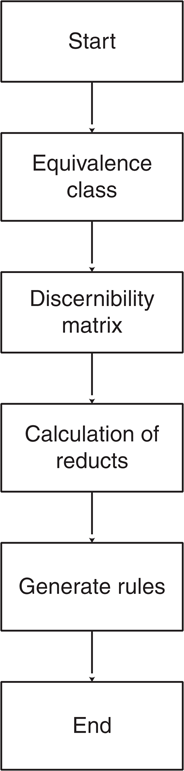
Number of primary decision rules generated based on reducts produced in economic, social and environmental categories is 17, 18, 16, respectively. The process of rules generation is illustrated in Figure 3. To raise effectiveness, this study filters the decision rules according to the principle LHS support ⩾ 2. Using Rosetta, rules with the highest LHS Support in all sustainable groups are extracted. These rules are sorted based on LHS Support in the Table XIV. It is noteworthy that the LHS Support indicates the number of projects satisfying the condition of the rule while the RHS Support indicates the number of projects satisfying the decision of the rule. In the current study, based on the set of rules generated, the projects were classified into four categories.
Filtered rules extracted from Rosetta software
| Success perspective | Rule | LHS support | RHS support | RHS accuracy | LHS coverage | RHS coverage | Class |
|---|---|---|---|---|---|---|---|
| Economical | F1(4) AND F2(4) AND F3(4) AND F4(3)→Economical Success(4) | 4 | 4 | 1 | 0.21 | 0.57 | 3 |
| F1(3) AND F2(3) AND F3(4) AND F4(4)→Economical Success(3) | 3 | 3 | 1 | 0.16 | 0.50 | 2 | |
| F1(3) AND F2(4) AND F3(4) AND F4(2)→Economical Success(4) | 2 | 2 | 1 | 0.11 | 0.29 | 3 | |
| F1(1) AND F2(2) AND F3(1) AND F4(3)→Economical Success(2) | 2 | 2 | 1 | 0.11 | 0.50 | 1 | |
| F1(2) AND F2(1) AND F3(4) AND F4(1)→Economical Success(2) | 2 | 2 | 1 | 0.11 | 0.50 | 1 | |
| F1(1) AND F2(3) AND F3(4) AND F4(2)→Economical Success(3) | 2 | 2 | 1 | 0.11 | 0.33 | 2 | |
| F1(4) AND F2(5) AND F3(5) AND F4(3)→Economical Success(5) | 2 | 2 | 1 | 0.11 | 1.00 | 4 | |
| F1(5) AND F2(3) AND F3(4) AND F4(3)→Economical Success(3) OR (4) | 2 | 1, 1 | 0.5, 0.5 | 0.11 | 0.17, 0.14 | 2,3 | |
| Social | F12(4) AND F10(3) AND F13(3) AND F14(4)→social success(3) OR (4) | 4 | 3, 1 | 0.75, 0.25 | 0.22 | 0.5, 0.14 | 2,3 |
| F12(3) AND F10(4) AND F13(4) AND F14(4)→social success(4) | 2 | 2 | 1 | 0.11 | 0.29 | 3 | |
| F12(4) AND F10(5) AND F13(4) AND F14(5)→social success(5) | 2 | 2 | 1 | 0.11 | 1.00 | 4 | |
| F12(5) AND F10(4) AND F13(3) AND F14(5)→social success(4) | 2 | 2 | 1 | 0.11 | 0.29 | 3 | |
| F12(5) AND F10(4) AND F13(4) AND F14(4)→social success(4) | 2 | 2 | 1 | 0.11 | 0.29 | 3 | |
| F12(2) AND F10(2) AND F13(3) AND F14(2)→social success(2) | 2 | 2 | 1 | 0.11 | 0.67 | 1 | |
| F12(2) AND F10(3) AND F13(2) AND F14(4)→social success(2) OR (3) | 2 | 1, 1 | 0.5, 0.5 | 0.11 | 0.34, 0.17 | 1,2 | |
| F12(3) AND F10(2) AND F13(2) AND F14(4)→social success(3) | 2 | 2 | 1 | 0.11 | 0.33 | 2 | |
| Environmental | F15(4) AND F16(3) AND F18(2)→environmental success(4) OR (3) | 3 | 1, 2 | 0.34, 0.67 | 0.16 | 0.14, 0.5 | 2,3 |
| F15(1) AND F16(1) AND F18(3)→environmental success(2) | 3 | 3 | 1 | 0.16 | 0.60 | 1 | |
| F15(4) AND F16(3) AND F18(3)→environmental success(3) | 2 | 2 | 1 | 0.11 | 0.50 | 2 | |
| F15(5) AND F16(4) AND F18(4)→environmental success(5) OR (4) | 5 | 3, 2 | 0.6, 0.4 | 0.26 | 1.0, 0.29 | 3,4 | |
| F15(4) AND F16(4) AND F18(3)→environmental success(4) | 2 | 2 | 1 | 0.11 | 0.29 | 3 | |
| F15(4) AND F16(4) AND F18(5)→environmental success(4) | 2 | 2 | 1 | 0.11 | 0.29 | 3 | |
| F15(3) AND F16(2) AND F18(2)→environmental success(2) | 2 | 2 | 1 | 0.11 | 0.40 | 1 |
4.2 Classification process
Classification process is performed using SSI. In ROSETTA classification algorithm, the induced rules are used for the classification process. In this process 26 large-scale construction projects are classified into four categories as it is shown in Table XV. In this table, class label is the amount of SSI which was calculated for each of sustainable groups based on Equations (2)-(4). Also, since there was no project with SSI below 2, the lowest amount for class label is 2.
4.3 Model validation
Based on the filtered rules and the classification process described, the recognition ability of the model was validated. A confusion matrix is a specific table which summarizes the performance of an algorithm, applied to the objects in an information system. Each column of the matrix represents the cases in a predicted class, while each row represents the cases in an actual class. The results for the three aforementioned sustainability aspects are shown in the Table XVI, such that the italic values are those samples classified correctly by the model developed in this study.
Confusion matrix of classification results
| Predicted | |||||||
|---|---|---|---|---|---|---|---|
| Sustainability perspective | Class 1 | Class 2 | Class 3 | Class 4 | Sensitivity | ||
| Actual value | Class 1 | 5 | 0 | 0 | 0 | 1 | |
| Class 2 | 0 | 4 | 0 | 0 | 1 | ||
| Economical | Class 3 | 0 | 1 | 4 | 2 | 0.57 | |
| Class 4 | 0 | 0 | 0 | 3 | 1.00 | ||
| Accuracy | 1 | 0.8 | 1 | 0.6 | 0.84 | ||
| Environmental | Actual value | ||||||
| Class 1 | 4 | 0 | 0 | 0 | 1.00 | ||
| Class 2 | 0 | 6 | 0 | 0 | 1.00 | ||
| Class 3 | 0 | 1 | 6 | 0 | 0.86 | ||
| Class 4 | 0 | 0 | 0 | 2 | 1.00 | ||
| Accuracy | 1 | 0.86 | 1 | 1 | 0.95 | ||
| Social | Actual value | ||||||
| Class 1 | 3 | 0 | 0 | 0 | 1.00 | ||
| Class 2 | 1 | 5 | 0 | 0 | 0.83 | ||
| Class 3 | 0 | 1 | 6 | 0 | 0.86 | ||
| Class 4 | 0 | 0 | 0 | 2 | 1.00 | ||
| Accuracy | 0.75 | 0.83 | 1 | 1 | 0.89 | ||
As to economic perspective, in class 1, 48 sets are classified correctly and two sets are wrongly classified to class 1 and class 2, with accuracy of 86 percent. Other classes are classified correctly, and the accuracy is 1. In the social category, although class 3 and 4 are classified correctly, accuracy for class 1 and 2 is 75 and 83 percent, respectively. Similarly, from environmental perspective only two classes were correctly classified. As to class 2, four sets are classified correctly and one set is classified wrongly to class 3. Therefore, the accuracy is 80 percent, and the accuracy rate of class 4 is 60 percent which is a lowest amount in comparison to other classes. Two other classes are classified correctly and the accuracy is 1. As to all sets, the rules generated can classify 83 percent of the sets. Besides this, as it can be seen in table XIII, overall accuracies (accuracy plus sensitivity) of the proposed system for economic, social and environmental perspectives are 84, 95 and 89 percent, respectively. Sensitivity and accuracy of the sustainable categories of each class are presented as well.
5. Conclusion
Infrastructure projects, especially large-size ones, play a pivotal role in economic, social, and environmental activities, particularly in developing countries like Iran. Hence, in this paper, after introducing a SSI, a novel method called “rough set approach” was adopted to induce decision rules and to classify construction projects accordingly.
Literature review shows that the success measurement of construction projects is slowly going beyond the traditional measures (such as cost, time, and quality). A critical review of publications related to project success revealed that there has been lack of comprehensive study on the CSFs and CSC from the sustainable development perspective. Moreover, economic success factors such as time and cost management which were perceived to be the most important contributing factors have been rarely discussed and have not been widely researched.
At first, the paper classified 20 effective success factors and 15 success criteria based on three pillars of sustainability: economic, social, and environmental. The study used expert judgment to prioritize these success determinants. Success of 26 large-size construction projects in Iran and five other countries, as case studies, was assessed to develop the proposed model. Success factors were adopted as conditional variables and success criteria were considered as decision variables and used as output in development of the rough-based model. Typical critical success factors included time management, cost management, leadership, feasibility study, quality management, competent project team, attempt to preserve environment, motivation, effective communication, and the most important success criteria included project quality, project completion within time, project completion within budget, employer satisfaction, environmental degradation, overall health and safety measures. The detailed list of success factors and criteria are provided in Tables VI and VII.
This research proved that there is sometimes a major difference between what is recorded in literature and professionals’ opinions about the importance of project success criteria and factors. Although the present study has supported the other study implying that time is the most important project success criterion, but the other important criteria ranked by respondents were not in accordance with the literature review. The respondents believed that in addition to time, cost and quality, other criteria such as employer satisfaction, environmental degradation, overall health and safety measures should be also taken into account. This can be supported by Collins and Baccarini (2004) who believe that time, cost and quality are not merely project success criteria. Contrary to other studies, the most important project success factors were time and cost management, which were rarely addressed in previous studies.
After identifying the success-related determinants, an intelligent data analysis approach was applied on the basis of RST to generate classification rules from a set of 26 large-size construction projects. In the analysis process, ROSETTA toolkit was run to generate the rules. After reducing, generating and filtering rules, the rule-based system was built. Finally, the method was validated by using test samples. Moreover, based on the set of generated rules, the projects were classified into four categories.
Classification process was performed using SSI. In ROSETTA classification algorithm, the induced rules were used for the classification process. Using this process, 26 large-size construction projects were classified into four categories as shown in Table XV. The number of primary decision rules generated based on the reduce produced in economic, social and environmental categories were 17, 18, and 16, respectively. The process of rules generation is illustrated in Figure 3. Furthermore, the results obtained from the pairwise comparison matrices of the sustainable categories showed that economic category is the most important one (62 percent). It was two and four times greater than that of the social category (24 percent) and Environmental category (14 percent), respectively. Therefore, most attention should be paid to economic point of view, whilst less attention is needed for social and environmental aspects (Table XVI).
Rough confusion matrix was used to evaluate the performance of the predicted classes. The test results showed that overall accuracy (accuracy plus sensitivity) of the proposed system for economic, social and environmental perspectives was found to be 84, 95 and 89 percent, respectively. Therefore, in contrast to other conventional approaches, RST is an effective mathematical tool to deal with imprecise, uncertain and incomplete data. The present study showed that RST seems to be an effective tool and a valuable aid for building expert systems. The rules induced in this study can be applied to learn a potential further decision support system through which a manager would be able to predict SSI. Indeed, by observing the project status in each stage, prediction would be possible based on historical data of the previous projects. Thus, further studies can focus on the establishment of a prediction model by combining rough sets with other intelligent systems like neural networks, fuzzy approaches, and so forth to build a decision support system.
This study does have some limitation. In the current study the number of large-scale construction projects and subsequent extracted rules were limited. Therefore, in future studies, it would be interesting to ascertain whether the identified SSFs and SSC can be generalized across different countries using similar studies. Although the adequacy of the questionnaire determinants and the number of projects were tested with a pilot study, it would not be concluded that the number of projects and selected success determinants is definite. Since using greater number of samples will more likely generate better results, further studies can be conducted with greater number of projects. It is noteworthy that, applying another approach e.g. Life Cycle Assessment for evaluating environmental impacts of projects, alternatively will have more objective and practical results, rather than questionnaire which is merely on the basis of project managers’ perceptions, which can be taken into account in the future studies.

