


The frequency and severity of climate change-induced disasters against infrastructure projects have risen in recent times. Extreme weather conditions create floods, wildfires, hurricanes and typhoons which completely or partly destroy infrastructure projects such as roads, hospitals and power stations. As these climate change events intensify, climate finance has become an essential and innovative financial solution to achieve climate-resilient infrastructure projects. Thus, this study aims at exploring the critical success factors of climate finance for sustainable infrastructure projects.
Questionnaire data were taken from stakeholders on infrastructure projects in different countries, and it was analysed with fuzzy synthetic method.
The critical success factors from the data analysis include financial resilience strategies, decarbonization of economies, low interest rates, carbon-stranded assets, risk management, renewable energy and sustainable economic growth.
Even though, the study presents important success factors on climate finance solutions for infrastructure development, further studies should delve into the differences of the factors based on location (country or region), project type and other conditions.
The results provide actionable information for policymakers, infrastructure professionals and financial institutions. The study gives insights into the checklists of social, ecological and economic practices on climate finance factors in infrastructure projects.
This article offers insights into success factors on climate finance from stakeholders on the key measures on the adoption of climate finance for sustainable infrastructure projects. Additionally, as the first of its kind, the study bridges the theory-practice gap with the application of fuzzy method which translates loosely related opinions of professionals on climate finance success factors into objective decision-making solutions for infrastructure projects.
1. Introduction
Extreme climate change is a disastrous challenge affecting the planet and everyone (Hutchins et al., 2019). With increasing greenhouse gas concentrations in the atmosphere due to human activities such as fossil fuel combustion, deforestation and industrialization, the status of global temperatures has risen to alarming rate in recent times (Labaran et al., 2022; Mokhov, 2022). According to the Intergovernmental Panel on Climate Change (IPCC) reports, without immediate and substantial strategies to address carbon emissions into the atmosphere, the target to meet 1.5 °C pre-industrial climate change average could be impossible (McCulloch et al., 2024). Rising ocean levels, melting ice sheets and glaciers, heatwaves, wildfires and flooding are key consequences of climate change (Filonchyk et al., 2024). Further, infrastructure project development and operation have significantly accounted to these incidents of global warming with reliance and usage of fossil energy products (Akomea-Frimpong et al., 2023). At the same time, infrastructure projects are vulnerable to the impacts of changes in the climatic conditions. Climate change accounts for the washing away of infrastructures, delay in the delivery of projects, and increased cost budgets from flooding and bushfires. Thus, there is a heightened interest and demand among the stakeholders within the infrastructure sector to develop projects that are resilient to climate change and minimize greenhouse gas emissions (Elhegazy et al., 2024; Sajid et al., 2024). This demand for resilient infrastructures has been necessitated because climate risks also have direct and formidable effects on stakeholders (persons) not only the physical infrastructure. They trigger physical health problems to users and inhabitants of the infrastructures due to extreme heat, water pollution, infectious respiratory diseases and even death from climate disasters (Nissanka et al., 2024). According to the World Health Organisation, 3.6 billion people occupying different housing infrastructures are at risk of heatwaves with increased cost implications (Tawsif et al., 2022). For instance, in Australia, an estimated value of $768.5 billion for about 953,000 houses have been rated as likely to be washed away in flood zones which led to death, increased out-of-pocket healthcare coverage (Nguyen et al., 2022). Additionally, extreme heat, dust, chemicals and unbearable weather put more than 25000construction workers globally at the highest zone of health risk every year (Dong et al., 2019). The direct health coverage costs from worsening weather conditions for contractors has also been pegged at US$ 230–470 million per year (Oruc et al., 2024).
Among the several measures taken by key stakeholders such as governments, contractors and financial institutions, climate finance (CF) has been determined as one of the topmost solutions to mitigate these problems associated with climate change. Climate finance is an innovative and collaborative financial package which funds, and sponsors climate-friendly infrastructure project management practices (Bracking and Leffel, 2021). It is a sustainable financing tool aim at minimizing the threats of climate change with financial solutions for transitioning to the infrastructure sector to zero-carbon status (Akomea-Frimpong et al., 2022). Climate finance initiatives also offer long-term packages to bridge the financial gap between eco-friendly projects, leveraging the strengths of governmental and non-governmental institutions to develop, operate, and maintain sustainable infrastructure projects (Bowman and Minas, 2019). These long-term climate finance partnerships in the form of climate funds, green climate finance fora and climate change financial support are essential to achieve the climate targets outlined in international climate agreements. Scholars such as Bhandary et al. (2021) and Steckel et al. (2017) further explained CF as climate-conscious capital relevant for affordable, low-risk and interest-free green loan facilities to assist sustainable infrastructure. The various CFs offer a broad spectrum of sustainable infrastructure finance products for transportation networks, energy systems and water management. (Amankwa et al., 2024).
However, contemporary and few studies in the infrastructure engineering and management domain on CF have focused in a limited area of the sector (Akomea-Frimpong et al., 2025c). In addition, past studies have demonstrated little detail about the application of CF in the infrastructures in practice (Debrah et al., 2022). Studies such as Umar and Safi (2023) found that public budgeting on CF for energy innovation in OECD countries has significantly improved environmental quality with the end goal of reducing CO2 emissions. Nonetheless, this study excluded information about the relevance and practicality of CF in infrastructure projects. Lee et al. (2022) also showed that developed countries have increased the setting up of climate fund groups to support budgets for innovation in renewable energy infrastructure and supply to lower GHG emissions. Nevertheless, this study was limited to combating carbon emissions from the manufacturing industries, and it was not applicable to infrastructures projects such as roads and buildings. All the above-mentioned studies recounted that the successful implementation of CF is contingent upon several factors, which encompass not only the project's design and implementation but also broader socio-political and economic drivers. However, there is absent of a study investigating into the CF and sustainable infrastructures. Therefore, the purpose of this study is to investigate the critical success factors on CF for sustainable infrastructure projects. The research objectives include: (1) to identify the critical factors influencing climate finance for sustainable infrastructure projects; (2) To establish the principal components (or groups) of the critical factors facilitating climate finance in sustainable infrastructure projects. The remaining parts of this article include Section 2 (review of past studies). Section 3 elaborates on the methodological processes of putting together the study while Section 4 presents the results and discursive outcomes of the study. Section 5 concludes the article with the limitations, implications, and directions.
2. Literature review
2.1 Sustainable infrastructure projects
Traditionally, infrastructure projects have been designed and located based on historical weather patterns, often overlooking projections of future climate change impacts (Ahmed et al., 2021). Climate information has seldom been systematically incorporated into project planning, design and standards development (Nissanka et al., 2024). Recent studies suggest this historical approach risks stranded or “maladapted” assets that do not withstand future climate conditions (Hurlimann et al., 2019). For example, studies have shown many coastal transportation networks and utility corridors located in low-lying zones vulnerable to sea level rise through 2,100; however, designs and specifications rarely consider long term climate risks like these (Rosenzweig et al., 2018). Climate change is widely recognized as one of the greatest challenges of infrastructure development (Gunawansa and Kua, 2014). Many infrastructure projects in coastal cities face increasing risks from sea level rise and extreme weather due to climate change (Kendrovski et al., 2014). Additionally, global mean temperatures have increased, and their effects are seen on the physical deterioration of infrastructure projects beyond the coastal communities. The cases of hydrometeorological climate disasters for infrastructure projects have also increased from uncharted weather patterns extending the deadlines of constructing projects. For instance, Fiji National Disaster Management Office (FNDMO) reported in 2023 that many road projects in the country have been closed due to continuous downpour of rain. In 2025, community projects and houses in Los Angeles and other parts of the state of California in the US experienced wildfires from severe weather drought.
2.2 Climate finance (CF)
Global climate finance has grown substantially and is projected to surpass US$9 trillion by 2030 (Newell, 2025). However, according to Lee et al. (2022), CF involvement in project funding remains relatively low, with only an estimated 18% share of the capital structure of sustainable projects. Most climate finance has focused on mitigation, with adaptation accounting for an estimated 16–20% of global totals each year. Financing from bilateral, regional and other public sources for adaptation outstrips financing from multilateral climate funds, which have mobilized more than US$1 trillion since 2010 (Sieber and Erzini Vernoit, 2024). However, domestic resource mobilization has accounted for the greater finance of adaptation costs to date (Kalinowski, 2024). This underlines the need to leverage substantial private co-finance for adaptation efforts in line with the countries’ priorities and needs. The collaborations between public and private investments play a significant role in building climate-resilient projects (Ngo et al., 2024). Green features and finance enable street lighting retrofits in the UK to benefit from lower emissions and adaptation to warming climate (Bracking and Leffel, 2021). Climate change impacts increase transaction costs of these projects by increasing technical and financial risks (Larrea, 2024). Climate risks undermine asset bankability and deter private sector investments from financing green projects (Griffith-Jones et al., 2020). Investors face higher perceived risks associated with climate-smart technologies owing to uncertain returns, lack of track record and required upfront premium costs (Chen et al., 2024). Policy and regulatory uncertainty deter investments in low-carbon project alternatives (Lamptey et al., 2023).
2.3 CF for sustainable infrastructures projects
Owusu-Manu et al. (2023) mentioned that CF assist in emission reduction strategies for building projects. The goal of CF in the built environment is to enhance resilience to climatic conditions. However, this article conflated the terminologies of green finance, green bond and climate finance minimising the criticality of the influencing factors to facilitate climate funding in projects. Specifically, this is study focuses on success factors on climate financing of infrastructures. Cudjoe et al. (2023) stated that the funding sources of projects include international markets, private investors, and national budgets. These are further classified into public-private financing arrangements, green bonds, climate funds, and clean energy financial corporations (Belianska et al., 2022). Despite these important classifications, these studies did not delve into the determinants of the CF unlike this study to support infrastructure development around the world. In addition, CF are formalized into state-sponsored climate change funds such as New South Wales Climate Fund (Australia) to activate climate action in infrastructure projects (Chen et al., 2024). However, the factors that account for the state government to promote CF in funding infrastructures were not discussed whiles this study focus on the success factors. The application of CF in infrastructure projects requires the identification of priority influencing factors (CFPs). Kissinger et al. (2019) and Nedopil et al. (2022) found empirical support for a taxonomy of measures for CF in projects: (1) clear and enforceable contracts, (2) competitive selection of private partners, (3) appropriate risk allocation between parties, (4) sound government support and commitment, (5) economic regulation, (6) political feasibility, and (7) macroeconomic stability. Nonetheless, these studies were conducted with literature review methodology without empirical testing of the review outcomes. But this study draws empirical data from stakeholders on infrastructure projects to analyse the success factors. Other studies, such as Debrah et al. (2024) and Wane and Kaïré (2023) emphasize additional factors including technical, managerial and community dimensions. These studies were limited in scope on geographical outreach to climate finance for infrastructure projects. This study conducts international survey expanding the reach to stakeholders. Project designers should build capabilities using locally appropriate technologies and finance matching existing technical skillsets (Owusu-Manu et al., 2023). The 2015 Paris Climate Conference (COP21) represented a landmark development in establishing a framework for global climate finance for infrastructures beyond 2030 (Volz et al., 2023). However, current policies and implementation plan on CF in the projects leaves an 'implementation gap' on the vague agreements on key determinants that support global climate targets (SDG 13) for infrastructure projects. Against this backdrop of differences, this article addresses the gaps in existing literature outlined in above studies by analysing success factors (CFPs) on climate finance to achieve sustainable development goals in infrastructure projects.
3. Research methodology
3.1 Review of studies
The starting point of this research was a review of one hundred and seventy-two (172) documents including journal articles and infrastructure project reports. These documents were sourced from Scopus, JSTOR, EBSCOhost, ProQuest, ScienceDirect, Google Scholar, and Web of Science. The initial search outcome of 246 retrieved documents from the search engines were thoroughly screened based on the titles and the abstracts. Articles which were unrelated to this topic were deleted with the remaining 172 further analysed with the sole inclusion criteria being whether a document comprehensively address “climate finance” and “sustainable infrastructures”. During the screening and selection process the articles were reviewed by three co-authors, and the corresponding author who is the supervisor of this study acted as the independent party to resolve disagreements on relevant papers and minimize subjective biases. Additionally, the 172 articles were assessed using Joanna Briggs Institute (JBI) checklists to address systemic errors and biases (Santos et al., 2018). Finally, the factors were selected during the reading of the 172 documents. All the co-authors retrieved, compared and approved the factors after reading the documents. Additionally, the factors were sent to fourteen (14) experienced industry practitioners and senior lecturers in a pilot study to ascertain their relevance to climate finance in sustainable infrastructure (Akomea-Frimpong et al., 2025b). These experts agreed to the relevance of the factors and recommended changes to the words of the factors together with removal of some of the factors leading to final list of nineteen (19) CFPs. in Table 1.
Key success factors on climate finance in sustainable infrastructures
| Code | Climate finance factors | Sources |
|---|---|---|
| CFP1 | Lower access costs to climate finance | Belianska et al. (2022) |
| CFP2 | Enactment of climate finance regulations | Ahmed et al. (2021) |
| CFP3 | Better macroeconomic conditions | Bowman and Minas (2019) |
| CFP4 | Commitment from top project management | Chen et al. (2024) |
| CFP5 | Agreements to protect the climate | Griffith-Jones et al. (2020) |
| CFP6 | Changes in management policies | Kalinowski (2024) |
| CFP7 | Compliance with environmental laws | Debrah et al. (2024) |
| CFP8 | Decarbonisation measures in public projects | Akomea-Frimpong et al. (2023) |
| CFP9 | Management of stakeholder expectations | Kissinger et al. (2019) |
| CFP10 | Reasonable period of repayment | Umar and Safi (2023) |
| CFP11 | Carbon emission limits | Chen et al. (2024) |
| CFP12 | Financial incentives and subsidies | Sajid et al. (2024) |
| CFP13 | Addressing social inequalities | Volz et al. (2023) |
| CFP14 | Promotion of clean technologies | Agrawal et al. (2024) |
| CFP15 | Availability of enough climate funding | Yuan et al. (2012) |
| CFP16 | Climate investment tracking systems | Li et al. (2024) |
| CFP17 | Regular environmental assessments | Cudjoe et al. (2023) |
| CFP18 | Investment in FinTech solutions | Owusu-Manu et al. (2023) |
| CFP19 | Support from capital markets and banks | Rosenzweig et al. (2018) |
3.2 Data collection
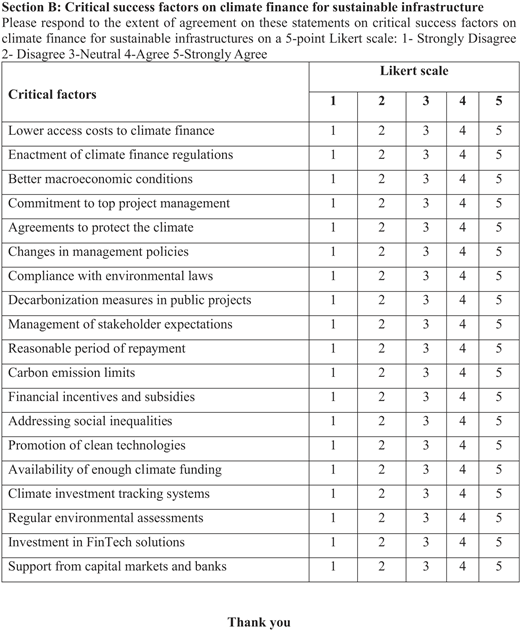
This study relies on a questionnaire instrument. The questionnaire was designed from a list of 19 CFPs (Table 1) included in the second part of the questionnaire. The first part of the questionnaire contained information of the respondents’ backgrounds with the second section on the level of agreement of respondents to the nineteen (19) CFPs in Table 1. The pilot study as mentioned in Section 3.1 supported in refining the questionnaire in terms of the structure, length, clarity, and appropriateness of the questions. An extensive industry-wide survey was conducted with experienced participants from different parts of the world. For a participant to qualify as part of the survey, the person should be (1) knowledgeable and substantially involved in projects for at least 10 years and (2) a top management member in an organization. A thorough and purposively search was conducted to identify potential participants on all the social media sites. The search yielded a total 37 potential participants. The contacted participants invited other potential respondents through the snowballing sampling approach resulting of a two hundred and eleven (211) sample. The use of purposive and snowballing techniques in this study is suitable because they enabled the sampling of specific participants who have in-depth knowledge and experiences on the application of climate finance in the construction industry (Fei et al., 2021; Kissi et al., 2020). The questionnaire was sent to 211 potential respondents via emails with multiple follow-up emails. The questionnaire contained both 5-point scale, and open-ended questions in which the respondents were asked to tick and include additional information. A consent form was included in the opening section of the online questionnaire and respondents agreed to it before filling the questionnaire. The consent form was part of the documents approved by Excelsia University College’s Ethics Committee for the data collection. The response rate of the survey was 43% comprising 91 fully completed questionnaires (see Table 2). To justify the adequacy of this response rate which is the sample size of this study, there was a comparison with previous international surveys in the construction management literature such Osei-Kyei et al. (2018) (14.5%), (Darko et al., 2017) (20%), Gunhan and Arditi (2005) (22%), and Yuan et al. (2012) (13.02%). These studies recorded lower rates of returning of the surveys making this study’s response rate of 43% better, representative and reliable compared to them.
Background description of the profile of respondents
| Details of profile | Frequency | Percent |
|---|---|---|
| 1. Job description | ||
| Chief architect | 8 | 8.79 |
| Senior project manager | 27 | 29.67 |
| Senior quantity surveyor | 11 | 12.09 |
| Director of finance | 19 | 20.88 |
| Senior risk manager | 13 | 14.29 |
| Chief project operator | 7 | 7.69 |
| Top business analyst | 6 | 6.59 |
| Total | 91 | 100.00 |
| 2. Project sector | ||
| Public sector | 38 | 41.76 |
| Private sector | 53 | 58.24 |
| Total | 91 | 100.00 |
| 3. Infrastructure projects | ||
| Transport (roads, railways, airports and seaports) | 42 | 46.15 |
| Hospital | 18 | 19.78 |
| Housing | 22 | 24.18 |
| Schools | 9 | 9.89 |
| Total | 91 | 100.00 |
| 4. Experiences (years) | ||
| >10–15 years | 14 | 15.38 |
| 16–20 years | 49 | 53.85 |
| >20 years | 28 | 30.77 |
| Total | 91 | 100.00 |
| 5. Location | ||
| Australia | 4 | 4.40 |
| Brazil | 6 | 6.59 |
| Canada | 5 | 5.49 |
| China | 9 | 9.89 |
| Germany | 3 | 3.30 |
| Ghana | 6 | 6.59 |
| Hong Kong | 4 | 4.40 |
| Vietnam | 7 | 7.69 |
| India | 10 | 10.99 |
| Kenya | 6 | 6.59 |
| Nigeria | 6 | 6.59 |
| Singapore | 3 | 3.30 |
| South Africa | 7 | 7.69 |
| South Korea | 5 | 5.49 |
| United Kingdom | 4 | 4.40 |
| United States | 6 | 6.59 |
| Total | 91 | 100.00 |
3.3 Procedures in the analysis of data
The data compiled from Section 3.2 were analysed in four steps. First, descriptive statistics were used to determine the internal consistency, normality distribution, and agreement among the respondents regarding the dataset. Cronbach’s alpha (CA) with an agreed standard of ≥0.7 in existing literature was run using the SPSS software (Maqbool and Sridhar, 2024). The CA was 0.839 which was beyond the threshold of 0.7. This is representative of the reliability of the statements (or questions) within the questionnaire, proving the internal validity and consistency of the data. Both Kolmogorov-Smirnov (KS) and Shapiro-Wilk (SW) tests were generated to determine the normality of the data (see the appendix). The results of the tests demonstrate the dataset does not follow a bell-shaped normal distribution pattern at 1% and 5% significance level. Therefore, the data meet one of the fundamental assumptions of non-parametric tests (NPTs), which are non-normal patterns in data distribution (Razali and Wah, 2011). From here on, NPT of Mann-Whitney U (MW) test was instrumental in ascertaining the level of agreement and differences between the two sectors. The last two columns of Table 3 also indicate that respondents have the same perspectives on the factors that influence climate funding in projects (Osei-Kyei and Chan, 2017). The criticality of the CFPs was established through the mean scores of the dataset which formed the second step in the analysis in Table 3. In step three, analysis of the principal factor groups was determined using exploratory factor analysis (EFA) with the principal component analysis (PCA) as the default extraction technique. The EFA was supported by the analysis of essential tests of Kaiser–Meyer–Olkin (KMO) and Bartlett’s sphericity test (Wuni et al., 2020). The final step (fourth) is the application of the fuzzy synthetic evaluation (FSE) approach. FSE is a key part of the series of fuzzy logic concepts proposed by Lofti Zadeh, which converts subjective and vague reasoning into a spectrum of objective truths (Nguyen and Macchion, 2023). FSE, a type of weighted multi-criteria method is critical in deciding the appropriate set of factors and rating scales (Zimmermann, 2011). In this study, the FSE is suitable because it has been applied to determine and rank the order of importance of the factor groups after the factor analysis. This suitability of the approach is backed by previous studies such as Gashaw and Jilcha (2022) and Kukah et al. (2023) that utilised the same FSE to assess important issues on infrastructure projects. In Section 4.3, in the processes involved in FSE are as follows:
Descriptives of the data
| Mann-whitney U test (p-value) | ||||||
|---|---|---|---|---|---|---|
| Code | CFPs | Mean | SD | Ranking | Sector | Location |
| CFP1 | Lower access costs to climate finance | 4.72 | 0.527 | 1 | 0.278 | 0.843 |
| CFP8 | Decarbonisation measures in public projects | 4.57 | 0.899 | 2 | 0.808 | 0.432 |
| CFP17 | Regular environmental assessments | 4.49 | 0.834 | 3 | 0.695 | 0.481 |
| CFP18 | Investment in FinTech solutions | 4.41 | 1.044 | 4 | 1.09 | 0.346 |
| CFP16 | Climate investment tracking systems | 4.38 | 1.01 | 5 | 1.02 | 0.942 |
| CFP4 | Commitment from top project management | 4.32 | 1.053 | 6 | 1.108 | 1.304 |
| CFP3 | Better macroeconomic conditions | 4.24 | 0.89 | 7 | 0.792 | 0.424 |
| CFP10 | Reasonable period of repayment | 4.19 | 1.102 | 8 | 1.215 | 0.743 |
| CFP13 | Addressing social inequalities | 4.05 | 0.905 | 9 | 0.819 | 1.324 |
| CFP9 | Management of stakeholder expectations | 3.93 | 1.012 | 10 | 1.024 | 1.294 |
| CFP11 | Carbon emission limits | 3.86 | 1.102 | 11 | 1.214 | 0.742 |
| CFP2 | Enactment of climate finance regulations | 3.74 | 1.212 | 12 | 1.468 | 0.512 |
| CFP7 | Compliance with environmental laws | 3.68 | 1.191 | 13 | 1.42 | 0.821 |
| CFP19 | Support from capital markets and banks | 3.56 | 1.214 | 14 | 1.474 | 0.392 |
| CFP12 | Financial incentives and subsidies | 3.47 | 1.253 | 15 | 1.57 | 0.904 |
| CFP6 | Changes in management policies | 3.31 | 1.504 | 16 | 2.263 | 0.638 |
| CFP5 | Agreements to protect the climate | 3.23 | 1.411 | 17 | 1.991 | 1.751 |
| CFP15 | Availability of enough climate funding | 3.16 | 1.436 | 18 | 2.062 | 0.821 |
| CFP14 | Promotion of clean technologies | 3.09 | 1.381 | 19 | 1.907 | 0.474 |
Calculation of the weightings of each CFPs and the principal groups
Determination of membership functions
Computation of critical indexes
4. Findings and discussions
4.1 The level of criticality of the CFPs
The central tendency for establishing critical CFPs in this study is the mean scores at 3.0 or more (Xu et al., 2010). Table 3 demonstrates the cost of borrowing (CFP1) as the most essential success factor in selecting CF to support projects. The growing decarbonization demands from governments and international bodies are a source of CFP8 which respondents rated as the second most important factor shows the results of the mean scores of the variables. The least important driver of CF in projects according to the responses is investment in clean technologies (CFP14).
4.2 Factor analysis
The extraction of key groups on the CFPs was performed using exploratory factor analysis (EFA) (Howard, 2016). In addition, the groups from the EFA form were essential in the FSE analysis in Section 4.3 (Jin et al., 2012; Umar et al., 2018). The KMO (Kaier-Meyer-Olkin) test showed 0.892, while the BTS (Bartlett sphericity test) recorded 9321.43 (Henson and Roberts, 2006). The two tests (KMO and BTS) represent the adequacy and fitness of the data for EFA model assessment (Hair, 2011). The major factor components affecting CFPs were extracted using principal component analysis (PCA) which is a default extraction function of the EFA analysis in SPSS software (Binz et al., 2013). Comparatively, the varimax rotation technique was chosen over oblique rotation because it is advantageously orthogonal and maximizes the connections between the components and every factor in the components. At the point of eigenvalue 1.0 and above on the scree plots (Figure 1), five components were identified together with a total variance of 71.160% as shown in Table 4. Tactor loadings of of the factors of 0.7 or greater were preferrable, but Malakouti et al. (2006) and De Vries et al. (2003) have argued for factor loadings of 0.4, 0.5, or more in EFA analysis. . Therefore, all factors in the EFA are relevant for further assessment into Section 4.3.
 A line graph titled Scree Plot. The vertical axis represents Eigenvalue, ranging from 0 to 12. The horizontal axis represents Component Number, ranging from 1 to 27. The graph shows a steep decline in eigenvalues from the first to the third component, followed by a more gradual decline and leveling off from the fourth component onwards.
Diagram on the screen plot. Source: Authors’ own work
A line graph titled Scree Plot. The vertical axis represents Eigenvalue, ranging from 0 to 12. The horizontal axis represents Component Number, ranging from 1 to 27. The graph shows a steep decline in eigenvalues from the first to the third component, followed by a more gradual decline and leveling off from the fourth component onwards.Diagram on the screen plot. Source: Authors’ own work
Principal components of the CFPs
| Codes | Details of CFPs | Factor loadings | Eigenvalue | % of variance explained | Cumulative % of variance explained |
|---|---|---|---|---|---|
| CFPG1 | Financial component | 5.554 | 20.570 | 20.570 | |
| CFP3 | Better macroeconomic conditions | 0.887 | |||
| CFP12 | Financial incentives and subsidies | 0.826 | |||
| CFP15 | Availability of enough climate funding | 0.780 | |||
| CFP19 | Support from capital markets and banks | 0.739 | |||
| CFP10 | Reasonable period of repayment | 0.706 | |||
| CFP1 | Lower access costs to climate finance | 0.637 | |||
| CFPG2 | Environmental component | 5.201 | 19.263 | 39.833 | |
| CFP5 | Agreements to protect the climate | 0.839 | |||
| CFP8 | Decarbonisation measures in public projects | 0.817 | |||
| CFP13 | Addressing social inequalities | 0.760 | |||
| CFP11 | Carbon emission limits | 0.682 | |||
| CFP17 | Regular environmental assessments | 0.582 | |||
| CFPG3 | Technological component | 3.823 | 14.161 | 53.994 | |
| CFP16 | Climate investment tracking systems | 0.802 | |||
| CFP18 | Investment in FinTech solutions | 0.787 | |||
| CFP14 | Promotion of clean technologies | 0.755 | |||
| CFPG4 | Organisational component | 2.745 | 11.168 | 65.162 | |
| CFP6 | Changes in management policies | 0.765 | |||
| CFP9 | Management of stakeholder expectations | 0.712 | |||
| CFP4 | Commitment from top project management | 0.703 | |||
| CFPG5 | Regulatory component | 1.619 | 5.997 | 71.160 | |
| CFP2 | Enactment of climate finance regulations | 0.766 | |||
| CFP7 | Compliance with environmental laws | 0.715 |
4.3 Fuzzy synthetic evaluation (FSE)
In this section, the goal of performing the FSE is to establish the objective indices (scores) essential for arriving at the order of relevance of CFPs. Three levels of analysis were conducted with the FSE towards the critical scores in this section after the principal groups of the CFPs are presented in Table 4.
4.3.1 Computing the weighting functions of each variable and component
Wu et al. (2017) indicated that weighting functions can be computed using several methods, such as tabulated judgement method, analytical hierarchy process, and mean method. The study argued that the mean approach to calculating weightings is simple and easy to understand in the assessment of the proportion of significance of each factor in a group. Thus, the weightings are computed and shown in Table 5 as:
Weighting of CFPs and CFPGs
| Code | CFPs | Mean | Weight per CFP | Sum means per component | Weight per CFPG |
|---|---|---|---|---|---|
| CFPG1 | Financial component | 23.340 | 0.314 | ||
| CFP3 | Better macroeconomic conditions | 4.24 | 0.182 | ||
| CFP12 | Financial incentives and subsidies | 3.47 | 0.149 | ||
| CFP15 | Availability of enough climate funding | 3.16 | 0.135 | ||
| CFP19 | Support from capital markets and banks | 3.56 | 0.153 | ||
| CFP10 | Reasonable period of repayment | 4.19 | 0.180 | ||
| CFP1 | Lower access costs to climate finance | 4.72 | 0.202 | ||
| CFPG2 | Environmental component | 20.200 | 0.272 | ||
| CFP5 | Agreements to protect the climate | 3.23 | 0.160 | ||
| CFP8 | Decarbonisation measures in public projects | 4.57 | 0.226 | ||
| CFP13 | Addressing social inequalities | 4.05 | 0.200 | ||
| CFP11 | Carbon emission limits | 3.86 | 0.191 | ||
| CFP17 | Regular environmental assessments | 4.49 | 0.222 | ||
| CFPG3 | Technological component | 11.880 | 0.160 | ||
| CFP16 | Climate investment tracking systems | 4.38 | 0.369 | ||
| CFP18 | Investment in FinTech solutions | 4.41 | 0.371 | ||
| CFP14 | Promotion of clean technologies | 3.09 | 0.260 | ||
| CFPG4 | Organisational component | 11.560 | 0.155 | ||
| CFP6 | Changes in management policies | 3.31 | 0.286 | ||
| CFP9 | Management of stakeholder expectations | 3.93 | 0.340 | ||
| CFP4 | Commitment from top project management | 4.32 | 0.374 | ||
| CFPG5 | Regulatory component | 7.420 | 0.100 | ||
| CFP2 | Enactment of climate finance regulations | 3.74 | 0.504 | ||
| CFP7 | Compliance with environmental laws | 3.68 | 0.496 | ||
| 74.400 |
The weightings in the column titled “weight per CFP” in Table 5 were computed using the following formula:
Where is the weight of a CFP, is the mean of the CFP and is the sum of the means of a component.
The application of this formula to CFP3 (better macroeconomic conditions) in component 1 (CFFG1) is calculated as follows:
The same method is applied to all the CFPs within the first component which forms the basis of the weighting functions (0.182, 0.149, 0.135, 0.153, 0.180, 0.202) as well as the other CFPs in Table 5. In addition, the weighting functions of the five groups (0.314, 0.272, 0.160, 0.155, 0.100) follow the same procedure:
4.3.2 Calculation of the membership functions
The aim of the membership functions in Table 6 was to determine the extent to which respondents attached to each of the measurement scales (alternative grades) on the CFPs when filling the questionnaires. The alternative grades are presented on a Likert scale in Section 3.2, from 1 to 5 (extremely critical to no critical). For each of the points on the Likert scale, the total responses to accord to them divided by the total number of respondents provides the member function of a CFP. This is summarised in this formula as:
Membership functions
| MF of CFPs | MF of components (CFPGs) | |||||||||||
|---|---|---|---|---|---|---|---|---|---|---|---|---|
| Code | Description of CFP and CFPG | 1 | 2 | 3 | 4 | 5 | Weights | 1 | 2 | 3 | 4 | 5 |
| CFPG1 | Financial component | 0.017 | 0.053 | 0.169 | 0.295 | 0.466 | ||||||
| CFP3 | Better macroeconomic conditions | 0.011 | 0.033 | 0.110 | 0.264 | 0.582 | 0.182 | |||||
| CFP12 | Financial incentives and subsidies | 0.033 | 0.088 | 0.264 | 0.330 | 0.286 | 0.149 | |||||
| CFP15 | Availability of enough climate funding | 0.000 | 0.022 | 0.198 | 0.396 | 0.385 | 0.135 | |||||
| CFP19 | Support from capital markets and banks | 0.000 | 0.121 | 0.253 | 0.319 | 0.308 | 0.153 | |||||
| CFP10 | Reasonable period of repayment | 0.044 | 0.044 | 0.099 | 0.187 | 0.626 | 0.180 | |||||
| CFP1 | Lower access costs to climate finance | 0.011 | 0.022 | 0.132 | 0.308 | 0.527 | 0.202 | |||||
| CFPG2 | Environmental component | 0.008 | 0.047 | 0.062 | 0.221 | 0.663 | ||||||
| CFP5 | Agreements to protect the climate | 0.033 | 0.044 | 0.088 | 0.231 | 0.604 | 0.160 | |||||
| CFP8 | Decarbonisation measures in public projects | 0.011 | 0.055 | 0.044 | 0.154 | 0.736 | 0.226 | |||||
| CFP13 | Addressing social inequalities | 0.000 | 0.055 | 0.011 | 0.220 | 0.714 | 0.200 | |||||
| CFP11 | Carbon emission limits | 0.000 | 0.088 | 0.121 | 0.231 | 0.560 | 0.191 | |||||
| CFP17 | Regular environmental assessments | 0.000 | 0.000 | 0.055 | 0.275 | 0.670 | 0.222 | |||||
| CFPG3 | Technological component | 0.031 | 0.082 | 0.122 | 0.497 | 0.269 | ||||||
| CFP16 | Climate investment tracking systems | 0.022 | 0.066 | 0.055 | 0.582 | 0.275 | 0.369 | |||||
| CFP18 | Investment in FinTech solutions | 0.022 | 0.055 | 0.121 | 0.505 | 0.297 | 0.371 | |||||
| CFP14 | Promotion of clean technologies | 0.055 | 0.143 | 0.220 | 0.363 | 0.220 | 0.260 | |||||
| CFPG4 | Organisational component | 0.044 | 0.179 | 0.164 | 0.182 | 0.431 | ||||||
| CFP6 | Changes in management policies | 0.033 | 0.187 | 0.319 | 0.132 | 0.330 | 0.286 | |||||
| CFP9 | Management of stakeholder expectations | 0.066 | 0.308 | 0.143 | 0.231 | 0.253 | 0.340 | |||||
| CFP4 | Commitment from top project management | 0.033 | 0.055 | 0.066 | 0.176 | 0.670 | 0.374 | |||||
| CFPG5 | Regulatory component | 0.000 | 0.016 | 0.203 | 0.287 | 0.494 | ||||||
| CFP2 | Enactment of climate finance regulations | 0.000 | 0.011 | 0.154 | 0.385 | 0.451 | 0.504 | |||||
| CFP7 | Compliance with environmental laws | 0.000 | 0.022 | 0.253 | 0.187 | 0.538 | 0.496 | |||||
The is the member function of CFP and are the sums of the responses on each scale point.
An example of the member function of CFP3 is therefore calculated as:
CFP3’s member function is set as (0.011, 0.033, 0.110, 0.264, 0.582) in Table 6. The same technique was used to obtain all membership functions for the other CFPs. To compute the membership functions of the components (CFPGs), as reported in Table 6, the weightings (Table 5) were multiplied by the membership functions in Table 6 creating a matrix function of:
The is the membership function of the fuzzified component matrix, is the component weighting, and is the membership function of the individual component. The calculation is performed for Group 1 (financial component):
The same calculations extend to the other four components resulting in the outcomes shown in Table 6.
4.3.3 Evaluation of the criticality indexes (scores)
The final stage of the FSE analysis is the computation of the scores to determine the criticality of the components. The formula for doing this was the combination of membership functions in Table multiplied by alternative grades.
The is the criticality score, is the membership function of a component from Table 6 and is the alternative grades derived from the Likert scale of 1–5.
The criticality scores are computed as:
4.4 Discussions
4.4.1 CFPG1- financial component
The criticality score of this component is 4.14 which is the third in the FSE. The infrastructure sector is a major economic bloc of every country, and it is heavily influenced by macroeconomic factors. A better macroeconomic condition influences the realisation of its green and social benefits. Lower inflation, lower exchange rate, interest charges and importation tariffs promote CF for green procurements and operations (Agyekum et al., 2022). Lowering the rates on these economic indicators offer financial institutions and private financiers more fiscal and monetary stability to fund sustainable infrastructure solutions. Nkoa et al. (2025) mentioned that lower rates also facilitate the reduction of transition costs towards zero-carbon emission infrastructures for economic benefits of both users and investors in the projects. In a booming economy, almost everything about green infrastructure initiatives will thrive, with higher levels of local and foreign green investments and most importantly, greater access to financial credits and loans. Green credits to construction professionals support both training of project teams and the construction of the infrastructures. These actions foster the promotion of climate financing solutions of projects in terms of financial skills to manage green infrastructures. Grafe et al. (2025) emphasized the relevance of climate finance knowledge for construction managers in urban projects. Similarly, support from the capital market and banks partly translates into the availability of sufficient climate funding which equally contributes to climate financing. Support from various multilateral financial groups such as the World Bank will enable access to finances toward sustainable construction and combat the effects of climate in infrastructures. Global institutions and the partnership of private financiers are instrumental in increasing the funding for green infrastructure initiatives in China, Saudi Arabia and many emerging economies (Tamasiga et al., 2023). Support from local financial institutions usually translates into loans and loans for repayment. Loan repayment on the other hand also influences the margin of markup on infrastructure projects which usually makes it more costly and less desirable for clients. Hence a reasonable loan repayment will largely promote CF in sustainable infrastructure management together with microinsurance coverage (Dror and Eling, 2021). Omukuti (2024) also argued that restructuring of local financial systems and policies towards inclusive and climate-friendly models could be a catalyst to increase the climate funding of sustainable infrastructures.
4.4.2 CFPG2- environmental component
This component produced the highest critical index of 4.48 in the FSE with a variance of 17.340%. These results make this component the second most important success factor for promoting climate finance in projects. These findings indicate that availability of climate finance for projects is heavily dependent on factors that address environmental issues. Increasingly, Glemarec (2023) noted that environmental responsibility has become a major determinant of securing climate funds for projects. Furthermore, climate finance is intertwined with environmental responsiveness of infrastructures to mitigate and adapt to climate change (Bracking and Leffel, 2021). Thus, there is an ongoing transition towards green infrastructure such as parks, green roofs, bioswales, and wetlands, which are funded by climate finance to provide environmental and social benefits. This revolution was driven by the recognition of the value of nature-based solutions for issues such as flooding, heat islands, pollution, biodiversity loss, and community wellbeing (Akomea-Frimpong et al., 2025a). This aligns with various global agreements such as the World Bank Group's Country Partnership Framework (CPF) for the People's Republic of China for the period FY2020-2025 (Group, [15]), the Paris Climate Agreement goals (Li et al., 2024) and the Sustainable Development Goals (SDGs) (Yang et al., 2024), to protect the climate. Strategic investments in green spaces and ecosystems are gaining support. Renewable energy sources, such as solar, wind, hydropower, and biofuels, have seen exponential growth in adoption for sustainable infrastructures. Locally, existing financial laws on construction loan contracts and project finance in many countries are changing in the last decade to address environmental components. For instance, since the passage of climate change legislation (2022) in Australia, there has been a need for mandatory disclosure of climate finance and environmental matters in project and corporate reports (Omri and Boubaker, 2024).
4.4.3 CFPG3- technological component
This component scored the fourth critical index (3.89) in the FSE, and the total variance explained 14.385%, emphasizing the significance of technological factors for promoting climate finance in projects. This component presents variables such as climate investment tracking systems, investment in fintech solutions, and the promotion of clean technologies. The importance of this component emphasizes supportive organizational structures and regulatory environments to promote climate financing of projects. This is possible with emerging smart technological tools such as climate investment tracking systems, fintech and clean technologies which support the sourcing and tracking of finance solutions on climate change in infrastructures. Ojiako et al. (2025) explained that the proliferation of generative artificial intelligence and other generative-trained transformers (GPTs) have boosted the accessing of information and tracking suitable of climate finance for infrastructures easier. These solutions are geared towards the realization of climate goals (SDG 13) for resilient infrastructures (Agrawal et al., 2024). Climate FinTech, a rapidly evolving infrastructure finance tool offers innovative financial strategies to address climate change and transition toward a low-carbon projects (Wane and Kaïré, 2023). Fintech tools also contribute to sustainable development by ensuring green finance, reducing costs, and promoting efficiency. These technologies support SDG 13 (Climate Action), through the integration of FinTech solutions, such as blockchain and AI, which enhance the assessment of climate-related financial risks. FinTech is a major catalyst for making climate finance available and transparent to project managers on digital platforms. It makes investing and tracking of climate funding solutions easier into infrastructure activities. FinTech apps also streamline collaborations among public and private financers which are accessible on mobile phones and promote crowdfunding ventures for infrastructure development.
4.4.4 CFPG4- organisational component
This component scored the lowest critical index (3.78) from Section 4.3.3, and the total variance explained 10.600%, emphasizing the significance of organizational factors in promoting climate finance in projects. This component presents variables such as changes in management policies, stakeholder expectations and commitment from top project management. The importance of this factor group emphasizes that, in addition to environmental concern, promoting climate finance for projects is also relatively reliant on the organizational dynamics present. This finding aligns with Akomea-Frimpong et al. (2025c) who emphasize that a shift in management policies towards climate participation, stakeholder engagement, and top management commitment are vital for promoting climate finance. These factors facilitate the integration of eco-conscious practices and foster a sustainable culture which is essential for successful climate-resilient projects. Furthermore, Steckel et al. (2017) argued that internal support of construction organisations for CF starts from leadership who commit to boosting the funding of projects with climate-conscious funds. It requires strong leadership who are recognise the risks associated with climate change with sustainability foresight and strategies for infrastructure projects. The design of a climate finance budget for mitigating climate risks is another determinant of sustainable development of infrastructures (Nissanka et al., 2024). Regular updates and making training modules climate friendly for construction professionals will enhance the green financing skills and change mindsets on green practices.
4.4.5 CFPG5- regulatory component
Regulations are critical to the success of everything. Without regulations, procedures, quality, and other factors are left to the intuition of whoever is, right or wrong. This grouping attained the second position with a criticality FSE score of 4.26 and an explained variance of 8.081. Debrah et al. (2022) presented significant cases on the role played by regulations regarding green financing. The paper established the importance of financial regulations and the need for them. The results agree with past studies who share the same findings that climate finance regulations must exist and must be promulgated. Passing legislation concerning climate financing will not only create awareness of the subject matter but also see that a great level of seriousness is attached to the course, translating into a wider adoption of such practices (Belianska et al., 2022). Bracking and Leffel (2021) explained that the awareness of climate finance laws should be expanded to all construction professionals not only the top hierarchy of management. Also, construction firms could facilitate the understanding and compliance of climate finance regulations with internal training and resources.
5. Conclusion
Empirically, this study assessed the major factors influencing the acceptance of climate-friendly finance in projects. The study utilized a fuzzy synthetic approach to assess the factors with underlying techniques such a Cronbach’s alpha, Mann-Whitney U test, means and factor analysis, to establish the statistical validity, robustness and groupings of the data. The findings indicated five categories of factors for CFPs in projects in areas of regulations, environmental, financial, organisational and technological factors. The results demonstrate that there is a rise in the use of climate finance models to support projects. The increasing legalisation of climate finance laws which are conscious of environmental matters account for the rise of CF models for infrastructures Also, the emergence of innovative technologies supports the identification and tracking of suitable CF for green infrastructures. Another key success factor is organisational and financial regulations which embrace climate finance to fund construction projects. A change in internal organisation and project-based policies across the globe are instrumental in advancing the adoption of CF in infrastructure project management.
5.1 Implications and limitations
The main contributions of the study include the following. First, it has remarkable implications for project policies. The policies for climate change should agree with the existing climate pledges of the infrastructure industry and national governments. his study supports legislation of regulatory policies on CF. There is a legislative gap between the two sectors of construction and finance industries in enhancing net-zero emissions agenda. This legislative lapse impedes funding and regulations on infrastructure development. According to the 2024 United Nation's Climate Change Conference Agreement (COP29), most nations do not have climate finance policies. Financial institutions provide project financing to contractors based on traditional and non-green modules so it will be great if professionals and regulators team up to formulate regulations to guide funding proposals and proceeds from the management of infrastructure projects. Globally, the results create awareness for potential changes in policies considering climate risk and finance flows under the Paris Agreement and SDG frameworks. Secondly, the study has practical implications. Practically, the information from this study will improve the understanding, access and appraisal of CF for project management. It is evident from this study that there is inadequate documentation and appraisal models of CF for green project development. This study also promotes the need for design and acquisition of financial skills for climate-friendly projects. Construction firms could utilise the findings as a resource to train or educate their professionals on climate finance. It could also serve as a checklist to develop practice modules for practitioners. Thirdly, the study has implications on the economic and social sustainability of infrastructure projects. A key ingredient to keep projects into foreseeable future is money. Therefore, adequate climate finance will support the development and operation of climate-conscious infrastructure projects. Socially, the study advocates for addressing social inequalities (CFP13) and expectations of stakeholders inclusive of societies (CFP9). Fourthly, the outcomes of this article will inform further research on this topic. These findings provide a foundation for further investigations and the concentration of studies in project specific projects. The conceptualization and theoretical frameworks underlying project financing and expansion are provided in this study to new frontiers and the global south. Additionally, the application of fuzzy method in this study addresses the theory-practice gap by transforming loosely binding opinions of participants (professionals) on the CFPs into an objective statistical analysis with outcomes for practical decision-making.
Despite these relevant contributions of this study, the following limitations should be considered and addressed in future studies. Current studies have not defined and established common theoretical explanations for CF in sustainable infrastructure projects. The definitive meaning of CF does not exist in the literature leaving the term to be interpreted differently. Certification standards for CF in green and zero emission projects are currently unavailable. Therefore, future studies should develop financial arrangement standards. Project-based studies should focus on the global south, where climate crisis from flooding, heatwaves and breakdowns are rampant and common. Additionally, the methodology including the data analysis within this article did not assess the differences and similarities of the questionnaire dataset from different countries or regions. Further studies should prioritise the assessment of the success factors (CFPs) based on the geographical location of sustainable infrastructures and other essential conditions. Furthermore, the quantity of data available for the analysis on CF is insufficient so building a broad-based database should be a priority of future research. As a result of this, readers should be cautious about generalizing the outcomes from this study as it does not include all stakeholders in the construction industry. To address this bias and low response rates on the data, future studies should increase the sample size by reaching out to many stakeholders. Moreover, future surveys should extend the data collection to workers at the lower tier of management and not concentrate only on top managers to increase the response rate. It is also suggested that both social media platforms and institutional communications should be utilised to get more people to participate in the study in future.Table A1, A2, A3 and A4
Authors are grateful to the participants in this study towards data collection. Also, thank you very much to anonymous reviewers and editors who provide comments to improve the quality of the article.
Appendix 1
Normality test with Shapiro-Wilk and Kolmogorov-Smirnov
| Kolmogorov-Smirnova | Shapiro-wilk | |||||
|---|---|---|---|---|---|---|
| Statistic | Df | Sig | Statistic | df | Sig | |
| CFP1 | 0.364 | 91 | <0.001 | 0.705 | 91 | <0.001 |
| CFP2 | 0.388 | 91 | <0.001 | 0.614 | 91 | <0.001 |
| CFP3 | 0.483 | 91 | <0.001 | 0.374 | 91 | <0.001 |
| CFP4 | 0.431 | 91 | <0.001 | 0.482 | 91 | <0.001 |
| CFP5 | 0.410 | 91 | <0.001 | 0.642 | 91 | <0.001 |
| CFP6 | 0.307 | 91 | <0.001 | 0.707 | 91 | <0.001 |
| CFP7 | 0.365 | 91 | <0.001 | 0.676 | 91 | <0.001 |
| CFP8 | 0.293 | 91 | <0.001 | 0.759 | 91 | <0.001 |
| CFP9 | 0.285 | 91 | <0.001 | 0.725 | 91 | <0.001 |
| CFP10 | 0.450 | 91 | <0.001 | 0.585 | 91 | <0.001 |
| CFP11 | 0.246 | 91 | <0.001 | 0.821 | 91 | <0.001 |
| CFP12 | 0.342 | 91 | <0.001 | 0.719 | 91 | <0.001 |
| CFP13 | 0.387 | 91 | <0.001 | 0.633 | 91 | <0.001 |
| CFP14 | 0.174 | 91 | <0.001 | 0.881 | 91 | <0.001 |
| CFP15 | 0.205 | 91 | <0.001 | 0.853 | 91 | <0.001 |
| CFP16 | 0.232 | 91 | <0.001 | 0.869 | 91 | <0.001 |
| CFP17 | 0.381 | 91 | <0.001 | 0.636 | 91 | <0.001 |
| CFP18 | 0.326 | 91 | <0.001 | 0.740 | 91 | <0.001 |
| CFP19 | 0.361 | 91 | <0.001 | 0.674 | 91 | <0.001 |
Lilliefors Significance Correction
Source(s): Authors’ own work
Appendix 2 Questionnaire
Introduction
With increased climate change disasters against infrastructure projects across the globe, there is a need to adopt climate-friendly funding solutions. Climate finance has been identified as an innovative financing model to achieve goal. In this study, the goal is to assess the key factors facilitating climate finance for sustainable infrastructure.
Consent
Your participation in this research is entirely voluntary, and your responses will be handled with utmost confidentiality. The information collected will be used solely for academic purposes. Take a few minutes (5–10 minutes) to complete this questionnaire, as your views are greatly valued in analysing the factors driving climate finance in sustainable infrastructure development.
If you agree to this statement, continue to respond to this questionnaire. Thank you for your time and cooperation.
Section A: Background profile of participants
Please what is your job title:
[ ] Architect [ ] financier [ ] Regulator [ ] Project manager.
[ ] Academic (lecturer/professor) [ ] Quantity surveyor.
[ ] Others (specify) … … … … …. …. …. …..
What infrastructure have you been significantly involved?
[ ] Transport [ ] Hospital [ ] Housing [ ] Schools.
How many years have you operated in the infrastructure sector?
[ ] 10–15 years [ ] 16–20 years [ ] More than 20 years.
Which sector is your project?
[ ] Public [ ] Private.
What is your location (country)
Appendix 3
Total variance explained
| Component | Initial eigenvalues | Extraction sums of squared loadings | Rotation sums of squared loadings | ||||||
|---|---|---|---|---|---|---|---|---|---|
| Total | % of variance | Cumulative % | Total | % of variance | Cumulative % | Total | % of variance | Cumulative % | |
| 1 | 12.077 | 44.729 | 44.729 | 12.077 | 44.729 | 44.729 | 5.554 | 20.570 | 20.570 |
| 2 | 3.344 | 12.385 | 57.115 | 3.344 | 12.385 | 57.115 | 5.201 | 19.263 | 39.833 |
| 3 | 1.371 | 5.079 | 62.194 | 1.371 | 5.079 | 62.194 | 3.823 | 14.161 | 53.994 |
| 4 | 1.113 | 4.123 | 66.317 | 1.113 | 4.123 | 66.317 | 2.745 | 11.168 | 65.162 |
| 5 | 1.037 | 3.843 | 70.160 | 1.037 | 3.843 | 70.160 | 1.619 | 5.997 | 71.160 |
| 6 | 0.899 | 3.330 | 73.490 | ||||||
| 7 | 0.758 | 2.808 | 76.298 | ||||||
| 8 | 0.681 | 2.523 | 78.821 | ||||||
| 9 | 0.597 | 2.213 | 81.034 | ||||||
| 10 | 0.546 | 2.022 | 83.056 | ||||||
| 11 | 0.509 | 1.886 | 84.941 | ||||||
| 12 | 0.457 | 1.693 | 86.635 | ||||||
| 13 | 0.405 | 1.500 | 88.135 | ||||||
| 14 | 0.356 | 1.320 | 89.454 | ||||||
| 15 | 0.339 | 1.254 | 90.709 | ||||||
| 16 | 0.327 | 1.212 | 91.920 | ||||||
| 17 | 0.316 | 1.169 | 93.089 | ||||||
| 18 | 0.283 | 1.050 | 94.139 | ||||||
| 19 | 0.272 | 1.006 | 95.145 | ||||||
Appendix 4
Rotated component matrix
| Critical factors | Component | ||||
|---|---|---|---|---|---|
| 1 | 2 | 3 | 4 | 5 | |
| CFP3 | 0.887 | 0.278 | 0.749 | 0.119 | 0.349 |
| CFP12 | 0.826 | 0.633 | 0.359 | 0.064 | 0.420 |
| CFP15 | 0.780 | 0.706 | 0.388 | 0.123 | 0.183 |
| CFP19 | 0.739 | 0.400 | 0.666 | 0.113 | 0.022 |
| CFP10 | 0.706 | 0.536 | 0.574 | 0.206 | 0.228 |
| CFP1 | 0.637 | 0.374 | 0.598 | 0.277 | 0.000 |
| CFP5 | 0.227 | 0.839 | 0.619 | 0.432 | 0.006 |
| CFP8 | 0.223 | 0.817 | 0.701 | 0.329 | 0.062 |
| CFP13 | 0.215 | 0.760 | 0.383 | 0.182 | 0.073 |
| CFP11 | 0.039 | 0.682 | 0.161 | 0.362 | 0.120 |
| CFP17 | 0.193 | 0.582 | 0.220 | 0.279 | 0.067 |
| CFP16 | 0.200 | 0.756 | 0.802 | 0.274 | 0.118 |
| CFP18 | 0.162 | 0.768 | 0.787 | 0.262 | 0.214 |
| CFP14 | 0.339 | 0.343 | 0.755 | 0.383 | 0.163 |
| CFP6 | 0.070 | 0.308 | 0.158 | 0.765 | 0.107 |
| CFP9 | 0.219 | 0.199 | 0.348 | 0.712 | 0.184 |
| CFP4 | 0.137 | 0.396 | 0.048 | 0.703 | 0.003 |
| CFP2 | 0.505 | 0.110 | 0.183 | 0.328 | 0.766 |
| CFP7 | 0.561 | 0.242 | 0.245 | 0.291 | 0.715 |

