

This paper examines how the Brazilian ready-mix concrete cartel expanded through mergers and acquisitions. Specifically, we investigate whether cartel firms strategically acquired non-aligned competitors to optimize market dominance, eliminate competition and sustain collusive behavior.
Using employment and acquisition data from 2004 to 2007, we analyze the post-acquisition activity of cartel-affiliated firms. We employ a triple difference estimator following Cunningham, Ederer, and Ma (2021) and implement the Callaway and Sant’Anna (2021) difference-in-differences (DiD) methodology to assess the impact of these acquisitions on both acquired and acquiring firms.
Our findings reveal that cartel firms target larger companies in high-demand markets and acquisitions involving overlapping operations are more likely to result in the closure of the acquiring firm rather than the acquired firm – a phenomenon we term a “reverse killer acquisition.” Conservative estimates indicate that 4.7% to 5.3% of cartel-driven acquisitions result in plant closures for the acquiring firm. These results suggest that the cartel used acquisitions as a mechanism to eliminate competition and reinforce its structure, ensuring the long-term stability of collusion.
This study contributes to the literature on anti-competitive mergers by documenting how cartels use acquisitions to consolidate market power in a downstream industry. Additionally, it extends the “killer acquisitions” framework by demonstrating a unique mechanism in which the acquiring firm, rather than the acquired firm, is shut down to strengthen cartel coordination.
1. Introduction
One of the most effective methods for cartel expansion is through mergers and acquisitions. Engaging in price wars to capture market share can be a prolonged process and often leads to a significant loss in market value. In this paper we look at the effect of Brazilian ready-mix concrete cartel firms buying non-aligned competitors. Our estimates indicate that to optimize cartel structure, firms in markets with overlapping operations shut down the acquiring firm, akin to a “reverse killer acquisition” where, instead of closing the acquired firm, the acquirer is closed. This strategy allows the cartel to eliminate competition in these markets and enhance its overall structure to achieve dominance.
The ready-mix concrete industry is closely related to the cement industry through vertical and horizontal mergers worldwide (Hortaçsu & Syverson, 2007; Syverson, 2008). In Brazil, these markets are known for the recent case of vertical cartel that operated across the cement and ready-mix concrete industry over 15 years. It is estimated that the damage caused by the cartel generated a welfare loss of R$ 28 billion [1] (CADE, 2014).
This paper empirically assesses the effects of cartel firms’ mergers and acquisitions of the non-aligned competitors in the market structure. Using the vertical and horizontal operations analyzed by the Brazilian antitrust authority, from 2004 to 2007, we verify how the cartel mergers and acquisitions by optimizing its coverage change the landscape of markets.
Our findings reveal that cartel-active firms tend to pursue acquisitions involving larger firms operating in markets with substantial potential demand. While these acquisitions have no direct impact on the discontinuation of the acquired firms, our analysis suggests that when cartel acquirers target non-aligned firms with overlapping operations, they are less likely to remain active post-acquisition. This behavior appears to be driven by a strategic intent to eliminate competition and strengthen the cartel’s structure. Conservative estimates indicate that 4.7% to 5.3% of cartel-driven acquisitions result in the closure of the acquiring firms’ plants.
Cartel behavior can be viewed as a repeated game in which cooperation is sustainable only if it is self-enforcing or incentive compatible. Long-term gains from cooperation must outweigh short-term gains from cheating. The sustainability of collusion depends on market characteristics such as the number of competitors, the degree of symmetry among them, demand growth, barriers to entry and fringe supply (Igami & Sugaya, 2021; Ivaldi, Jullien, Rey, Seabright, & Tirole, 2003; Levenstein & Suslow, 2006; Harrington, 2006).
According to the literature, the characteristics necessary for cartel sustainability are present in the Brazilian cement and ready-mix concrete industry. These include local markets with few firms, symmetry among competitors, significant demand growth (the number of plants increased 4.5 times in three decades) and substantial sunk costs that create significant barriers to entry. These factors may have contributed to the sustainability of the ready-mix concrete cartel over 15 years, despite the potentially destabilizing effects of numerous mergers and acquisitions.
The cement cartel has existed since at least 1987. Concerned about the potential entry of large concrete companies into their market, the cartel members entered the ready-mixed concrete market in 1992 in order to weaken competitors and create additional barriers to entry in the cement market. This led to the formation of the ready-mixed concrete cartel.
The cartel operated autonomously in the five regions of Brazil, maximizing profits regionally rather than nationally. To maintain stability, the cartel maintained the same market shares in the ready-mix concrete market as in the cement market, ensuring symmetry and sustainability in their agreement.
We use the a triple difference estimator following Cunningham et al. (2021) to examine the impact of these acquisitions on both the acquired and the acquirer firms. In addition, following recent developments in the difference-in-differences (DiD) methodology for staggered treatment adoption, we use the Callaway and Sant’Anna (2021) estimator.
This paper contributes to the literature in two significant ways. First, we document the entry and the process expansion of a cartel in a downstream industry. Second, it builds on the recent literature on “killer acquisitions”, which argues that incumbent firms may acquire innovative targets solely to terminate their innovation projects and preempt future competition. In contrast, this study shifts the focus from innovation discontinuation to the elimination of competitors, highlighting a unique mechanism where the shutdown does not involve the acquired firm but rather the acquiring firm itself.
2. Brazilian ready-mix concrete industry
2.1 The industry
Concrete is the second most consumed material in the world after water, essential for construction from skyscrapers to infrastructure. Its ability to be shaped and hardened makes it fundamental to modern civilization (Gagg, 2014).
The concrete and cement industries are closely linked, mainly through vertical integration. Cement, the key input for concrete, creates strong synergies. Vertically integrated ready-mix plants tend to be more productive than independent ones (Lafarge, 2005). Understanding cement is crucial for analyzing the concrete industry.
Both industries have a global history of cartel activity, with cases in Germany, Poland, South Africa, Argentina and Brazil, showing collusion is widespread (Blum, 2007; Harrington, Hüschelrath, Laitenberger, & Smuda, 2015). Market characteristics – homogeneous products, economies of scale, inelastic demand and few competitors – make them prone to collusion. In Brazil, a vertically integrated cartel controlled these industries for over 15 years, fined R$3.1 billion in 2014.
To maintain dominance, cartelized cement firms entered the ready-mix market to block large concrete producers from integrating upstream. This expansion occurred through vertical integration and acquisitions of non-aligned concrete producers. This section examines the industries and the Brazilian cartel.
2.1.1 Ready-mix concrete industry
Ready-mix concrete is a mixture of cement, sand, gravel, water and chemical additives. After an hour, the mixture hardens into a very strong material. Because concrete is very perishable, the average delivery time is about 40 minutes. High transportation costs make markets local.
The industry is characterized by high sunk costs, resulting in oligopolistic markets. Most capital expenditures are considered sunk, meaning they cannot be easily recouped. Abandoned concrete plants serve as a stark reminder of the importance of sunk costs in this industry (Collard-Wexler, 2014).
Ready-mix concrete has few substitutes, so if there are no plants near a construction site, either a mobile plant will be used to produce concrete or concrete will be mixed by hand. Market demand for concrete will be relatively inelastic, even though concrete itself is close to a commodity, creating competition between plants within a market. Given these characteristics, firms’ profits are related to the number of firms in a market (Collard-Wexler, 2013).
The Brazilian ready-mix concrete industry has a significant presence throughout the country and operates within an atomized market structure. Competition remains largely localized due to significant transportation costs. In 2018 there was over 3,000 ready-mix concrete plants, showing its widespread presence throughout the country.
2.1.2 Cement industry
As a commodity, cement is a basic raw material that is interchangeable with other products of the same type. It is traded on commodity markets where its price is determined by supply and demand dynamics, global economic trends and other market factors.
Cement production typically begins with the extraction of raw materials, primarily limestone, which is often quarried or mined from natural deposits. The mined raw materials are crushed into smaller pieces and then chemically mixed to achieve a consistent composition. This is fed into a kiln at high temperatures (typically around 1,450°C) resulting in the formation of nodular clinker. The clinker is a partially fused material resembling small marble-sized balls. The cooled clinker, along with gypsum (or other additives), is finely ground in a cement mill to produce cement powder.
Different additives produce different types of cement, the most common being Portland cement. Portland cement, which is commonly used in construction, is characterized by its gray color. It is produced by incorporating blast-furnace slag, a by-product of the steel industry, as an additive. Granulated blast-furnace slag is obtained by melting and then rapidly cooling iron slag from blast furnaces using water or steam.
Cement has high transportation costs, which limits the size of geographic markets. Therefore, cement plants are usually located near the limestone quarries. The market size is usually regional, ranging from 300 to 500 kilometers. The market has significant barriers to entry, as production requires significant initial investment in infrastructure, equipment and technology. In addition, regulatory requirements, such as environmental regulations and permits for quarrying activities, can create additional hurdles for new entrants (CADE, 2019).
The Brazilian cement industry is highly concentrated, as evidenced by the concentration ratio (CR8) of the top eight companies, which account for 85% of the national market share. Competition within the market typically occurs at the state level. Environmental regulations serve as a significant barrier to entry, with the process of obtaining operating licenses for quarries often taking up to five years (CADE, 2014). In 2018, there were 100 cement plants. Compared to ready-mix concrete markets, the number of cement plants is relatively small.
Both the Brazilian concrete and cement markets are known for ta recent cartel case. Collusion among major players in these industries has led to antitrust investigations and litigation aimed at addressing price-fixing and market allocation. These cartel activities have had a significant impact on consumers, reducing competition and potentially resulting in inflated prices for building materials. The case is known for the largest fine imposed by the Brazilian antitrust authority at the time, R$3.1 billion [2] (CADE, 2014).
2.2 Brazilian cartel
At the end of 2006, a whistleblower reported the existence of a cartel in the cement and ready-mix concrete markets between the largest players in these markets throughout the country to the antitrust authority, the former Secretariat for Economic Defense (Secretaria de Direito Econômico – SDE) [3]. An administrative proceeding [4] was opened for investigation (CADE, 2014).
After an initial confidential investigation, a search and seizure operation was conducted on February 1, 2007 against companies and high-ranking officials of potentially involved companies, trade associations and trade unions. Anticompetitive practices carried out by the cartel members were identified, including price and volume fixing in the cement and ready-mix concrete markets, customer allocation, creation of entry barriers, market allocation and asset swaps.
The cartel originated in the cement market, the earliest evidence found indicates that the cartel has been operating since 1987. The members of the cement cartel control a significant majority of the market, with their combined production accounting for 82% of Brazilian cement production.
Amidst their market dominance, the cartel members faced growing threats in the cement industry from foreign competitors, mixer companies and large ready-mix concrete firms, which posed a formidable challenge to their stronghold. In response, the cartel, operating through trade associations, launched disparagement campaigns to discredit imported cement and mixer companies. Leveraging lobbying efforts, they influenced changes in technical standards [5], effectively erecting additional barriers to entry. These tactics reduced imports and marginalized mixer firms, further solidifying the cartel’s control over the competitive landscape.
Anticipating the potential entry of ready-mixed concrete companies into the cement market, the cartel members decided to vertically extend their influence into the downstream market. Their strategy was to preemptively enter the ready-mixed concrete market to compete directly with existing firms in order to weaken the larger ready-mixed concrete firms and preempt any future entry into the cement market. Evidence uncovered by Cade indicates that this strategic decision was made in 1992. Initially, cement companies planned to enter the ready-mix concrete market through vertically integrated operations, using tax advantages and distribution cost savings as competitive advantages over non-integrated firms.
In their quest for stability within the agreement, the cartel’s objective was to mirror their market share in the ready-mixed concrete market to that in the cement market. Their goal was for the cartel companies to maintain identical market share rankings in both industries. However, achieving parity in the ready-mix concrete industry proved challenging due to its inherent market structure. Unlike the regional competition in the cement industry, the ready-mix concrete industry operates primarily at the city level, making market dominance more costly to achieve. Recognizing this, the cartel strategically pursued acquisitions of non-aligned firms in addition to its vertical integration strategy. They expected that acquisitions would result in lower overall costs than engaging in price wars to secure market share. In addition, acquisitions offered the advantage of preserving the market value of already integrated firms while accelerating the cartel’s achievement of parity with non-aligned ready-mixed concrete firms. This approach allowed the cartel to navigate the complexities of the ready-mix concrete market more efficiently, consolidate its influence and strengthen its market position without resorting to costly and destructive price competition.
Similar to the cement market, the Brazilian antitrust authority uncovered evidence of cartel activities in the ready-mix concrete sector. These activities included price and quantity fixing, market allocation and the imposition of additional entry barriers through changes in technical standards. In addition, the cartel members used price discrimination in cement purchases to undermine the profit margins of non-aligned companies and to deter potential new entrants into the ready-mix concrete market. Another practice identified by Cade was the exchange of assets between cartel members in the ready-mix concrete market, aimed at optimizing cartel operations and achieving uniform market shares in both sectors. These findings underscore the systematic efforts of the cartel to maintain its dominance and suppress competition through various coercive means.
The Brazilian antitrust authority adjudicated the case in 2014, culminating in the conviction of seven out of the eight largest companies operating in the cement sector in Brazil. These entities were found guilty of orchestrating a cartel in both the cement and concrete markets, with their collusion spanning from at least 1987 to 2007 and 1992 to 2007 in the respective markets. Additionally, three trade associations and six individuals were also implicated and convicted for their roles in facilitating cartel activities. The total fine imposed was R$ 3.1 billion, the largest fine imposed by Cade to date.
In addition to the fines, the antitrust authority imposed remedies that emphasized the need for structural changes in both markets. The cartelized companies were ordered to divest between 22% and 35% of their cement and concrete plants. They were also prohibited from making any acquisitions in either market for a period of five years. In addition, the companies were required to divest any minority stakes they held in competitors, effectively ending common ownership arrangements with rivals.
3. Data
Our dataset allows us to track the entry and exit of ready-mix concrete plants by municipality, along with the number of employees. The primary data source is the Relação Anual de Informações Sociais (RAIS) database. Our sample spans a 17-year period from 2002 to 2018, covering the last six years of the cement cartel’s existence and the subsequent years after the investigation became public. In addition, we constructed data on potential cartel allies using information from the Receita Federal do Brasil (RFB) – Brazil’s federal tax agency-and demographic data for each city from the Instituto Brasileiro de Geografia e Estatística (IBGE) – the Brazilian Institute of Geography and Statistics. We also used data from Cade on mergers and acquisitions from 2004 to 2007 involving cement companies convicted of cartel formation.
3.1 Concrete markets
The RAIS database, managed by the Brazilian Ministry of Labor, provides comprehensive firm- and worker-level data and serves as the main source of formal labor information in Brazil. With the exception of the informal sector and a subset of self-employed firms, RAIS coverage is nearly universal. This allows us to observe the number of firms and their employees in any given economic sector. Specifically, we can track the number of ready-mix concrete plants, their employees, and the number of construction workers. Confidential data also allows us to identify firms by their identification codes and zip codes. We consider each city to be an individual market because of the local competition that characterizes the ready-mix concrete industry.
We collected data on establishments in the construction sector (CNAE 41, 42, and 43) [6] or the period 2002 to 2018. Demographic data, including population and GDP per municipality from IBGE, helped us assess market size and economic significance.
Table A1 in Appendix provides a comprehensive summary of per-municipality statistics over a 17-year period for 2,801 markets. Population serves as a proxy for market size, while GDP per municipality, averaging R$1,368,064, represents financial size. The number of construction workers, averaging 682 per municipality, indicates concrete demand. On average, there are 2.57 ready-mix concrete plants per municipality, with a standard deviation of 6.36, ranging from 0 to 214 plants. The average number of employees in the ready-mix concrete sector per municipality is 36.30, with a standard deviation of 136.61, ranging from 0 to 6,210 employees.
3.2 Cartel
The administrative proceedings in the cement cartel resulted in the conviction of seven companies, the leaders of the cartel. It is well documented that several companies benefited from the existence of the cartel in the ready-mix concrete market but were not convicted. This is evidenced by the price differentiation practiced by cartel allies, including vertically integrated firms and non-integrated but cartel-aligned firms.
Using RFB data, we identified potential beneficiaries of the cartel. We first identified partners of the convicted firms and then tracked all firms in which these partners were involved, as well as their business associates. This led to the identification of additional firms potentially linked to cartel activity.
The Brazilian firm identification number, known as the Cadastro Nacional de Pessoa Jurídica (CNPJ), is a unique 14-digit number assigned to each firm branch or plant. The first 8 digits, referred to as the CNPJ root, represent the firm group and remain consistent within the same group. This structure enabled us to identify the geographic dispersion of these groups nationwide. Starting with seven firms, we identified 1,397 root CNPJ numbers.
Our findings revealed a diverse range of businesses from butcher shops to ready-mix concrete plants. Using the 1,397 CNPJ roots, we merged with RAIS data to identify ready-mix concrete plants potentially associated with cartel members. We identified 48 groups resulting in 1,375 unique plants possibly linked to cartel activities, and henceforth treated them as cartel members.
Examining the dispersion of these plants across the country reveals the industry’s growth dynamics. The cement cartel is believed to have decided to enter the ready-mix concrete market in 1992, with the first cartel plants in our dataset appearing in 1994. The cartel operated until 2007, after which there was a decline in cartel-affiliated plants, supporting the hypothesis that the cement cartel aimed to prevent concrete firms from entering the cement market. Figure A1 in Appendix shows the plants dispersion in the ready-mix concrete industry with cartel presence.
3.3 Acquisitions
We collected data on mergers and acquisitions from CADE, focusing on the period from 2004 to 2007. This time frame was chosen because it captures the majority of acquisitions during the cartel period. Before 2004, only a few acquisitions in the industry met the threshold for analysis by the Brazilian antitrust authority. Additionally, we assume the cartel was dismantled after 2007, following the search-and-seizure operation conducted by the antitrust authority. Our analysis specifically examined acquisitions between cartel members and non-aligned firms, encompassing 26 transactions that involved the acquisition of 179 plants. These acquisitions spanned 21 of Brazil’s 27 states, with a notable concentration in the Southeast region. Table A2 in Appendix shows the distribution of acquisitions by year.
Table A3 in Appendix shows that the municipalities hosting acquired firms are economically and demographically very heterogeneous. On average, they have about 1.35 million inhabitants. Municipal GDP likewise varies widely, with a mean of roughly R$52.1 million. The local construction workforce similarly spans a broad spectrum: the average municipality employs about 29,556 construction workers, yet some report zero employees while others reach 344,009. In the ready-mix concrete sector, these municipalities host on average 31.9 plants, with counts ranging from 1 to 214 and each plant support roughly 30 employees in the segment, from as little as 2 up to 1,071 workers.
Table A4 in Appendix presents summary statistics for the acquirer plants that were subsequently closed (“reverse killer acquisitions”), and a comparison with Table A4 (acquired plants) reveals a clear economic and operational scale differential between the two groups. Although the average population of municipalities hosting the closed acquirer plants is slightly higher, all other metrics indicate that these acquirer plants are generally smaller: their municipalities’ average GDP is roughly R$ 28.7 million – less than half that of the acquired plants; the average number of construction employees is 19,444 versus 29,556 and the average number of ready-mix concrete employees per plant is only 21.4 against 30.2 for acquired plants. In other words, these acquirer plants tend to operate in less economically robust municipalities and possess lower productive capacity than the firms they acquired.
4. Empirical strategy
Given the background of the cartel, mergers and acquisitions were central to the cartel’s expansion strategy in the ready-mix concrete markets. To understand the cartel’s expansion process, we will examine the impact of acquisitions on both the non-aligned acquired firms and the acquiring firms.
4.1 Determinants of acquisition
To identify the factors influencing the likelihood of a plant being acquired by the cartel, we estimate the following logit model. This model is crucial to our analysis because it helps uncover the strategic behavior underlying cartel acquisitions and sheds light on the specific characteristics that made certain plants more likely to be targeted. By estimating this logit model, we aim to better understand how acquisitions were used as a tool to reinforce the cartel’s dominance, eliminate potential competition and stabilize its operations during the cartel period. This is a key piece of the broader narrative, as it links acquisition strategies to the cartel’s overall objectives and its impact on market dynamics.
In order to identify the factors influencing the acquisition of a plant by the cartel, we estimate the following logit model.
Where, i, m and t stands for plant, municipality and year, is a dummy that indicates if the plant was acquired, is the number of employees by plants, which indicates its size, and is the population, GDP of the city that plant i is located in year t and is the number of competitor of firm i in year t. The , and are fixed effects for year and municipality. This estimation allows us to observe what variables influenced in process of acquisitions.
For this analysis, given the most cartel’s acquisitions took place between 2004 and 2007, we restrict our analysis to observations within this window – years 2004 to 2007 – to examine the factors driving plant-level acquisitions.
4.2 Dynamic event study
Each acquisition by cartel firms is treated as an event, and both acquired and acquiring firms are assigned treatment status. We use the terms pre-/post-treatment and pre-/post-acquisition interchangeably. We also have a never-treated control group. Because the acquisitions occurred between 2004 and 2007, our treatment is staggered. In this staggered treatment framework, control observations are used to construct counterfactuals for treated observations of competing firms post-acquisition. Given the heterogeneity of the firms in our sample we use propensity score matching (PSM) to turn more comparable control and treatment groups [7].
We compare acquired and acquiring firms before and after the acquisition, controlling for municipality and time fixed effects, using a two-way fixed effects (TWFE) regression.
This approach is widely used in the literature, as noted by Sun and Abraham (2021). We estimate a dynamic specification of the event study that includes dummy variables for specific periods pre- and post-acquisition. The TWFE regression with leads and lags is specified as follows.
where is an indicator for being time periods away from the initial treatment (the firm acquisition is at l = 0) and are firm and year fixed effects. The period before treatment is excluded. K and L are the most distant periods relative to the treatment included. Excluding some relative period from the dynamic specification is necessary to avoid multicollinearity among the relative period indicators or with app and quarter fixed effects. This specification allows for checking whether there are dynamic treatment effects, i.e. different treatment effects depending on the time since treatment, but also whether there are some anticipation effects.
The window of −5 is included to capture up to five years of cartel existence before acquisition, allowing us to assess any pre-treatment effects. This specification enables us to examine whether treatment effects vary dynamically over time and to identify potential anticipation effects.
Our outcome variable is that is a dummy that indicates if the firm is active in the market in year , if the firm is active it has more than two employees, the Brazilian bureaucracy may lead to years to shutdown an firm, mean while the firm remains in official recordings with the partners registered as an employees. From anecdotal evidence, to a ready-mix concrete firm to operate will be need at least three employees. The is a set of controls that includes the population, number of competitors and GDP of the city that plant is located in year .
4.3 Killer acquisition
In order to estimate if the cartel was acting through killer acquisitions I will follow Cunningham et al. (2021), henceforth CEM, and estimate the model:
Where has the same meaning as in Equation (2). is a dummy that indicates if the firm was acquired, indicates if the observation of firm-year (i,t) is after the acquisition of the firm, is a dummy that indicates if the acquirer has other firm in the same market. The are the year and municipalities fixed effects.
Our key parameter, , captures the additional change in the probability of inactivity for firms acquired when the target and acquirer overlap. The parameter measures the change in activity for all acquired firms in the years following the acquisition, while reflects the overall activity of firms acquired by overlapping buyers in the years prior to acquisition. If the phenomenon is a “killer acquisition”, we would expect to have a negative sign, indicating that in markets where firms overlap with an acquired firm, the probability of the firm remaining active after the acquisition decreases.
Evidence from the case suggests that the cartel aimed to enter the market without engaging in a price war and was concerned with preventing value destruction in the sector.
To optimize their efforts, the cartel might close the acquiring firm, since it was not strong enough to eliminate the competitors on its own, thus necessitating the acquisition. In this context, we propose an alternative approach.
Where the difference from the previous equation is the term , is a dummy that indicates if the firm acquired other firms. The hypothesis is that instead in engaging in price war the rival was bought and the discontinued firm was the acquirer.
We use panel data covering 2002–2018, but restrict our analysis to acquisitions that took place between 2004 and 2007, the peak period of cartel-related mergers. Since the cartel was uncovered in 2007, we treat that year as its endpoint. Our focus is therefore on those cartel-driven acquisitions and the subsequent strategic behavior at both acquired and acquiring plants, including episodes of “killer” and “reverse killer” acquisitions. To capture both short- and long-term effects, we adopt an event window extending five years prior to each acquisition and up to fourteen years afterward. This longer horizon is crucial in the ready-mix concrete industry – where plant closures and later reopenings are relatively straightforward – because it allows us to distinguish between temporary shutdowns and permanent exits.
4.4 Staggered treatment
Finally, we will estimate a differences-in-differences (DiD) model as a robustness check, if the results of CEM model hold using the recent literature of DiD. In our setting, treatment occurs at different points in time, i.e. firm acquisitions by the cartel in various markets take place at different times. Recent literature on DiD methods notes that coefficients from standard TWFE models may not represent a straightforward weighted average of unit-level treatment effects when treatment effects are heterogeneous. TWFE regressions make both “clean” comparisons between treated and not-yet-treated units as well as “forbidden” comparisons between units already treated. When treatment effects are heterogeneous, these “forbidden” comparisons can lead to significant issues, such as TWFE coefficients having the opposite sign of all individual-level treatment effects due to “negative weighting” problems. Even if all weights are positive, the weights chosen by TWFE regressions may not correspond to the most policy-relevant parameter (Roth, Sant’Anna, Bilinski, & Poe, 2023).
Given this context, we will use the DiD estimator following Callaway and Sant’Anna (2021), who propose solutions to estimate unbiased treatment effects in cases of multiple time periods, variation in treatment timing and when the parallel trends assumption may only hold after conditioning on observables. Their estimator allows for using not-yet-treated observations by period (i.e. ) as the control group and can be applied to a panel unbalanced in calendar time, making it well-suited for our application. Formally, the average treatment effect on the treated (ATT) can be written as follows.
Where is the data of acquisition. This equation captures the average effect of acquisition for cohort in each period after the merger occurred. is simply the name of the random variable that indicates the period (or “cohort”) in which each unit receives the treatment (i.e. the acquisition). Once more, given the heterogeneity of the firms in our sample we use PSM to turn more comparable the cohorts.
5. Results
The results in Table A5 in Appendix show the determinants of acquisitions by the cartel between 2004 and 2007, as specified in Equation (1). The analysis reveals that both the size of the firm and the GDP of the municipality have a positive impact on the likelihood of acquisition. This indicates that larger firms and those situated in more wealthy municipalities are more likely to be acquired. These findings suggest that the cartel was interested in acquiring well-established firms in significant markets with high potential demand.
The number of competitors did not yield conclusive results, showing both positive and negative significant coefficients depending on the set of fixed effects used. Municipal population only appears significant in the parsimonious models (1) and (2), and its point estimates collapse toward zero once municipality fixed effects are added – suggesting that any raw population effect largely reflects other, location-specific factors.
These results highlight the cartel’s strategy of acquiring already established firms in markets with high demand potential. It is reasonable to infer that if competition was minimal, the cartel would not need to acquire firms, as simply entering the market with cartelized firms would suffice to dominate, leveraging synergies with the cement industry.
Figure A2 in Appendix plots the dynamic impact of cartel acquisitions on target firms’ activity levels. The event-study coefficients remain statistically indistinguishable from zero for up to five years after the takeover, suggesting that nonaligned plants purchased by cartel members were neither closed nor subjected to output cuts. Likewise, there is no evidence of an anticipatory response in the pre-treatment periods, further supporting the validity of the parallel-trends assumption.
Figure A3 in Appendix plots the dynamic response of acquirer firms. The event-study estimates show a small but statistically significant decline in activity in the first year after acquisition – consistent with a modest uptick in shutdowns or output cuts among acquiring plants. In subsequent years, the coefficients revert toward zero, indicating that this contraction is both limited in magnitude and short-lived.
Table 1 presents the regression results from equation (3) comparing non-acquired, acquired non-overlapping and acquiring overlapping firms with cartel members in the same market. We include a combination of fixed effects to ensure the variation across overlapping and non-overlapping acquisitions in not driven by confounding economic and yearly effects.
CEM model – acquired firms
| Activities = 1 | (1) | (2) | (3) | (4) |
|---|---|---|---|---|
| I(Acquired) × I(Post) × I(Overlap) | −0.038 | −0.041** | −0.028 | −0.030 |
| (0.061) | (0.018) | (0.022) | (0.019) | |
| I(Acquired) × I(Post) | 0.985*** | 0.971** | 0.977*** | 0.962*** |
| (0.058) | (0.011) | (0.020) | (0.015) | |
| I(Acquired) × I(Overlap) | 0.038** | 0.039* | 0.009 | 0.010 |
| (0.019) | (0.019) | (0.023) | (0.019) | |
| I(Acquired) | −0.100*** | −0.099*** | −0.089*** | −0.088*** |
| (0.017) | (0.011) | (0.022) | (0.010) | |
| Fixed effects | ||||
| Year | X | X | ||
| Municipality | X | X | ||
| Obs. | 799,765 | 799,765 | 799,765 | 799,765 |
| t | 17 | 17 | 17 | 17 |
| i | 47,065 | 47,065 | 47,065 | 47,065 |
Note(s): ***p < 0.01; **p < 0.05; *p < 0.1. Values in parentheses are heteroskedasticity-robust standard errors, two-way clustered by municipality and year
Source(s): Table by authors
The estimates of β associated with I(Acquired)×I(Post)×I(Overlap) are not statistically significant in most of the estimates, suggesting that the hypothesis of killer acquisitions by the cartel on non-aligned acquired firms does not hold. However, the γ1 coefficient associated with I(Acquired)×I(Post) is positive and significant, implying a higher probability of activity after acquisition. The γ2 coefficient associated with I(Acquired) × I(Overlap) shows a positive impact and significance at least at the 10% level in models (1) and (2), indicating a positive effect of being acquired in overlapping markets with cartel firms. Lastly, γ3 associated with I(Acquired) shows a decrease in the probability of being active after being acquired by cartel firms.
These results suggest that cartel firms were acquiring non-aligned competitors in markets where they were already competing and keeping these firms operational. This aligns with the cartel’s strategy of avoiding market value destruction through price wars. Therefore, these acquisitions do not constitute killer acquisitions.
Table 2 presents the regression results from Equation (4), comparing non-acquirer, acquirer non-overlapping and acquirer cartel firms overlapping with acquired firms in the same market. Again, we include a combination of fixed effects to ensure that the variation across overlapping and non-overlapping mergers is not driven by confounding economic and yearly effects.
Model CEM – acquirer firms
| Activities = 1 | (1) | (2) | (3) | (4) |
|---|---|---|---|---|
| I(Acquirer) × I(Post) × I(Overlap) | −0.046 | −0.047** | −0.052*** | −0.053** |
| (0.041) | (0.021) | (0.017) | (0.023) | |
| I(Acquirer) × I(Post) | 0.973*** | 0.963** | 0.971*** | 0.961*** |
| (0.039) | (0.021) | (0.016) | (0.023) | |
| I(Acquirer) × I(Overlap) | 0.046*** | 0.046** | 0.014 | 0.014 |
| (0.015) | (0.021) | (0.018) | (0.020) | |
| I(Acquirer) | −0.088*** | −0.086*** | −0.075*** | −0.073*** |
| (0.015) | (0.020) | (0.016) | (0.022) | |
| Fixed effects | ||||
| Year | X | X | ||
| Municipality | X | X | ||
| Obs. | 799,765 | 799,765 | 799,765 | 799,765 |
| T | 17 | 17 | 17 | 17 |
| I | 47,065 | 47,065 | 47,065 | 47,065 |
Note(s): ***p < 0.01; **p < 0.05; *p < 0.1. Values in parentheses are heteroskedasticity-robust standard errors, two-way clustered by municipality and year
Source(s): Table by authors
The estimates of β associated with I(Acquirer)×I(Post)×I(Overlap) show significance in most estimates. In column 2, the estimate of β is −0.047 and statistically significant at the 5% level, meaning that acquirer firms that overlap with acquired firms are 4.7% points less likely to be active in the years after the acquisition compared to non-acquirer firms. The β estimate in column 3 is −0.052 and statistically significant at the 1% level and in column 4, it is −0.053 and statistically significant at the 5% level, meaning that acquirer firms that overlap with acquired firms are 5.2 and 5.3% points less likely to be active in the years after the acquisition compared to non-acquirer firms, respectively.
The γ1 coefficient associated with I(Acquirer) × I(Post) is positive and statistically significant at the 1% level, implying a higher probability of activity after acquisition compared to non-acquirer and non-overlapping firms. The γ2 coefficient associated with I(Acquirer) × I(Overlap) shows a positive impact and significance at least at the 5% level in columns (1) and (2), indicating a positive effect on activity in overlap markets compared to acquirer and non-overlap firms. However, this result does not show any significance in columns (3) and (4). Lastly, γ3 associated with I(Acquirer) shows a decrease in the probability of being active after being an acquirer cartel member and is statistically significant at the 1% level.
These results point to a strategy that is both economically and institutionally plausible in our setting. In a low-tech, homogeneous market like ready-mix concrete – characterized by minimal product differentiation, limited sunk investment in innovation and geographically segmented demand – cartel members can exploit idiosyncratic cost and location advantages simply by reallocating production. By acquiring a nearby non-aligned plant and shuttering their own redundant facility, they consolidate output at the more efficient site, restrict local capacity and drive up prices without writing off valuable assets. The low cost of idle capacity in this industry makes such “reverse killer” moves especially attractive: the loss from closing a plant is small relative to the collusive gains from tighter market control.
Moreover, this strategy aligns naturally with cartel incentives. Coordination among cartel partners lowers the risk of unilateral deviation – each member expects that, by mutual agreement, output cuts will be limited to redundant facilities rather than across the board – thereby sustaining higher prices and deterring entry. And by cloaking closures as post-merger efficiency rationalizations, firms can better deflect antitrust scrutiny even as they reinforce their market dominance.
This contrasts sharply with “killer acquisitions” in high-innovation sectors (Cunningham et al., 2021; Ivaldi, Petit, & Unekbas, 2023; Letina, Schmutzler, & Seibel, 2024), where incumbents buy innovators primarily to retire differentiated product lines and protect R&D rents. In ready-mix concrete, the combination of low exit costs, negligible innovation and spatially localized competition makes reverse killer acquisitions a rational and cartel-friendly mechanism for eliminating rivals.
As a robustness check, using recent literature on DiD, we find that the average effect on the activity of cartel firms after acquiring a non-aligned competitor is negative, consistent with the estimates from Equation (4) presented in Table A6. This confirms the hypothesis that after an acquisition in a market where they were competing, they shut down their own plants, eliminating potential competition.
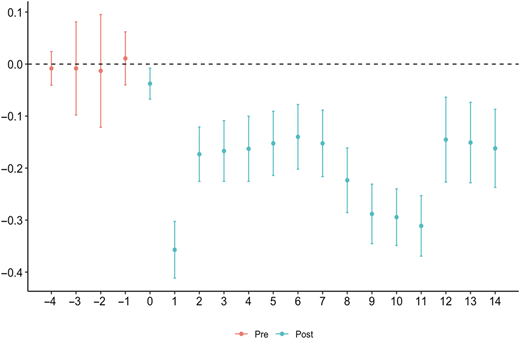
Figure 1 shows, through an event study using the estimates of equation (5) with staggered treatment, the negative effect on the activity of cartel acquirers. The event study also shows that the average effect of being inactive is irreversible over the entire sample.
6. Conclusion
In this paper, we document the expansion of the Brazilian cement cartel in the ready-mix concrete markets through acquisitions of non-aligned firms to kill competition. Empirically, we exploit the setting of firms’ activities, where we are able to track firms’ activities through the number of employees before and after acquisitions. We show that cartel firms acquire non-aligned firms with overlapping markets and the acquiring cartel member is less likely to continue in the market, in particular the cartel members acquired strong firms to achieve market dominance and discontinue its own firms.
Using data on firms’ partners, we examine the potential alignment of firms with cartel members. We also use data on employment in Brazilian ready-mix concrete firms to determine the level of activity in each plant. In addition, we examine 26 mergers and acquisitions involving 179 plants of cartel firms and non-aligned firms.
The empirical strategy adopted to investigate the effect of these acquisitions on acquired and acquirer firms relies on the model following Cunningham et al. (2021), which captures the effect on overlapping firms after the acquisition. For robustness, we also use the Callaway and Sant’Anna (2021) model, which applies the recent literature on DiD to measure the effect of these acquisitions.
Our results indicate that cartel-active firms engage in acquisitions targeting larger firms and markets with significant potential demand. These acquisitions did not result in the discontinuation of the acquired firms. Instead, we observed a negative impact on the operations of the acquiring firms post-acquisition. Acquiring firms tend to close down in markets where there is an overlap with the acquired firms, effectively eliminating competition in these areas, a process we called reverse killer acquisition. These findings are robust under the recent DiD methodology.
Finally, our results suggest that antitrust policy should closely scrutinize the growth in the number of acquisitions in industries prone to collusion and its effects in closing firms, acquired and acquirer. The fact that a cartel seeks to expand its operations killing competition with the Brazilian antitrust authority, should exacerbate the concern with these operations.
The authors gratefully acknowledge the financial support provided by CAPES (Coordination for the Improvement of Higher Education Personnel), including support from the CAPES-PrInt Program. We are also thankful for the insightful comments and suggestions from the editors and anonymous referees, which significantly improved the quality of the paper. We thank participants of the 52nd Brazilian Economic Meeting for their valuable feedback. We are especially grateful to Ilan Brik for his excellent research assistance.
Notes
Approximately US$ 12.65 billion in 2014.
Approximately US$1.4 billion in 2014.
The former Antitrust Authority was composed of three separate entities: the Secretariat for Economic Defense (SDE), which was responsible for investigating alleged violations; the Secretariat for Economic Enforcement (Seae), which issued non-binding economic opinions; and the Administrative Council for Economic Defense (Cade), which was responsible for issuing final decisions. With the enactment of Law No. 12,529/2011 in May 2012, all investigative, analytical and adjudicative functions were consolidated under Cade.
Administrative Proceeding No. 08012.011142/2006-79.
Brazilian Association of Technical Standards – Associação Brasileira de Normas Técnicas (ABNT)
CNAE – National Code of Economic Activity, equivalent to the North American Industry Classification System (NAICS).
The propensity score was estimated via a logit model including only pre-treatment covariates (). After obtaining those scores, we performed 1:1 nearest-neighbor matching with a caliper of 0.2 to limit the maximum allowable distance between scores. The matched sample thus pairs each treated unit () with a non-acquired control having a similar propensity score.
This article is part of the special issue Selecta 2024, featuring the best papers from the 52nd Brazilian Economic Meeting. It was nominated by the conference’s scientific committee. Following an invitation to submit, the paper underwent a condensed review process, with a single referee recommending minor revisions.
References
The supplementary material for this article can be found online.
