This study aims to enrich the current theoretical debate on the growth of start-up firms by extensively investigating the ongoing empirical studies in this research stream. Moreover, this study identifies drivers whose support roles are confirmed in the literature and recommends further research opportunities.
In this study, we analysed the results of 316 empirical studies on start-up firms and growth and also identified and categorised 66 growth drivers. We presented these drivers in three-dimensional charts: 1) the frequency of using each driver in the 316 studies, 2) the consistency of each driver as measured by the number of studies supporting its statistical significance and 3) the net effect (positive or negative) of each driver on growth.
Our analysis compares extant studies on growth drivers and shows some under-explored growth factors of start-up firms.
Both start-up managers and policymakers can benefit from this study. This study provided managers with a fine-grained tool on the main growth drivers and can guide policymakers in supporting policies for start-up firms.
This study provides a rich, fine-grained and coherent picture of several potential growth drivers of start-up firms. Moreover, we extended our analysis to various potential drivers more than previous studies on this topic, thereby providing fruitful insights into the critical growth factors for start-up firms.
Introduction
What drives the growth of start-up firms? This is a question that many entrepreneurs, venture capitalists, scholars and policymakers would like to answer. It has intrigued managerial researchers since the late 1970s (Cooper and Bruno, 1977), but the debate on firms' growth process—of any size—arose even earlier (Penrose, 1959; Chandler, 1962; Greiner, 1972; Lewis and Churchill, 1983). In recent decades, theoretical and empirical studies on this subject have proliferated (Coad et al., 2014; Pugliese et al., 2016; Pearce and Pearce, 2020). Over time, studies have become more specialised; scholars devoting increased attention to the roles played by selective drivers (e.g. resources, strategies, behaviours, mental attitudes, location advantages and industry dynamisms) in supporting the growth of start-up firms (McKelvie et al., 2017; Mason and Brown, 2013; Colombo and Grilli, 2005; Zimmerman and Zeitz, 2002; Eisenhardt and Schoonhoven, 1990). This debate, like a river, has dispersed into a delta of hundreds of small rivulets.
This study aims to map delta rivulet by rivulet. Specifically, we aim to provide scholars with an original standpoint from which to observe the state-of-the-art of empirical studies on the growth of start-up firms. Particularly, we considered the roles played by different groups of variables (here called “growth drivers”) across numerous empirical studies, both qualitative and quantitative.
We adopted an unusual analytical approach for the managerial disciplines. First, we conducted a systematic literature review. Second, we extended the quantitative analysis on these drivers. This method lies between a systematic literature review and a meta-analysis. Mixed methods are more popular in medical studies (Grant and Booth, 2009; Ragin and Taioli, 2008); however, they can also be used in the social sciences.
Although our study has the same rigour as a traditional literature review, it differs because we directly considered the single variables (the so-called growth drivers) in each study independently from the theoretical perspectives and frameworks adopted by the authors. Our study is also different from a meta-analysis, which severely restricts the number of studies considered (Song et al., 2008), because they all must investigate the same population and use the same definitions for the input and output variables (Geyskens et al., 2009). Consequently, such a method is best applied to narrow-scope studies, such as testing the validity of a specific treatment or drug based on all the available empirical evidence. These restrictions oppose our aim of investigating several growth drivers of start-up firms, as they have been discussed and tested—especially in several empirical literature.
To achieve our aim, we combined the information retrieved from the 316 carefully selected empirical studies and identified a typology of 66 growth drivers. After sorting and classifying these drivers, we visualised them in a three-dimensional matrix that integrates information on 1) the frequency of using each driver in the existing empirical studies, 2) the net impact (positive or negative) of each driver on the growth of start-up firms and 3) the consistency of each driver as measured by the number of studies supporting its statistical significance. Finally, we advance our reflections on the evolution of the empirical literature on this topic and propose several suggestions for future studies.
Data and methodology
First, we systematically selected previous empirical studies on the topic of interest (Crossan and Apaydin, 2010; Pickering and Byrne, 2013) following a rigorous multistep process. Subsequently, we identified all the entries on the Web of Science (WoS) (©Thomson Reuters), including one of the following terms: start-up, new venture, new business, new firm, new organisation, entrepreneurial venture and young firm used with grow(th), success, performance, survival or failure. We believe that WoS is suitable for three main reasons. First, WoS is recognised as among the most complete databases in business management field. Especially, it is highly adopted in systematic literature reviews and bibliometric research due to its extensive coverage of academic journals (González-Torres et al., 2020). Second, WoS is characterised by standard formats and “requires less or no data-cleaning operations” (Di Vaio et al., 2020, p. 286) than databases of similar size, still guaranteeing accuracy in search queries. Third, WoS is also known to apply rigorous selection criteria to the articles it contains, and we argued that it enhances the reliability of our results regarding such quality controls. Hence, we obtained 2,507 entries from the first round of searches.
We then exported all the bibliographic data and narrow the sample. The authors read all the abstracts and decided whether to include the articles in the subsequent steps based on the following criteria:
The research is empirical (either quantitative or qualitative).
The research is about start-ups (and synonyms) and not established firms.
The research is strictly connected to the theme of start-ups' growth.
The research considers the dimensional growth of start-up firms. Accordingly, we excluded studies considering only the process of a firm's international growth, a term frequently used to describe the process of the firm's international expansion, since it characterises more advanced stages in the life cycle of start-up firms (Passaro et al., 2020).
At the end of this phase, the sample was narrowed to 618 articles. Subsequently, we carefully excluded articles tackling only survival-and non-growth-related performance (e.g. financial performance, instant profitability). After this step, we reached 353 articles. Finally, we excluded non-empirical articles (37). Table 1 presents the descriptive statistics for the 316 remaining articles considered in this study [1].
In the next phase, we coded all the dependent and independent variables used in the 316 articles. To increase the reliability of the literature review process, when possible, each of us independently acted as a reviewer and positioned each article (and categorised its variables) according to the outlined selection criteria. Measures were considered to assess the inter-rater reliability. Subsequently, we compared our results. Our choices were convergent in the majority of the cases, and we argued that it indicates robustness in our classification. However, when some degree of divergence was identified in the application of classification criteria, we discussed until agreement was reached. Overall, the classification manifests high levels of convergence among us. Specifically, we performed the following procedure:
All the studies were sorted chronologically using the publication date.
We categorised all the types of independent, dependent and control variables used in each study, starting with the oldest studies. New types are introduced if and only if no previously used variable is considered semantically equivalent.
For each independent and control variable, we recorded the effect (positive/negative, significant/not significant) exerted on the dependent variable. For quantitative and regression-based studies, we used a significance threshold of 5% to distinguish between significant and non-significant drivers. We did not consider drivers regarded to be significant in the studies using a higher threshold (typically at least 10%) as statistically significant. For qualitative studies, we considered drivers significant when the study authors specifically mention that a variable is an important driver in the results, discussion or conclusions and provide solid justification to their claims. When such conditions are not met, we simply conclude that a growth driver cannot be determined.
After completing the first round of coding, we re-analysed all the coded variables to further merge or divide the drivers. At the end of the process, six dependent variables and 70 independent variables (drivers) were coded. To limit potential mistakes made by the three coders, a second review of all the studies was conducted. In this phase, the coders focused only on the drivers' definition. Some drivers were split, and others were merged. After the discussion, five dependent variables and 66 drivers were identified.
To facilitate the visualisation and interpretation of the results, we grouped the 66 growth drivers into six categories:
Individual-and team-related drivers include variables referring to the personal attitudes, skills and attributes of the founding entrepreneur(s), such as aspirations, attitudes and experience. To create this category, we relied on the well-and long-established literature on the individual traits of start-ups' founders and their influence on firm performance (Zahra and Covin, 1993; Mullins, 1996; Bhide, 2000; Wiklund and Shepherd, 2005; Nuscheler et al., 2019; de Mol et al., 2020). We included in this category variables such as founders' entrepreneurial orientation, previous industry experience and social and professional networks (Table 2).
Marketing-and strategy-related drivers include drivers related to firm decisions with strategic relevance (e.g. differentiation, low-cost strategies or diversification strategies, the process of business modelling) and marketing-related drivers (e.g. marketing planning and intensity), except for marketing resources and capabilities, which are in another group. We based this category on traditional studies on the effects of high-level business decisions on the performance of start-up firms (Siegel et al., 1993; Bloodgood et al., 1996; Peters and Brush, 1996; Zahra and Bogner, 2000; Kaplan et al., 2009; Chatterji et al., 2019; Cacciolatti et al., 2020).
Context-related drivers include variables related to the role of institutional factors (e.g. norms, culture, infrastructure) and other supportive or hindering factors related to the characteristics of the start-up's surrounding environment (e.g. the innovation ecosystem, industrial clusters and supporting policies) (Aghion et al., 2007; Raz and Gloor, 2007; Fisman and Svensson, 2007; Gilsing et al., 2010; Solano et al., 2020; Wang and Zhou, 2020). Examples include effective financial and labour regulations, taxation policies and other forms of public support.
Industry-and market-related drivers include drivers related to the effects of the market dynamics and industry structure (Porter, 1985; Davidsson, 1989a, b; Stevenson and Jarrillo-Mossi, 1986). The firm cannot directly control these two factors, so studies using such variables often assume that certain dynamics and structures offer better or worse conditions for the establishment and growth of new firms (Audretsch, 1995; Cooper et al., 1994; Vivarelli and Audretsch, 1998). Examples of such drivers include competition intensity, industry complexity, market attractiveness and industry growth rate.
Firm-level resources and capabilities include specific assets and skills that start-up firms possess or can access, which trigger and support their growth processes (Heirman and Clarysse, 2004; McDougall et al., 1994; Zahra and Bogner, 2000; Lee et al., 2001; Zahra et al., 2003). Examples include firms' technological and financial resources, marketing and networking capabilities.
Past performance includes variables related to pre-existing dynamics (e.g. growth path, profitability and success) that are believed to pave the way for further firm's growth (Lotti et al., 2001, 2003; Franck et al., 2010; Yildirim, 2011; Sirec and Mocnik, 2014; Lawless, 2014; Sarada and Tocoian, 2019). Examples of these growth drivers found in the sample include a firm's size, (previous) profitability and indebtedness.
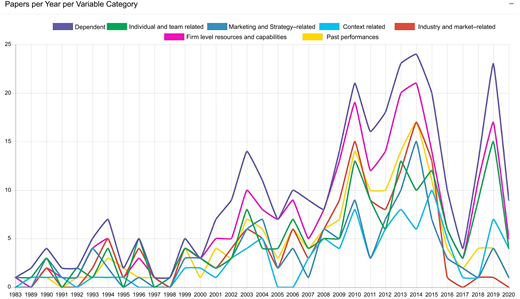
Table 2 shows the growth drivers identified in this study, which are grouped by category. It also includes variable names and descriptions. Figure 1 displays the temporal development of the studies conducted within each cluster. Clearly, the topic of start-up growth has been growing considerably from the early 1980s to 2015, showing higher volatility and a slight decline. It is difficult to say whether this decline is temporary or systematic. Another aspect worth commenting on is the relative increase of studies privileging individual and team-related variables at the expense of studies dealing with the role of contextual variables and also with marketing and strategy-related drivers.
We measured the dependent variable (growth) in five main ways (also used in combination):
Generic growth (D1): The use of categorical variables, such as high/low growth, gazelle/non-gazelle firms and Likert-type scales. 13% of the papers used these measures.
Profit-related measures (D2): profits, gross profits, operating profits, profit margins and value-added growth were used in 16% of the papers.
Sales-related measures (D3): Absolute and relative term sales growth, revenue trends, turnover and gross revenues were used in 54% of the papers.
Size-related measures (D4): Employees' growth in percentage, logarithmic reduction of dimensional growth and year-by-year employees' growth were in 49% of the papers.
Other growth dimension measures (D5): Market share, company value, assets, number of new products and scalability of the business were used in 12% of the papers.
In this study, we considered only organic types of growth, which excludes mergers and acquisitions from the scope of this study.
Results
We first associate each of the 66 growth drivers with three indicators:
The frequency of each driver (F), or how many times a driver is used in the 316 empirical studies considered.
The consistency of each driver (D*), or how many times a driver is found to be significantly related (p = 0.05) to growth, regardless of the sign (positive or negative).
The net effect of each driver (marked with D = ), or the effect (positive or negative) on growth exerted by each driver. Algebraically, we determined the value of D= by subtracting the value of D− (how many times each variable related to a driver is found to be negatively linked to growth) from D+ (how many times each variable related to the same driver is found to be positively linked to growth). Thus, the value of D = is positive when positive references outnumber negative ones, and vice versa.
This study, based on a net effect approach, does not consider the effect on growth from configurations of variables (Fiss, 2011). Therefore, only direct relationships were considered, while moderating and mediating relationships were not.
To compute the three indicators, we, for each paper, weigh the values of F, D*, D+, D−, and D= for the study sample size and the average annual number of citations received (citation velocity). This calculation provides more importance to drivers tested in studies with larger samples and more citations from the academic community.
The weighting procedure is as follows. For sample size, we first divided the 316 papers by the research method used (quantitative, qualitative and mixed-methods research), creating three sub-groups. Within each sub-group, we sorted the papers by sample size. Second, we determined a threshold value corresponding to the sample size of the papers in the third quartile (75% of the distribution). Third, we set the weighting value for all the papers belonging to the upper 25% of the distribution to 1 and proportionally scale (=sample size/threshold value) all the indicators (F, D*, D+, D− and D= ) in the remaining papers (75%). We used the term wss(p)—where p represents the specific paper—to indicate this procedure.
For citation velocity, we weigh each variable for the citation velocity of the top-cited papers in the database without creating any sub-groups. We used the term wcv(p) to indicate this procedure.
In formal terms, for i representing each driver of growth, the indicators Fi, Di+ and Di−represent the set of papers where i is used and found to be significantly, positively or negatively linked to growth are obtained as follows:
Subsequently, we labelled each growth driver (1) supported, (2) potential, (3) problematic and (4) weak. To achieve this, we built a 2 × 2 × 2 matrix containing information on each driver's relative frequency (high/low), consistency (high/low) and net effect (high/low). To distinguish between high and low, we used the median of each distribution, expressed as follows:
Supported drivers rank high in all three dimensions (frequency, consistency and net effect).
Potential drivers rank high in net effect, low in consistency and either high or low in frequency.
Problematic drivers rank low in net effect, high in consistency and either high or low in frequency.
Weak drivers rank high in frequency and low in consistency and net effect.
We also considered two in-between situations: weak/problematic drivers ranked low in all three dimensions and potential/supported drivers ranked high in consistency and net effect but low in frequency (Table 3).
For each variable considered in the study, Table 4 reports its category, full name, unique identification code comprising a letter and a number, F, D+, D−, D= and D* values already weighted for wss and wcv, and finally, the classification label (weak, problematic, potential and supported).
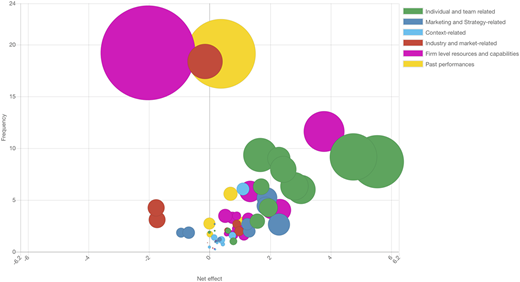
We then visualise all the growth drivers in a bubble chart (Figure 2), which combines information from three dimensions:
The (weighted) frequency (F) in the Y-axis.
The (weighted) net effect (D= ) in the X-axis.
The (weighted) consistency (D*) is represented by the bubble size or Z-axis.
The chart is read as follows: the higher the position of a bubble in the chart, the more times the driver is used in the literature. The horizontal position of a bubble indicates the overall net effect of the driver on the growth of start-up firms. Variables on the right have a positive net effect, while variables on the left have a negative net effect. The closer the side of a bubble, the stronger the net effect exerted by the driver on growth.
Finally, the larger the bubble, the higher the consistency of the driver. This information has limited value, but it complements the information provided by the other axes. The z value should be interpreted alongside the information provided by the horizontal (X) and vertical (Y) positions of each bubble. To simplify the visualisation of the bubbles, we used different colours corresponding to the six categories introduced earlier.
In the ideal path of evolution, a growth driver starts as a small bubble in the bottom-centre of the matrix, as its frequency, consistency and net effect are initially close to 0. As new studies consider the same or a similar variable, the bubble starts to move towards the top-right or top-left corner of the matrix (depending on whether the net effect is positive or negative) and increases in size as consistency increases. Ideally, the (absolute value of the) net effect and consistency coincide, or at least the first is close to the second. In that situation, there is no ambiguity about the type of support (positive or negative) provided by a driver for start-up firm growth.
In some cases, new studies might not provide statistical support for the driver's significance. The bubble will then remain small in size. Also, new studies can offer conflicting evidence about the positive or negative effects of a specific driver. The bubble will then move towards the top-centre of the matrix, and the distance between the net effect and consistency values will increase.
To provide a clearer perspective on the development path of each variable, we drafted six charts, one for every category considered in this study. Thus, Figure 3 refers only to individual-and team-related drivers, Figure 4 to marketing- and strategy-related drivers, Figure 5 to context-related drivers, Figure 6 to industry- and market-related drivers, Figure 7 to firm-level resources and capabilities and Figure 8 to past performance.
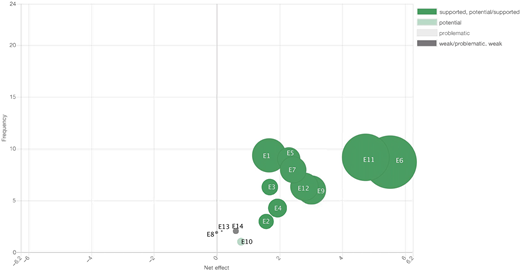
Figure 3 shows that many individual-and team-related drivers considered obtained ample support in previous empirical studies. We classify as supported drivers the personal characteristics of the entrepreneur (E1); the social and professional network of the entrepreneur (E2); previous entrepreneurial experience of the founder (E3); entrepreneurial orientation (E4), education (E5), industry experience (E6), managerial expertise (E7), vision, and motivation (E9), and growth attitude of the entrepreneur (E12); and the size, composition, and heterogeneity of the entrepreneurial team (E11). The research and development (R&D) expertise of the founder (E10) is classified as a potential growth driver mainly due to the low frequency of supporting studies. Despite encouraging evidence, additional support is required to establish whether such a driver (and the related variables) plays a real supportive role.
A weak effect on growth is associated with other variables, including the role of the founder(s) as manager(s) of the company (E14) and the financial and control expertise (E13) of the founder(s). In both cases, more evidence and methodologically stronger studies are required. The evidence for driver marketing expertise (E8) is even weaker: none of the studies in which it was considered proved to be significant.
The role of age, gender and other personal characteristics (E1) is supported, but requires clarification. This driver includes several personal characteristics (the owner's background, age, gender, marital status, nationality and ethnicity), which can act as growth drivers in very different ways. Thus, some caution should be applied when interpreting the total net effect of this driver. We can say that personal characteristics have been extensively studied and, when tested empirically, have been shown to influence the growth chances of start-up firms.
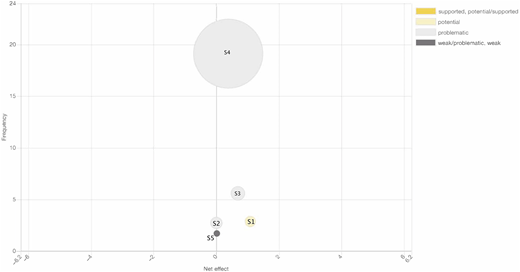
Regarding marketing-and strategy-related drivers, Figure 4 highlights the existence of a clearly weak growth driver: growth mode and strategy (M11). Despite a considerable number of studies investigating this driver (19), only a minority of them found the variable to be significantly (positively) related to growth.
Driver marketing planning and intensity (M8) is labelled as potential/supported, due to good levels of consistency, but a relatively low number of studies on such driver. Despite promising levels of consistency and clear net effects, their supportive role requires further investigation. Business planning (M2), diversification (M4), low-cost (M6) and other generic (M7) are labelled as weak/problematic drivers. They lack consistency and have unclear net effects. Focus and niche strategies (M10) are labelled as problematic drivers. Finally, the positions of business model (M1), differentiation strategies (M3), internationalisation (M5) and innovation strategies (M9) in the chart suggested that they played strong supportive roles.
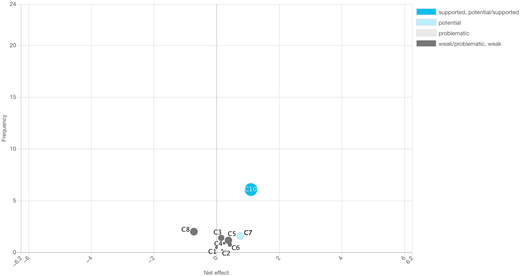
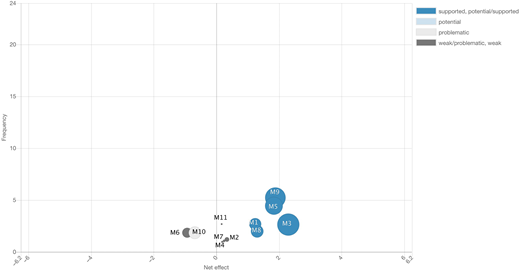
The category of context-related drivers needs special attention. These drivers, with two exceptions, fall into the category of weak/problematic growth drivers. Figure 5 shows that the majority of bubbles occupy the central positions. Analysing more deeply, we can distinguish a first sub-group of drivers characterised by limited frequency and a positive net effect. The sub-group includes drivers C2 (closeness to), science parks and universities (C1). Such drivers could be removed from the problematic category if provided with enough empirical support. A second sub-group of variables is characterised by a higher frequency but unclear net effect. This sub-group includes government financial support (C3), non-government financial support (C5) and taxation (C9). Contrastingly, the drivers, industrial districts and clusters (C4) and business incubators (C6) seem to lack consistency at this time. The negative role played by the legal and normative systems (C8) is more supported (although the driver remains in the weak/problematic category). The financial system (C7) represents a potential growth driver, while the positive role of location (C10) is fully supported.
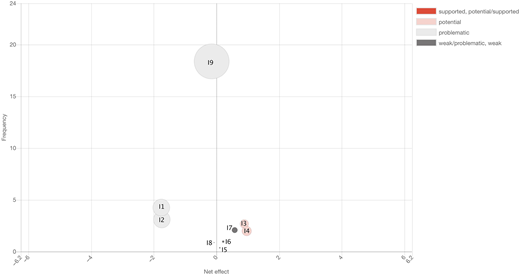
Regarding industry-and market-related drivers (Figure 6), we can identify a first group of weak/problematic drivers: the driver product/market maturity (I5), economies of scale in industry (I6), the driver industry growth rate (I7) and industry complexity (I8). These drivers have all been studied, but are characterised by a general lack of consistency. The driver economies of scale in industry (I6) are especially controversial because the presence of economies of scale in an industry is thought to act as an entry barrier, not a growth driver, for start-up firms (Porter, 1985).
Next, we have negative drivers whose role as obstacles to start-up firms' growth has received adequate confirmation in the literature. These variables are competition intensity (I1: problematic) and environmental dynamism (I2: problematic for a lack regarding consistency). Market attractiveness (I3) and market complexity and heterogeneity (I4) have been identified as potential drivers.
The role of industry type (I9) remains somewhat controversial. The driver has been labelled problematic because it has high frequency (Y axis) but low levels of consistency. The net effect is less informative due to the variable's lower internal homogeneity. Possible explanations include the frequent use of industry type (e.g. manufacturing/services, high-tech/low-tech industries) as a control variable in empirical models. We interpret the bubble's position in the matrix to reflect the fact that scholars often seek to establish the neutrality of this driver (industry effect) to reinforce the role placed by their independent variables (other drivers).
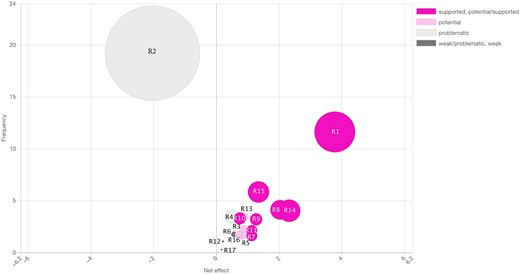
Resources and capabilities are among the most studied growth drivers (Figure 7). In this figure, we can observe the first group of weak/problematic drivers: Intellectual Property Rights (IPR) owned (R6), marketing capabilities (R7), supply chain (R12) and e-commerce and Information and Communication Technologies (ICT) (R17). These drivers have low frequency and weak consistency, but clear net effect. Surprisingly, we found that the drivers' legitimacy (R3), learning and innovation capabilities (R5), technological capabilities (R13) and customers and customer relations (R16) were weakly related to growth due to their high frequency but limited consistency and modest net effect.
Next, we observed a broad group of supported growth drivers: the financial resources and capabilities of the firm (R1), networking capabilities (R8), organisational structure and capabilities (R9), alliances (R10), venture capital support (R14) and human resources and capabilities (R15). Firm type (R4) has contrasting evidence and represents a problematic driver.
Firm age (R2) is somewhat controversial. Used in more than 100 studies, it is reported to be significant in approximately 50% of the studies and has a positive net effect in 66% of the times. Finally, we labelled R&D investment (R11) a potential/supported driver, but it is clear that the (positive) net effect and high consistency make it a quasi-supported driver.
Figure 8 shows the drivers related to the (relatively) past performance of start-up firms. Generally, all the drivers in this category need some considerations. While generic past growth seems to be a potential predictor for future growth, the majority of bubbles in Figure 7 display unusual vertical development, reflecting the debate on their net effect in the literature.
Discussion and Conclusion
Discussion
The analysis prompted three main stimuli for reflection. First is the direction of the development of studies over the years. As stated, while the frequency of studies deepening the role of new potential drivers increases, bubbles ideally should move from a bottom-centre position towards the top-right or top-left corner of the graph, while also increasing in size (consistency). Thus, on the graph, we should expect to see bubbles comprising two symmetrical opposite diagonals with a common origin, but this picture has not been developed.
We observe that the left sides of Figures 3 and 4 are almost empty, likely indicating the so-called publication bias in the literature (Easterbrook et al., 1991): researchers conventionally seek empirical confirmation of positively inflected research hypotheses (what boosts the growth of start-up firms) rather than the negatively inflected (what hinders the growth of start-up firms). Consequently, we almost completely lack evidence regarding the factors (or non-drivers) that inhibit start-ups from growing. From an academic perspective, this gap points to new research opportunities for future studies, but from a managerial perspective, this gap is highly serious. The literature fails to provide entrepreneurs and managers with useful knowledge about the mistakes to avoid while guiding their firms towards avenues of growth.
A second point for discussion is the comparative behaviour of the six categories of drivers considered in this study. If the majority of variables in some categories follow an ideal path of development (from the bottom-centre of the chart to top-right or top-left), others are characterised by drivers undergoing more controversial development. We refer, particularly, to past performance and context-, industry- and market-related drivers, which, instead of developing diagonally, tend to remain in a central limbo and eventually develop vertically, lacking consistency and achieving unclear net effects. We found some drivers' categories (and drivers themselves) that received solid empirical support over time and that could be considered as “reliable [2]” drivers of start-ups' growth. We referred, particularly, to (1) specific individual characteristics of entrepreneurs, such as having previous entrepreneurial and industry experience, proper education and managerial expertise, a good personal network of contacts, a clear vision and a growth attitude. We referred also to (2) some specific general and marketing strategies, such as a “classical” differentiation strategy (à la Porter), but also a clear innovation and internationalisation strategy. But we also referred to (3) a wide set of resources and capabilities that includes organisational, HR, financial and networking capabilities, with these last used to connect to key external resources as venture capital firms.
Beyond the three categories, we also found that single variables included in other clusters played a pivotal role for start-ups in their growth processes. Particularly, location still matters in supporting the growth of start-ups, but an incorrect location expressed regarding excessive competition intensity and environmental dynamisms could threaten the growth expectations of newly founded firms.
This brings us to the third point of discussion: we want to raise deals with certain specific drivers. Particularly, we find a surprising lack of empirical evidence related to strategic drivers. We have insufficient knowledge about the effects that diversification, low cost, differentiation, focus and other generic strategies have on the growth paths of start-up firms. Also, researchers can further explore this area regarding the emerging paradigm of strategic agility. Furthermore, the behaviour shown by driver M1 (business model) deserves additional attention. Business models are among the fastest-growing topics in the literature on start-up firms (Baden-Fuller and Mangematin, 2013). Overall, this body of studies has provided a considerable investigation, but has failed to provide clear and consistent evidence of the effect that business modelling has on the growth of start-up firms. We urge more empirical studies to investigate whether and under which circumstances business models make a difference.
Another group of variables for which more evidence is clearly needed is financial support to start-ups. The analysis does not identify clear effects from financial support, whether from public institutions (C3) or private bodies, such as venture capitalists (C5). The lack is intriguing because the literature on small firms (whether start-ups or not) has traditionally argued that the lack of financial resources is among the biggest liabilities of start-ups. Contrastingly, the analysis does not support the view that more financial resources correspond to more growth opportunities for new firms. Apparently, drivers other than money count. Even on this topic, more empirical investigation will be needed in the future.
The substantial uniformity in the roles played by resources and capabilities in driving start-ups to grow is surprising. In practice, this study suggests that internal conditions, such as the assets and skills of the start-up firm (more than the skills because a start-up, by definition, lacks assets), make more of a difference than environmental or contextual conditions. This suggestion is reinforced by the fact that, among contextual drivers, only location (C10) really matters in driving the growth of start-up firms. However, this is not in line with some literature on National and Regional Innovation Systems (NIS and RIS) that has deeply discussed and empirically supported the positive role played by the context for the thriving of start-ups. Hence, more studies are needed in this direction.
Also, the behaviour of the age variable (R2), which controversially acts as a negative and positive growth driver, deserves further consideration. Most start-ups are built on easy assets, such as ideas, time, passion and perseverance, which are sufficient to allow the firm to reach the market and boost the growth process. However, when these assets lose their effectiveness due to a decrease in their marginal returns (new ideas become old, and time to work on new products becomes a luxury, while market failures, legal problems and other issues dampen the initial passion and perseverance of new entrepreneurs), the start-up firm loses its initial spark. At this point, the adolescence of the start-up firm begins, and continued growth becomes more challenging. This process induces an inverse relationship with age (R2).
Research contributions, managerial implications and limitations
This study is designed to make one major contribution to the current debate on the growth drivers of start-up firms: to provide a richer, fine-grained, coherent picture of the many potential growth drivers of start-up firms. Particularly, we considered more extensive potential drivers than previous research on this topic. For example, the meta-analysis conducted by Song et al. (2008) considered 24 possible success factors for new technology firms, whereas this study includes 66 factors without losing methodological rigour and confirms many results obtained by Song et al. (2008), particularly regarding the role of the size of the founding team, financial resources, firm age and founders' marketing and industry experience (results also previously confirmed by Siegel et al., 1993). Unlike Song et al. (2008), we found no evidence for a supportive role of supply chain integration (this difference, though, could reflect the greater ease for start-ups to set up and manage successful business models that rely heavily on external resources). Also, we did not label drivers that we found to be significantly related to growth as non-significant.
In contrast to Eisenhardt and Schoonhoven (1990), we found limited evidence of the effect of the market/industry context on the growth chances of start-up firms. While they found support “for the convergence of environmental determinism and strategic choice explanations for important firm outcomes” (Eisenhardt and Schoonhoven, 1990, p. 525), our study—which was conducted exactly 30 years later—suggested the opposite: market and industry drivers contribute only modestly to explain the growth chances of start-up firms, while more empirical evidence is needed to confirm the role played by strategic drivers.
Our study confirmed the results obtained by McDougall et al. (1994) on the supportive role exerted by the industry growth rate. However, we cannot confirm the positive effects of pursuing broad breadth strategies. Contrastingly, this study shows a significant shortage in the number of studies applying a strategic lens to the analysis of the growth paths of start-up firms. Finally, our study complements the results obtained by Davidsson (1989b), showing that expectations (to grow) push small, young firms to grow more; moreover, a positive self-reinforcement effect exists as past positive growth performance paves the way for further growth of start-up firms.
An additional contribution is the inclusion of qualitative papers in this study. In the classification process, we provided equal weight to quantitative and qualitative studies by defining subjective but not arbitrary criteria for including the variables used in qualitative papers. We have to acknowledge that qualitative papers often offer rich descriptions of the growth of start-up firms, but fail to identify the triggering factors. Undoubtedly, such descriptions enrich our knowledge on how the process of growth happens (Pugliese et al., 2016), but scholars should not forget to go beyond descriptions to help both academics and practitioners better understand the causal relationships that link phenomenon. In this connection, our thoughts go immediately into the discussion of the business model driver (M1).
Although a literature review, we believe that our study could have important implications for both start-ups and policymakers. For start-ups and potential entrepreneurs, our study suggests carefully synergising the founding team comprising people with different backgrounds and, possibly, having previous entrepreneurial and managerial experience. Since the confirmed role played by previous industry experience, we suggest that start-ups should seriously consider the possibility of participating in corporate entrepreneurship programmes launched by bigger incumbents. Regarding the business model, our review suggests start-uppers not to be obsessed with it, notwithstanding numerous anecdotal evidence and commercial literature trying to convince start-uppers of the opposite. Furthermore, we suggest that start-ups focus on their capabilities development, possibly from a location that can encourage them to develop their skills and to widen their networks, such as scientific and technology parks, incubators and accelerators.
Our paper could also benefit policymakers who could find multiple inspirations in the results to fine-tune their supporting policies. Particularly, policymakers should find original ways to facilitate meetings between start-ups and established companies. Such occasions could provide fruitful results to both parties: incumbents can expose themselves to new technologies, business models and fresh ideas, while start-ups could benefit from the managers' experience and connections in an industry.
Finally, our study is not without limitations. First, we did not consider moderating and mediating relationships. For simplicity, we analysed only direct relationships, not indirect relationships, which further research should consider. Second, we separately studied the effect of each variable losing information about co-variations. Particularly, we lose potentially relevant information about the different roles played by the same variables when used as single growth predictors or in combination. For example, the values of certain resources likely change according to the context in which they are used. Further research is needed to clarify this aspect. Third, despite the systematic review process, we might have missed some studies and drivers [3].
Notes
The integral list of the selected 316 studies is available online at: http://bit.ly/3hn2t6Y
Of course some caution is always needed in social sciences where causation effects are always tricky to support from an empirical perspective.
The entire database produced in this study is available upon request. It should be mentioned that this paper originates from a larger project constructing an open online dataset on the growth drivers of start-up firms to which all scholars can contribute, add new evidence and extract data to conduct further studies on this subject. To preserve the blind review process, more details on this project will be disclosed before the publication of this study.