


The purpose of this paper is to study the optimization of the geographical location of a network of points of sale, so that each retailer can have access to a potential geographic market. In addition, the authors study the importance of the distance variable in the commercial viability of a point of sale and a network of points of sale, analysing if the best location for each point (local optimum) is always the best location for the whole (global optimum).
Location-allocation models are applied using p-median algorithms and spatial competition maximization to analyse the actual journeys of 64,740 car buyers in 1240 postal codes using a geographic information system (GIS) and geomarketing techniques.
The models show that the pursuit of individual objectives by each concessionaire over the collective provides poorer results for the whole network of points of sale when compared to coordinated competition. The solutions provided by the models considering geographic and marketing criteria permit a reduction in the length of journeys made by the buyers. GIS allows the optimal control of market demand coverage through the collaborative strategies of the supplying retailers, in this case, car dealerships.
The paper contributes to the joint research of geography and marketing from a theoretical and practical point of view. The main contribution is the use of information on actual buyer journeys for the optimal location of a network of points of sale. This research also contributes to the analysis of the correlation between the optimum local and optimum global locations of a commercial network and is a pioneering work in the application of these models to the automotive sector in the territorial area of the study.
1. Introduction
There is increasing interest in the potential opportunities arising from extracting spatial information from large data sets (Comber et al., 2016). Approximately 75 per cent of the data used by business decision makers include at least one spatial component, such as customer address, geographic distribution of population, market coverage or commercial area (Ozimec et al., 2010).
Geomarketing is a discipline that has been developed to make decisions according to geographical and marketing criteria (Rodríguez et al., 2015). Geomarketing uses statistical geometry, defined by Goodchild (2008) as the application of probabilistic methods to geometric forms. For any geomarketing study, a geographic information system (GIS) is needed: “a computer application capable of creating, storing, manipulating, visualizing and analysing geographic information” (Goodchild, 2000, p. 6). This link between attributes and geography is a distinctive feature of GIS (Goodchild, 1991). GISs are widely applied in developed countries, such as the USA or Great Britain (Allo, 2014). Their widespread use has made them a tool for sharing and communicating knowledge about the earth’s surface (Sui and Goodchild, 2011). Although geolocation systems are highly developed, scarcely any work on geomarketing has been done, creating an opportunity for research in this area (e.g. Ozimec et al., 2010; Comber et al., 2016). There is also an increasing interest in visualizing and analysing spatio-temporal data through geo-intelligence tools (Bozkaya and Singh, 2015; Altshuler et al., 2015; Lucas et al., 2015).
In this context, the present work aims to contribute to the joint research of geography and marketing from a theoretical and practical standpoint. To this end, the main objective is to study the optimization of the geographical locations of a network of points of sale, so that each retailer can have access to a potential geographic market. From the main goal, the following secondary objectives can be derived:
to detect the impact of the distance variable in the commercial viability of a point of sale and a network of points of sale, analysing if the best location of each point (local optimum) is always the best location for the entire network (global optimum); and
to evaluate the usefulness of geomarketing and GIS in the development of commercial networks and analyse whether their application improves access to potential markets.
This paper shows in a theoretical and practical way the importance of analysing economic and geographic variables together for the optimization of a commercial network, applying geomarketing techniques through the use of GIS. For this, we study the actual journeys of 64,740 car buyers, and the number of points of sale and their locations are optimized. The main contribution of this paper is the use of real journey information to evaluate the location of a network of points of sale. While most studies use statistical estimates of buyer journeys (e.g. Cardozo et al., 2010; Buzai, 2011; Casado and Palacios, 2012), this research also provides an analysis of the correlation between the optimum local and optimum overall locations in a commercial network. This paper is also a pioneer in the application of these models in the industry and in the territorial area of study.
2. Theoretical framework
The social sciences, especially geography, make a profound re-evaluation of the concept of territory based on their multiple manifestations (Fonseca et al., 2016). It should be noted that in the field of geography “there is a long tradition of finding the optimal solutions to design problems in the research domain known as spatial optimization” (Goodchild, 2010, p. 10). Spatial dependence has already been defined through Tobler’s (1970) first law: all things are related, but closer things are more closely related than distant things. Although the nature of spatial mobility is obvious, it has often not been considered for the design of journeys (Loidl et al., 2016).
Since the 1960s, various studies have been conducted to assess the influence of geographic distance on buyers. One of the pioneering studies was by Bishop and Brown (1969) on food buying habits in the year 1966. These authors concluded that a significant number of clients are subject, for one reason or another, to some form of spatial monopoly.
Recently, other authors have re-emphasized the importance of considering geographical criteria in organizational decisions (e.g. Chasco, 2003; Ozimec et al., 2010; Buzai, 2011; Gutiérrez-Gallego et al., 2012; Allo, 2014; Altshuler et al., 2015), and different GISs have been developed for spatial behavioural analysis (e.g. Loidl et al., 2016; Fonseca et al., 2016).
For business decision makers, the location of facilities to achieve the greatest coverage has long been a major concern (Tong, 2012). One approach is to use location-allocation models that optimally locate facilities and allocate demand to each of the points of sale (Zeng et al., 2009). In this way, location-allocation models investigate the need for additional service centres, the optimal relocation of existing service centres or the effects of a reduction in the number of centres (Jong de and Tilema, 2005). Geomarketing has entailed the application of these techniques to identify “hot” areas with greater commercial attractiveness for companies (Cardozo et al., 2010). The competitive advantages of good locations for a network of points of sale are obvious, since, from these locations, a spatial dependence with the environment is created (López and Chasco, 2007).
Table I presents a synthesis of research in the field of geomarketing.
Principal results of studies on geomarketing and GIS
| Research objective | Methodology | Conclusions | Source |
|---|---|---|---|
| Geomarketing | |||
| To analyse the utility of geomarketing techniques | Theoretical review | Geomarketing aids rational decision making in developing countries | Allo (2014) |
| To demonstrate the importance of geomarketing in commercial distribution | Gravity model and Multinomial Logit | The location of “shadow zones” in commercial networks can be solved by GIS | Calero (2004) |
| To analyse the utility of the variogram function | Variogram function | Development of a spatial instrument combining analytical and graphical analysis | Chica Olmo and Luque Martínez (1992) |
| To analyse the cost of land in the City of Granada | Residual Iterative Kriging Method | Development of a methodology for estimating the price and value of houses | Chica Olmo (1995) |
| Eliminate the uncertainty in spatial analysis | GIS | GIS are geographical decision-making tools in environments with a degree of uncertainty | Goodchild (2008) |
| Analyse the utility of GIS in Geo-design. | GISs are valid tools for geo-design of commercial networks | Goodchild (2010) | |
| Spatial problems | |||
| Allocation of individuals to different geographical centres | Inner group of centrality | The allocation of clients and costs to each regional unit provides improvements in marketing management and returns | Altshuler et al. (2015) |
| Location-allocation model | Optimization of the allocation of individuals to primary health care centres in Lujan (Argentina) | Buzai (2011) | |
| GISs reduce the journey length for citizens to electoral modules in Chihuahua (México) | Casado and Palacios (2012) | ||
| GISs allow the analysis of access to social services by the different social strata in the Republic of Philippines | Delgado and Canters (2011) | ||
| GISs allow analysis of the differences in land use by the different social strata in Montevideo (Uruguay) | Fonseca et al. (2016) | ||
| GISs allow the analysis of land use planning and the spread of land prices in Montevideo | Lozano-Botache (2016) | ||
| Design of a location-price model of a network of petrol stations in Singapore | Chan et al. (2007) | ||
| Maximization of the coverage of a network of acoustic warning stations in Dublin (Ohio) | Tong (2012) | ||
| Huff Model | Utility of the Huff Model in the analysis of the attraction capacity of shopping centres | Díez and Escalona (2001) | |
| Undesirable installations | Location-allocation models | Models for the identification of undesirable installations | Bosque and Franco (1995) |
| Distribution intensity and its effect on purchasing | Gini coefficient | Importance of spatial proximity of clients in the automotive sector | Bucklin et al. (2008) |
| Nakanishi and Cooper model | Shows the utility of these models in the installation of a new point of sale in an already existing network | Drezner (1994) | |
| Variance analysis | Relationship between long journeys and purchase of durable goods | Hyman (1987) | |
| Regression model | Demonstrates the importance of geographical distance in commercial relations | Ganesan et al. (2005) | |
| Weighted geographic regression models | Displays different patterns of satisfaction with a network of points of sale depending on the physical and psychological factors of their clients by virtue of their geographic location | Mittal et al. (2004) | |
| Location-allocation model. GIS | Models and maps spatial competition and its impact on trade | Moreno (2003) | |
| Reduction of urban and rural journeys for the purchase of durable goods | Rodríguez et al. (2015) | ||
| Territorial analysis | Kernel Estimator and weighted geographic regression models | Analysis of the land cover generated by Geo-Wiki project on a 50 kilometres grid | Comber et al. (2016) |
| Kernel Estimator | Optimization of location of hospitals | Donthu and Rust (1989) | |
| P-Median hierarchical models and SILA | Demonstrates unequal access to health services in Ghana | Yasenovskiy and Hodgson (2007) | |
| Design of journey flows and transport | GIS | Demonstrates the validity of GIS for the design of transport flows | Loidl et al. (2016) |
| Pickup and intercept flow models | The application of these models in the analysis of buyer journeys | Zeng et al. (2009) | |
| Theoretical problems | |||
| Model design | Minsum and Minmax | Demonstrates when to apply each developed model | Carrizosa and Romero (2001) |
| Utility of geographic analysis | Exploratory analysis of spatial data | Applications of geomarketing in the distribution sector | Chasco (2003) |
| GIS, Huff Model and LISA | Demonstrates the usefulness of the application of geomarketing in marketing departments | Chasco (2012) | |
| Location-allocation model. GIS | Pioneering work demonstrating the progress in marketing decisions due to GIS | García-Palomo (1997) | |
| GIS | Shows the business benefits of geographic analysis | Goodchild (1991) | |
| Analyses the importance of symbolization for geographic information users | Ozimec et al. (2010) | ||
| Extends the validity of GIS for temporal and geographical analysis | Goodchild (2013) | ||
| Theoretical review | Retrospective analysis of the creation and evolution of GIS. | Goodchild (2000) | |
| Demonstrates opportunities offered by geographical research techniques (GRT) | Moreno (2004) | ||
| First order spatial autoregressive model | Demonstrates existence of a delay between the variation of macroeconomic variables and its geographic implications | López and Chasco (2007) | |
The theoretical framework highlights the importance of spatial attributes, since geographical proximity facilitates the formation of important links with suppliers (e.g. Ganesan et al., 2005). However, even though the automotive sector is strategic within the aggregate of the Spanish economy (Moral-Rincón, 2004; Levy Mangin et al., 2007; Moyano-Fuentes and Martínez-Jurado, 2012; Makarova et al., 2012; González et al., 2013; Busse et al., 2016), there has been a lack of research into the spatial relationship between dealer networks and vehicle buyers. Therefore, from an economic-geographical conception, the following hypotheses are proposed for the automotive sector:
The application of location-allocation models allows the optimal location of a network of points of sale.
Consumer journeys affect the optimal location of a network of points of sale.
There exist numerous academic works based on competition between various points of sale (Bigné and Vila, 2000; Altshuler et al., 2015; Bucklin et al., 2008; Buzai, 2011; Calero, 2004; Flaherty and Pappas, 2002; Chan et al., 2007; Díez and Escalona, 2001; Donthu and Rust, 1989; Drezner, 1994; Mittal et al., 2004; Moreno, 2003; Rodríguez et al., 2015; Yasenkovsky and Hodgson, 2007; Zeng et al., 2009), but it is the research of Chan et al. (2007) which highlights an interesting aspect based on the competition model of Bertrand. In this competitive model:
companies do not cooperate;
firms compete on the basis of their distance from the buyer (in this study, price is not considered a determinant variable but distance is considered so); and
consumers purchase products at the nearest point of sale.
Academic works have been conducted in which location-allocation models and spatial competition maximization models have been applied. In these models, priority was given to the interests of each individual bidder-competitor over the collective (Moreno and Buzai, 2008). In this paper, we analyse whether the location of each dealership should be considered in relation to the other points of the sale in the network (Chan et al., 2007), so the following hypothesis is proposed:
The optimal solution for each point of sale (local optimum) is optimal for the entire network (global optimum).
3. Models, sources of information and data
3.1 Models
To test the hypotheses, the p-median and maximization models of market share or spatial competition are used.
P-median or minisum model
The p-median or minisum model locates a pre-set number of installations minimizing the total Euclidean distance between these and the demand points, weighting the distance between each point and installation in function of stated demand (Casado and Palacios, 2012). The results show the optimal locations that are most convenient for users, minimizing the average distance they must travel.
The mathematical formulation given by Calero (2004) for the p-median model is that each demand point is represented by an index i, where I is the set of all demand points. Each possible location is represented by an index j, and J is the set of all locations:
wi = represents the demand for goods at geographical point I;
dij = is the distance between i and j; and
xij = is the journey of a buyer from a demand point i to the location of the dealership j.Decision variables xij satisfies the following:
xij = 1 if dij = min {dik|k belongs to J};
xij = 0 in the other case;
xjj = 1 if a point of sale is opened in j; and
xjj = 0 in the other case.
The objective is to minimize the distance that the buyer needs to travel to reach the point of sale.
W is the total maximum distance weighted by demand:
Restrictions:
J is the set of all locations j where the dealerships p are located:
According to Buzai (2011), the objective of the p-median model is to minimize the sum of the total of the products of the population displacements from the points of demand (centroids of the Andalucian post codes that group the dispersed demand) to the supply points. On the one hand, we try to act on the global cost of displacement (efficiency), and on the other hand we try to minimize the maximum distances of transfer (equity).
Maximization of individual market share model or spatial competition
This model has the aim that each centre achieves the greatest demand possible (even to the detriment of other centres or the global network). The model is guided by the principle of efficiency and, unlike the previous one, does not respond to the logic of cooperation between service centres to achieve a global solution that prioritizes interests to demand, but privileges those of each individual bidder-competitor (Moreno and Buzai, 2008). The model seeks to maximize the selfish behaviour of each of the sales agents, giving priority to individual benefit over the collective. As defined by Carrizosa (2013):
where d is the captured demand at each point xi of the total set (X), i=1, 2, …, n are the candidate locations of each point of sale, fi the function that maximizes the captured demand at point of sale i:
where wX is a decreasing function.
Market competitive services exist at points of sale p1, …, pn.
The demand captured at each point xi is as follows:
3.2 Sources of information and data
The sources of information used in this study are the following:
Institute of Automotive Studies of the National Association of Automobile and Truck Manufacturers for registration data from 2007 to 2011.
Andalucian Institute of Statistics and Cartography, web page on International Postal Codes and the web page Geopostcodes.com have been used for the geographic location for the centroids of each of the postal codes collected.
Automobiles Citroën Spain provided the sales data for each establishment and the postal codes of the customers.
The information being obtained, we began with geocoding, defined as a process of assigning map coordinates to an entity (Calero, 2004). As part of this process, the centroids of all postal codes in Andalucia were located. Subsequently, the dealerships of the base network were located geographically (Table II).
Base network
| Post code | Municipality | Longitude | Latitude |
|---|---|---|---|
| 11011 | Cádiz | −625.054 | 36.479.678 |
| 11205 | Algeciras | −545.781 | 36.160.762 |
| 11407 | Jerez de la Frontera | −613.679 | 36.704.790 |
| 14013 | Córdoba | −481.052 | 37.759.901 |
| 14014 | Córdoba | −468.526 | 37.967.292 |
| 14400 | Pozoblanco | −475.872 | 38.278.041 |
| 14900 | Lucena | −453.285 | 37.368.212 |
| 18015 | Granada | −366.193 | 37.193.625 |
| 18600 | Motril | −349.061 | 36.748.674 |
| 21007 | Huelva | −690.005 | 37.298.018 |
| 23009 | Jaén | −370.429 | 37.856.368 |
| 23400 | Úbeda | −335.994 | 38.014.374 |
| 23650 | Torredonjimeno | −395.926 | 37.765.430 |
| 29004 | Málaga | −448.319 | 36.681.661 |
| 29006 | Málaga | −449.800 | 36.710.680 |
| 29200 | Antequera | −457.907 | 36.998.432 |
| 29603 | Marbella | −488.635 | 36.509.940 |
| 29640 | Fuengirola | −461.738 | 36.558.552 |
| 29700 | Vélez-Málaga | −412.054 | 36.757.442 |
| 41007 | Sevilla | −595.645 | 37.396.389 |
| 41015 | Sevilla | −597.338 | 37.435.396 |
| 41410 | Carmona | −557.559 | 37.457.564 |
| 41560 | Estepa | −489.833 | 37.300.084 |
| 94230 | Huércal de Almería | −246.901 | 36.886.223 |
| 94710 | El Ejido | −277.546 | 36.783.396 |
Note: Geographical location of dealers in 2011
The GIS Flowmap was used for the digital representation of 64,740 actual trips of buyers to the 25 points of sale of the base network. The distance used is Euclidean. Flowmap is a programme created by the Faculty of Geographical Sciences of the University of Utrecht, which “is specialized in the visualization of data interaction, such as migration paths and flows, interaction analysis such as accessibility analysis, network analysis, and models of interaction” (Breukelman et al., 2009, p. 7).
Flowmap is a spatial analysis-oriented programme that incorporates a set of tools to address various analyses, mainly the following (e.g. Maarten, 2002; Moreno and Buzai, 2008; Delgado and Canters, 2011; Buzai, 2011):
analysis of flows between places (of goods, people or information);
models of spatial interaction, spatial accessibility and network analysis; and
models of optimal location.
The result of the analysis carried out is shown in Figure 1. Here, thick and thinner lines are seen. The thicker lines correspond to a greater flow of journeys to that dealership.
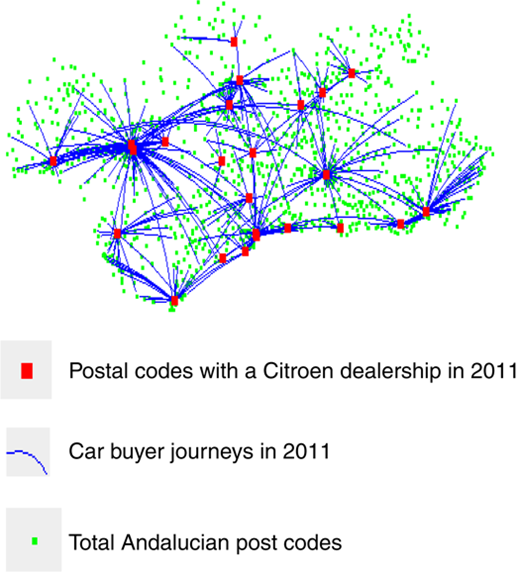
Although the number of points of sale has remained stable, the average market per dealership has shifted from 7,406.48 private vehicles registered in 2006 to 2,589.60 in 2011 (Table III).
Evolution of the potential market for car dealerships in Andalucia
| 2006 | 2007 | 2008 | 2009 | 2010 | 2011 | |
|---|---|---|---|---|---|---|
| Number of registrations | 185,162 | 175,735 | 116,391 | 111,102 | 101,553 | 64,740 |
| Dealerships in the network | 25 | 25 | 25 | 25 | 25 | 25 |
| Average of dealer market | 7,406.48 | 7,029.40 | 4,655.64 | 4,444.08 | 4,062.12 | 2,589.60 |
Source: Own design based on data from Institute of Automotive Studies
“Market potential” is defined as the area of average registrations that a dealer must be able to access to be commercially viable. This potential market must be large enough to make the necessary sales to cover internal expenses. It should be noted that neither the demand at the points of sale nor their internal costs are uniform, so it is necessary to apply an average covering the generality of the cases. For this average, account was taken that the year 2007 was a record year in sales at the national level and that 2008 was the first year of strong decline in vehicle registrations and, in consequence, a reduction in dealer networks (Navas, 2014; Blanchar, 2013). Due to the foregoing, we estimate what the minimum potential market volume for the viability of a dealer in Andalucia may be on average between 2007 and 2008 (see Table IV), years in which the points of sale still had access to sufficient markets.
Calculation of minimum potential market for dealerships
| 2007 | 2008 | |
|---|---|---|
| Registrations made in Andalucia | 175,735 | 116,391 |
| Number of dealerships in the network | 25 | 25 |
| Market share per dealership | 7,029.4 | 4,655.64 |
| Estimate of minimum potential market | 5,842.52 |
Source: Own design based on data from the Institute of Automotive Studies
From the minimum potential market of 5,842 vehicles, the threshold of average trips to dealers is calculated to determine the geographic area of influence that they must cover to achieve this. In this regard, the area that a network of 25 dealers in Andalucia must cover to opt for an average potential market of 5,842 vehicles in 2011 is within a radius of 57.81 kilometres on average around each dealership. If we consider that the number of points of sale of the base network is 25, by necessity some will have to “cannibalize” the areas of influence of others in the same network. To make the network viable and cover the same market, the solution would be to reduce the number of dealerships offering the selected models. From the abovementioned, we proceed to calculate what would be the viable number of dealerships in this environment. To do this, the market for private vehicles in the year 2011 must be divided between the number of dealerships and the result must be as close as possible to those 5,842 vehicles considered as the average potential market which provides access to minimum potential market share, as shown in Table V.
Adjustment of points of sale
| Registrations made in Andalucia | 64,740 |
| Optimum number of dealerships | 11 |
| Market per dealership | 5,885.45 |
These calculations suggest that a network of 11 dealerships in Andalucia would be the appropriate number to reach the estimated potential market and would allow more viable market coverage for this commercial network.
4. Results
The model begins with a set of 25 points of sale locations. The application of the reduction models allows, at each stage, the progressive elimination of the locations with less influence on the market share of the network (Jong de and Tilema, 2005; Breukelman et al., 2009).
Given that both the market volume and the location of the dealerships are relevant variables, the algorithm of average distance travelled by customers (p-median) and the algorithm of elimination of locations with poor results are applied through the reduction model (maximization of the individual quota) depending on the volume of registrations. Moreno and Buzai (2008, p. 136) recommend “to test the application of various algorithms, independently or combined, and compare the obtained solutions, so that the suboptimal ones can be discarded and the most successful to be accepted as the optimal one”.
4.1 Selection of the eleven dealerships
To begin the process of deciding the best solution among the proposals, a comparison must be made between the solutions of the average distance algorithms and the maximization of the individual quota. In Table VI, the surviving dealerships are arrived at after both algorithms are applied (surviving dealerships are those that have not been eliminated after application of the models).
Surviving points of sale
| Average distance | Maximization of individual quota | ||
|---|---|---|---|
| Post code | Municipality | Post code | Municipality |
| 11205 | Algeciras | 11205 | Algeciras |
| 11407 | Jerez de la Frontera | 11407 | Jerez de la Frontera |
| 14014 | Córdoba | 14013 | Córdoba |
| 18015 | Granada | 18015 | Granada |
| 21007 | Huelva | 21007 | Huelva |
| 23650 | Torredonjimeno | 23009 | Jaén |
| 29006 | Málaga | 29006 | Málaga |
| 41015 | Sevilla | 29603 | Marbella |
| 41560 | Estepa | 41007 | Sevilla |
| 94230 | Huércal de Almería | 41015 | Sevilla |
| 94710 | El Ejido | 94230 | Huércal de Almería |
The best solution must take into account the average distances that car buyers travel in each case. In the average distance solution, the point of sale with the greatest journey is 41.14 kilometres’ radius around the dealership. Meanwhile, in the solution for maximizing the individual quota, the average distance travelled by customers, in the case of the longest journey, is 35.58 kilometres’ radius around the dealership. From all the above, the optimal solution is the one that eliminates the worst market results (maximization of the individual quota). The cartographic representations of the discarded dealerships, their disposal order according to their potential market share (the number that accompanies them between 1 and 14) and the surviving dealers marked with a blue dot are shown in Figure 2.
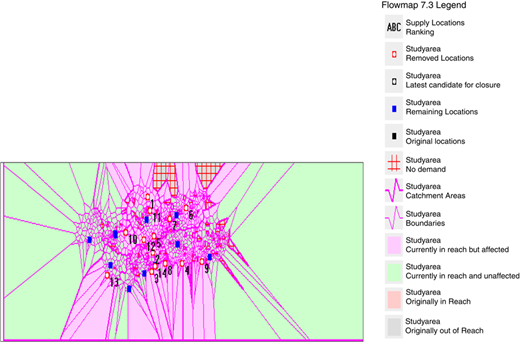
4.2 Dealership relocation model
The relocation model is applied for the optimal cartographic location of a predetermined number of installations of a given network (Breukelman et al., 2009). Table VII shows the results of the different algorithms applied.
Relocation model solutions
| Maximization of competition over the average distance | Average distance over the best market results | Maximization of competition over best markets | |||
|---|---|---|---|---|---|
| Post code | Municipality | Post code | Municipality | Post code | Municipality |
| 11401 | Jerez de la Frontera | 11202 | Algeciras | 11404 | Jerez de la Frontera |
| 14002 | Córdoba | 11500 | El Puerto de Santa María | 11518 | Puerto Real |
| 18014 | Granada | 14004 | Córdoba | 14013 | Córdoba |
| 18200 | Maracena | 18004 | Granada | 18012 | Granada |
| 29006 | Málaga | 21004 | Huelva | 18200 | Maracena |
| 29015 | Málaga | 23630 | Villatorres | 29006 | Málaga |
| 29692 | Manilva | 29007 | Málaga | 29603 | Marbella |
| 41003 | Sevilla | 29601 | Marbella | 41005 | Sevilla |
| 41006 | Sevilla | 41007 | Sevilla | 41007 | Sevilla |
| 41806 | Umbrete | 41930 | Bormujos | 41808 | Villanueva del Ariscal |
| 94230 | Huércal de Almería | 94003 | Almería | 94230 | Huércal de Almería |
The interpretation of the results ordered from the most to the least favourable is as follows:
Maximization of competition over the best markets: the most unfavourable case of potential market for a dealership is 4,660 vehicles. If the target that has been determined for a point of sale is access to a potential market of 5,842 vehicles, this result assumes that the point of sale has access to only 80 per cent of that potential.
Maximization of competition over average distance: the most unfavourable case of potential market is 4,619 vehicles. This result represents 79 per cent of the potential fixed market.
Average distance over better market results: the most unfavourable case of potential market is 3,416 vehicles. This result represents 58 per cent of the potential fixed market.
It has become clear that dealers cannot cover market areas in a radius of 57.81 kilometres around the dealership. Therefore, it can be inferred that customer journeys affect the optimal location of a network of points of sale. In conclusion, it can be affirmed that H2 is accepted. The first thing highlighted in the three proposals is that the optimal solutions in which the algorithm of the maximization of spatial competition has been applied do not locate points of sale in the provinces of Huelva or Jaén. Continuing with this observation, the shortest distance that the buyers of vehicles from the municipality of Huelva, the main market of this province, will have to travel to the nearest dealer (located in postal code 41806 in the municipality of Humbrete) is 82 kilometres. The shortest distance that the buyers of vehicles from the municipality of Jaén, main market of this province, will have to travel to the nearest dealership (located in postal code 18200 in the municipality of Maracena) is 88 kilometres. Therefore, the solutions given by the algorithm of maximization of spatial competition cannot be considered optimal because they leave important potential markets without coverage. In this regard, it can be affirmed that the application of the location models has allowed for the optimal locating of a network of points of sale; therefore, H1 is accepted. The optimal solution for the placement of a generalist dealer network in Andalucia is presented in Table VIII.
Global optimum solution for the location of dealerships
| Postal code | Municipality |
|---|---|
| 11202 | Algeciras |
| 11500 | El Puerto de Santa María |
| 14004 | Córdoba |
| 18004 | Granada |
| 21004 | Huelva |
| 23630 | Villatorres |
| 29007 | Málaga |
| 29601 | Marbella |
| 41007 | Sevilla |
| 41930 | Bormujos |
| 94003 | Almería |
As a result of these findings, one can begin to relocate the dealerships (Figure 3). The longest average distance that buyers will have to travel according to this model is 34.47 kilometres’ radius around the dealer.
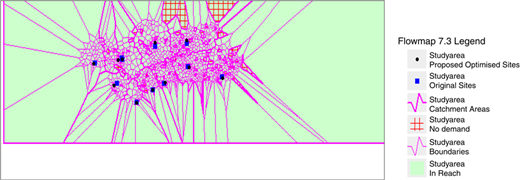
Relocation of dealerships applying the algorithm of minimization of average distance
Relocation of dealerships applying the algorithm of minimization of average distance
The analysis to determine the optimal solution for a network of points of sale brings forth the following paradox: the optimal solution for individual dealerships does not coincide with the optimal solution for the whole network.
Table IX shows the results of applying the dealership relocation model and the spatial competition maximization algorithm. These locations optimize the potential markets for the individual dealerships but not for the total network. Therefore, we have a local optimum. This model aims to achieve the greatest amount of demand for each centre (even to the detriment of other centres or the global network). That is to say, the optimal solution of this algorithm will geographically locate the dealers in their optimal individual location, which will be the one that allows the largest market capture. This statement is consistent with the previous literature: “retail establishments polarize towards the major urban centres” (Chica Olmo and Luque Martínez, 1992, p. 127). In this case, the local optimum does not lead to a global optimum, and therefore, it can be affirmed that H3 is rejected.
5. Conclusions
In this work, we have analysed the real journeys of buyers with the aim of optimizing the location of a network of points of sale, to contribute to the joint research of geography and marketing from the theoretical and practical point of view. Many authors have highlighted the importance of considering geographical criteria in business decisions (e.g. Ozimec et al., 2010; Buzai, 2011; Allo, 2014; Altshuler et al., 2015; Loidl et al., 2016; Fonseca et al., 2016). The optimal location of points of sale is a relevant problem within business strategy (e.g. Tong, 2012; Zeng et al., 2009). The definition of a commercial network supposes a form of spatial monopoly based on the strong relations generated between suppliers and clients according to their geographical proximity (Ganesan et al., 2005). In this context, previous literature has demonstrated the importance of segmenting markets based on geographic variables (e.g. Chasco, 2012; Casado and Palacios, 2012; Tong, 2012) and the usefulness of econometric analysis in the locating of points of sale (Mittal et al., 2004). This work allows us to draw the following conclusions:
The impact of the distance variable on the commercial viability of a dealership and the network to which it belongs is crucial in the optimization of the placement of the point of sale. Through GIS one arrives at the solution that maximizes the market area covered with the least points of sale. At the beginning of the study, vehicle buyers made average trips of less than 57.81 kilometres to purchase a vehicle. Knowledge of the habits of buyers when travelling to points of sale has allowed us to discard two of the three proposed solutions provided by the application of the location-allocation models, because they left areas of more than 80 kilometres uncovered.
The algorithm of maximization of spatial competition relocation model increases rivalry between points of sale. With this function, there are locations for points of sale with access to greater potential markets than those points of sale located in the smaller commercial areas. These results were more balanced than those obtained with algorithms with cooperative strategies (p-median or minimization of mean distance).
The optimum solution obtained for the whole network of points of sale (global optimum) is not the best for each point of sale (local optimum). The pursuit of individual objectives by each dealership, over the collective, provides poorer results for the whole network than with coordinated competition. These results complete the work of Chan et al. (2007). Nonetheless, this research demonstrates another solution that individually offers each point of sale access to more viable potential markets vs the global solution and that also makes these markets more balanced among them. It should be noted that the authors do not find any scientific documents in this line of research.
The following conclusion is aligned with the final objective of this research: to demonstrate the usefulness of geomarketing in the development of commercial networks using real consumer journeys. From the analysis of each of the dealer’s market areas, it is corroborated that knowledge of the journeys to the network of points of sale is fundamental for their optimal location, minimizing the buyers’ journeys. That is to say, the joint application of the p-median algorithms and the maximization of the individual quota allow better access to larger potential markets by identifying geographic areas with greater commercial interest for the company. These conclusions are consistent with previous research by Bosque and García (1995), García-Palomo (1997), Goodchild (1991), Moreno (2004), Goodchild (2008) and Ozimec et al. (2010).
As a final conclusion, the results show that GIS can optimally control the market demand coverage through retailers’ collaborative strategies (in this case, car dealerships).
5.1 Managerial implications
The development of strategies of collaboration vs competition in the network of points of sale involves convincing the management of each point of the premise that collaboration provides the best overall solution. It is essential for the optimal location of a network of points of sale to consider the network as a whole, and not each one of the points in isolation, and that the parent company promotes actions that lead to a coordinated competition. The use of GIS is recommended with its integration into the marketing information system to anticipate the evolution of macroenvironments and microenvironments. Distance is a physical variable, known and controllable, that should be considered key in any marketing plan. Therefore, it can be concluded that location-allocation models can be of very great use to managers, and that the p-median model can strengthen commercial networks through their optimal positioning, while achieving major benefits for the network of dealers and for their customers.
5.2 Limitations and future lines of research
The main limitation of this investigation is that in the calculation of the results of the models the only variables considered are geographical location of the points of sale and the distance travelled by buyers. In Lozano-Botache’s (2016) words “a model is only a representation of reality explained geometrically and with mathematical support, which can result in true economic terms within the ceteris paribus framework” (p. 692). This decision was taken by the researchers to assess the influence of the location of every point of sale in a commercial network and their access to minimum potential geographic markets. Thus, for future works, we suggest study of the effect of other variables such as brand image, price, manufacturer advertising investment or advertising at the point of sale. Other variables may be the effect of the type of vehicle (product), since it has been considered to have the same degree of acceptance throughout the study area. Lack of information regarding the internal costs of each point of sale opens a new line of research. The second limitation comes from the investigation period. As has been indicated, the study interval 2007-2011 allowed us to obtain and analyse results in an economic context of special interest. It is recognized that the data become outdated quickly and, therefore, it is recommended that the study be replicated in the future. Another limitation has been the restriction on access to registration information (vehicle sales), since the Organic Law on Data Protection does not allow the dissemination of personal information that may lead to the identification of the individual (or a specific vehicle). Therefore, the postal code of the buyer is the highest level of detail for the registration data. Future work could introduce the influence of gender or the age of the vehicle buyer. Another aspect to be considered in the interpretation of the results is that this research has been carried out in a specific area and has been limited to the movements within it. It is possible that the behaviours are different in other autonomous communities or other countries.
This research was funded by the Spanish Ministry of Economy and Competitiveness (Research Project reference: ECO2014-59688-R, National Program for Research, Development and Innovation Aimed at the Challenges of Society, National Plan of Scientific and Technical Research and Innovation 2013-2016). Moreover, a version of this work has been previously published as Working Paper No. DOCFRADIS1602 of the Working Documents Collection of the Ramón Areces Foundation of Commercial Distribution (http:catedrafundacionarecesdc.uniovi.es).

