The present study aims to construct ensemble machine learning (EML) algorithms for groundwater potentiality mapping (GPM) in the Teesta River basin of Bangladesh, including random forest (RF) and random subspace (RSS).
The RF and RSS models have been implemented for integrating 14 selected groundwater condition parametres with groundwater inventories for generating GPMs. The GPM were then validated using the empirical and bionormal receiver operating characteristics (ROC) curve.
The very high (831–1200 km2) and high groundwater potential areas (521–680 km2) were predicted using EML algorithms. The RSS (AUC-0.892) model outperformed RF model based on ROC's area under curve (AUC).
Two new EML models have been constructed for GPM. These findings will aid in proposing sustainable water resource management plans.
1. Introduction
Groundwater is the world's largest source of freshwater (i.e. one-third of worldwide freshwater consumption) but there is a shortage of data at a micro-spatial level on the potential groundwater source (Ferozur et al., 2019; Adham et al., 2010). Groundwater use is continuously increasing. These increasing demands usually result in overexploitation, putting a pressure on the limited supply of freshwater (Jahan et al., 2019). Furthermore, groundwater problems have worsened, particularly in the tropical and subtropical zones, as a result of unregulated irrigation practices, high population density and climate change.
Groundwater potentiality has been investigated using physical, heuristic and mathematical techniques (Namous et al., 2021). Physical techniques evaluate groundwater potential by examining topography and geology (Mallick et al., 2021a). Heuristic-based techniques are very professional and produce reasonable accuracy (Mallick et al., 2021a). Evidence-based models such as statistical index (SI) (Pande et al., 2020), logistic regression (LR) (Chen et al., 2020; Ozdemir, 2011; Park et al., 2017), evidential belief function (EBF) (Mogaji et al., 2016; Nampak et al., 2014), probability-frequency ratio (FR) (Arshad et al., 2020; Razandi et al., 2015), certainty factors (CF) (Razandi et al., 2015; Ahmadi et al., 2020; Zhao and Chen, 2020), weight of evidence (WoE) (Das et al., 2021; Hembram et al., 2019), index of entropy (IoE) (Al-Abadi and Shahid, 2015; Rahmati et al., 2016) and certainty fact have been used to model groundwater potentiality. Focusing on current groundwater availability regions and related variables makes these methods objective and measurable. However, standard statistical techniques cannot anticipate the dynamic and non-linear interactions between groundwater and the conditioning factors (Mallick et al., 2021b). Since no one technique or methodology works for all situations, machine learning is considered.
Machine learning has been utilised to predict groundwater potentiality because it can analyse the dynamic relationship between groundwater potentiality and influencing factors (Mallick et al., 2021b). Several methods have been used to assess groundwater potentiality, including artificial neural networks (Lee et al., 2018; Pal et al., 2020), neuro-fuzzy (Termeh et al., 2019; Khosravi et al., 2018), decision trees (Duan et al., 2016; Choubin et al., 2020) and support vector machines (Lee et al., 2018; Naghibi et al., 2018). But until recently, groundwater experts couldn't agree on a model for evaluating groundwater potentiality (Mallick et al., 2021a). Thus, ensemble techniques have lately acquired favour in geohazard susceptibility and potentiality mapping (Mallick et al., 2021b).
Ensemble modelling combines two or more machine learning methods to improve forecast accuracy (Talukdar et al., 2020; Islam et al., 2021a, b). Ensemble modelling may improve an individual model's weaknesses (Talukdar et al., 2021a, b). Researching susceptibility, sensitivity, hazards, potentiality and other issues using multi-model ensembles is a newer trend (Talukdar and Pal, 2020; Mahato et al., 2021). For example, the present research utilised RF and RSS to enhance the model's robustness. The ensemble prediction technique has not been utilised for groundwater potential zone mapping in Bangladesh's northern Teesta sub-catchment.
2. Methods and materials
2.1 Study area
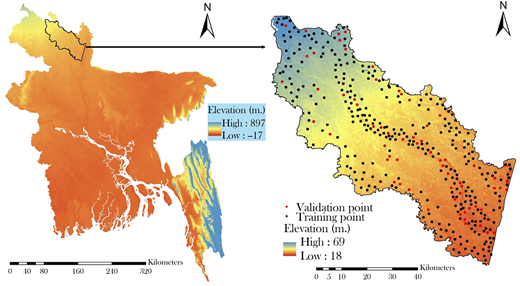
The Teesta sub-catchment, which covers 2284 km2 and includes five major districts in Bangladesh's northern region, namely Lalmanirhat, Kurigram, Rangpur, Nilphamary and Gaibandha, is the study's research area (Figure 1). This basin is located in Bangladesh between the latitudes of 25°30′02′′N and 26°18′37′′N and the longitudes of 88°52′58′′E and 89°45′34′′E. Bangladesh's largest geomorphic unit is the floodplain, and the drainage basin is made up of several minor rivers that run at elevations ranging from 5 to 110 metres. When floods occur, the river's general slope ranges from 0.47 to 0.55 m/km, suggesting a comparatively flat terrain (Rahman et al., 2011). Since the river basin's morphological depression is narrow and situated in a dormant stream canyon, the river basin's pathways are long and morphologically diverse. With a dense river network and six rivers, including the Naotora, Buri Teesta, Ghagot, Old Brahmaputra, Jamuna and Dharla, the research area has complex hydrological attributes.
The climate in this basin is sub-tropical monsoonal, with two distinct seasons: monsoon (June to September) and dry season (October to December) (October to May). The average annual precipitation in this basin is over 1900 mm (Akter et al., 2019), with over 80% of overall annual precipitation taking place during the monsoon season.
2.2 Materials
The groundwater potentiality (GWP) models for this study were prepared using 12 groundwater conditioning parametres. These are land use land cover (LULC), rainfall, distance to road, elevation, slope, topographic roughness index (TRI), stream power index (SPI), sediment transport index (STI), curvature, soil types, topographic wetness index (TWI), aspect. For LULC map, Landsat 8 Operational Land Imager (OLI) image from the United States Geological Survey's (USGS) website (Path/row: 138/42, spatial resolution: 30 m, date:19/03/2019) has been utilised. The advanced spaceborne thermal emission and reflection radiometer (ASTER) global digital elevation model (GDEM) (Version 2, spatial resolution: 30 metre) was utilised to extract topographical and hydrological variables. The rainfall data were given by the Bangladesh Meteorological Department (BMD), Dhaka, Bangladesh. We used a soil taxonomy map from the United States Department of Agriculture's Natural Resources Conservation Service (USDA) (NRCS).
2.3 Groundwater potentiality inventory
For GWP mapping, several researchers have utilised the positions of springs, wells and quant for inventory. Well points were taken into account for GWP in this study. The study region's inventory graph includes 220 well points collected from various resources and detailed site inspection. First, non-groundwater data similar to the groundwater data utilised for GWP modelling must be prepared. The selection was made on the basis of the field survey, with equivalent numbers of non-groundwater data (220 points). By arbitrary separation, all groundwater and non-groundwater data have been divided into 80 (352 points):20 (88 points) proportion as calibrating and test datasets (Figure 1). Model calibration is done with groundwater and non-groundwater training data, while model validation is done with groundwater and non-groundwater testing data (Mallick et al., 2021a). Similarly, inventory maps for other areas have been developed.
2.4 Methods for preparing groundwater potentiality conditioning factors
Since it requires multiple variables related to topography and hydrology in geospatial layout, the architecture of the spatial groundwater potentiality model is typically very complex and systematic. As a result, identifying variables that affect groundwater potentiality is critical, and scientifically selected criteria can confirm the accuracy of groundwater potentiality modelling charts. All the selected parametres were translated into 30 m spatial resolution using resampling technique.
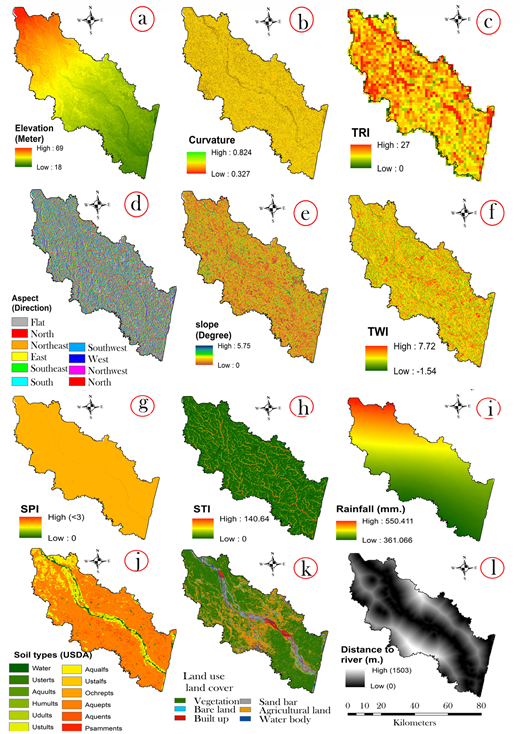
Topographic influences are critical for GWP modelling because they affect the hydrological characteristics of the research region both directly and indirectly (Panahi et al., 2020). At first, ASTER GDEM data was used to generate digital elevation model to extract slope, curvature, aspect, TWI, SPI, STI and TRI using ArcGIS 10.2 software (Figure 2).
Soil characteristics are one of the most important determining variables in the rainfall-runoff process (Nguyen et al., 2020). While Flügel (1995) reported that other factors such as local weather patterns and erosion processes influence rainfall-runoff generation, soil properties directly govern water penetration, which influences rainfall-runoff generation. Groundwater events are more likely to occur if the degree of penetration is high. The study area has 12 groups of soil as per USDA soil taxonomy (Figure 2j).
LULC has an effect on surface runoff including a significant impact on the occurrence of groundwater potentiality (Prasad et al., 2020), since the LULC has full control over the generation and penetration of surface runoff. Groundwater potentiality is very less in built-up areas because these zones prevent water from penetrating and producing surface water. In comparison, the woodland region encourages water to infiltrate, resulting in less groundwater potentiality (Mallick et al., 2021a). When comparing hydrological reactions at different temporal scales, the relationship between groundwater potentiality occurrences and plant density is inverse (Tolche, 2021). The artificial neural network (ANW) model was used in Environment for Visualizing Images (ENVI) software (version 5.3) to create a LULC map. Bare ground, forest, sand bar, built-up field, agricultural land and water body were divided into six groups on the LULC map (Figure 2).
2.5 Method for groundwater potentiality modelling
2.5.1 Random forest
RF is a classification and regression approach that uses an ensemble of binary decision trees that have been trained individually (Golkarian et al., 2018). The basic strategy employed by RF for classification issues is to train each decision tree individually with the ultimate conclusion calculated by taking into consideration the findings acquired by each decision tree (Sameen et al., 2019).
Without needing to go through a pruning procedure, RF models can generalise and reduce the danger of overfitting. The training entails producing a number of distinct bootstrap samples from the original dataset, with one-third left out to function as test cases and estimating an unbiased test error, referred to as the out-of-bag-error, which reflects the RF model's prediction performance based on these test cases (Breiman, 2001).
2.5.2 Random subspace
RSS was proposed in 1988 as a way to improve the accuracy of weak classifications and the performance of individual classifications. RSS (Ho, 1998; Skurichina and Duin, 2002) is a popular method of random sampling in which the original character varies at random. RSS groups the characteristic series of each sub-classification creation using a majority vote after creating numerous subspaces with tiny dimensions (Skurichina and Duin, 2002; Kuncheva and Plumpton, 2010). RSS has been utilised in a variety of disciplines, including economics (Wang and Ma, 2011) and medical (Bertoni et al., 2005) but very seldom in groundwater potential assessment. The optimization of model's parameters has been presented in Table 1.
2.6 Validation of the models
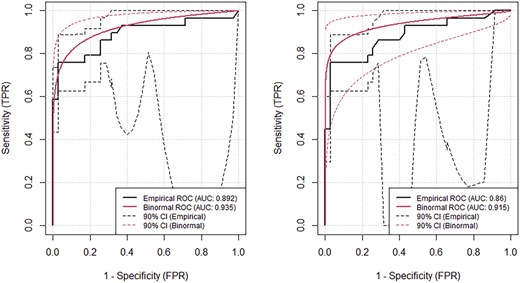
In the ROC, on the horizontal axis (true positive or 1-specificity), the proportion of pixels properly predicted by the presence or absence of groundwater potential is shown, while the proportion of pixels erroneously predicted is represented on the vertical axis (false positive or sensitivity) (Mallick et al., 2021a). The AUC is the area beneath this curve, and the model with the greatest AUC has the best relative performance (Talukdar et al., 2021a, b). Random prediction for a model is shown by AUC values of 0.5 (Talukdar et al., 2021a). The AUC values vary from 0 to 1, with 0 being the lowest and 1 being the highest. AUC values those are greater than 0.7 reflect a model's prediction effectiveness (Nguyen et al., 2020).
3. Results
3.1 Description of the parametres
Several conditioning variables can impact a region's groundwater potentiality (Mukherjee et al., 2021). In this study, the affecting parametres were LULC, distance to river, height, slope, topographic wetness index, stream power index, sediment transport index, curvature, topographic roughness index, curvature and aspect. Low-lying regions, particularly depressed lands in the flood plain region, maintain a high degree of surface moisture and replenish the groundwater aquifer as a result of persistent ponding. The altitudes of the research area varied from 18 to 69 metres (Figure 2). The capacity for recharging water is greatest when the curvature is a concave surface, followed by plain surfaces (Nguyen et al., 2020). Curvature map, which was produced by using the digital elevation model (DEM) ranged from 0.32–0.82 (Figure 2a). The DEM was used to build a curvature map that ranged from 0.32–0.82 (Figure 2b). Also, a flat or moderate slope will help to slow down the flow of water and increase the groundwater recharge (Kumar et al., 2019). In this study, the slopes utilised varied from 0 to 5.75 (Figure 2d). TRI examined the impact of the underlying surface's conflict on the water flow (Straatsma and Baptist, 2008). The Teesta river was located at the lowest TRI due to the steep hills around the river, generating fast water flow. Lower TRI values imply a larger possibility for groundwater (Chen et al., 2020).
In this analysis, the highest TRI value was 27 (Figure 2). A high TWI also ensures adequate groundwater recharge. The high TWI values are strongly correlated with groundwater potentiality. Figure 3 shows TWI values ranging from −1.54 to −7.72. Furthermore, since higher SPI and STI values mean a higher water level, regions with higher SPI and STI values have a greater chance of experiencing groundwater (Bui et al., 2019). The highest STI value in this study was 140.64 (See Figure 2). LULC is important in modelling groundwater potential zone. Maps showing vegetated land turning to become barren land result in increased runoff, lower infiltration and thereby directly impacting the groundwater (Pal et al., 2020). LULC was divided into six groups in this study, including vegetation, bare land, built up, sand bar, agricultural land and water body (Figure 2). In this place, the greatest distance from the river was 1503 metres, as seen in Figure 2. Soil data played an important role in accounting for excess precipitation and infiltration (Johnson et al., 2000). Water, usterts, aquults, humults, udults, ustults, aqualfs, ustalfs, ochrepts, aquepts, aquents and psamments were amongst the 12 soil types discovered in this study (Figure 2). The sum of rainfall has a major impact in determining the potentiality of groundwater in an area, as the distribution of rainfall strongly controls the recharge volume of a basin (Figure 2).
3.2 Groundwater potentiality modelling and validation
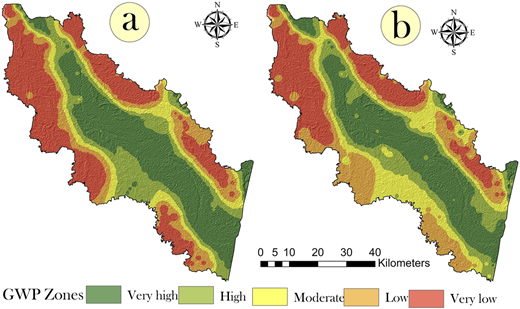
Figure 3, represents the groundwater potentiality models as constructed using advance machine learning algorithms, such as, RF and RSS. As shown in Figure 3, the potential zones of groundwater were divided into five categories: very high, high, moderate, low and very low. The potential groundwater zone runs in a northwest–southeast direction, parallel to the drainage direction of the catchment. The south and southeast are dominated by zones with high groundwater potential, whereas the north northwest is dominated by areas with low groundwater potential zones.
About 2.26 and 36.69% areas to the total basin area are found to have “very high” and “high” potentiality for groundwater, respectively, in case of RSS model (Table 2). While the RF models identified around 30% of the overall basin area as high potential for groundwater. In general, all of the models defined the river catchment area as having a lot of potential for underground water harvesting. However, since there are variations in the size of the region, it is critical to explain the best representative model.
Two different models were used to integrate and define groundwater potential zones in this study. The region ROC curve is used to show how accurate the model is (AUC). The AUC and considerable level of the ROC curve were used to test the evaluation of these models. The AUC calculated using ROC specifically specified the acceptability of all models, as it was greater than 0.8 in all cases (Figure 4). The AUC indicates how accurate the model's output can be forecasted. The greater the AUC, the more accurate the model's output can be predicted. The findings of these four human models were statistically important in this study (significant level, 0.5). The RSS (0.89), RepTree (0.898) and M5P (0.89) models had the best results in the test.
4. Discussions
Since machine learning approaches demonstrate potential when working with a variety of geographic data, machine learning modelling of environmental problems has grown in popularity (Panahi et al., 2020; Prasad et al., 2020). As a result, machine learning modelling can successfully address the problem of identifying groundwater potential zones over large-scale regions, which frequently lack reliable and long-term geotechnical and hydrogeological data for the application of physically-based and/or numerical models (Pal et al., 2020; Mallick et al., 2021a; Sameen et al., 2019). Nevertheless, the versatility of various machine learning methods must be thoroughly explored through their implementation in various regions with various geo-environmental settings in order to identify the best model with the highest precision and the least sensitivity to noisy input data (Choubin et al., 2019; Naghibi et al., 2018).
Robust techniques for obtaining very accurate results may be used to propose long-term groundwater management. The goal of this study is to create an EML approach for groundwater potential mapping in Bangladesh's Teesta river basin. RF and RSS models were used to integrate 14 groundwater condition factors with groundwater inventory for GPM production. Based on the ROC AUC, the RSS model (AUC-0.892) outperformed the RF model (AUC). According to the RSS model, about 1024 and 546 km2 of the overall basin area have “very high” and “high” groundwater potentiality, respectively.
Although the research has mostly focussed on the usefulness of ensemble approaches, these techniques have demonstrated varying levels of success for various issues in various fields. For example, Nguyen et al. (2020) found that RSS outperformed bagging and dagging approaches for predicting groundwater potentiality, whereas Mallick et al. (2021a) found that the RSS model outperformed rotation forest and bagging for predicting groundwater potential. Using ensemble models to forecast floods, different outcomes have been reported (Mahato et al., 2021; Saha et al., 2021).
5. Conclusion
The current research delves into the evolution of EML algorithms for estimating groundwater potentiality. According to the two ensemble models, the very high groundwater potential zone spans an area of 830–21200 km2. The ROC curve was used to assess the groundwater potential models. The best representation model for groundwater potentiality modelling was RSS (AUC = 0.892), followed by RF (AUC: 0.86). Distance to river, slope, curvature, elevation, LULC and SPI can be considered as the most dominant and sensitive parametres for groundwater potentiality modelling. Groundwater depletion threatens the survival of natural surface water bodies, agriculture, natural resources and livelihood.
In the case of groundwater potentiality models, RSS model outperformed RF model. This research further proposes that a few other hydrogeological and meteorological variables can be added to the models to increase the accuracy of the outcome. Owing to damming across the river and other anthropogenic problems, the Teesta river basin is notorious for its water shortage. Such findings could aid in the development of long-term water harvesting and cropping strategies. Rapid reclamation of water sources should be stopped at all times, as water bodies have been identified as a good conditioning factor for groundwater potentiality. Land cover and canopy density are also high conditioning influences, according to this report. However, forest loss and destruction are undeniable facts. As a result, forest cover preservation will aid groundwater recharge. Study is needed for scientific assessment of groundwater at various potential zones in order to get a more precise recommendation on how much water can be harvested from each potential zone.
Data availability: The data that support the findings of this study are available from the corresponding author, [swapantalukdar65@gmail.com], upon reasonable request.