


While green buildings are lauded for their resource efficiency and economic benefits, the absence of practical evidence impedes their widespread adoption in developing regions. This study presents an economic evaluation of green buildings’ performance using energy and water consumption data. The underlying motive is to shed light on the uncertainties surrounding the benefits of adopting green buildings.
This study adopted the quantitative approach by presenting the actual performance of green building energy and water usage. Moreover, the study employed the life cycle costing strategy to forecast cost savings.
The study demonstrated that green buildings have the potential to achieve significant energy savings ranging from 8 to 57% annually. The finding underscores green buildings’ resource efficiency and points to their positive economic impact. The study also reveals that green buildings can lead to substantial energy and water cost savings in the shorter and longer terms. Nevertheless, green certification alone does not guarantee energy savings.
Limited information exists regarding the economic advantages of green buildings in developing economies. This study addressed the prevailing research knowledge gap. The study provides data depicting the previous/historical, current and future performance of green buildings in a developing region.
1. Introduction
Spoken in aggregate terms, considerable efforts have been made to address the impacts of buildings on the environment. Confirming the claim, the adoption of the UN Sustainable Development Goals (UN SDGs), which aim to address environmental, social, and economic development concerns such as health, climate change, water, environment, energy, and social justice, reflect some of the initiatives that have been made to mitigate the impacts of rising building stock and resource consumption (UN, 2015; UN DESA, 2022). The UN SDGs have stirred up the sustainability movement in the building and construction sectors (UNEP, 2022). That is significantly more so in developing economies, where resource efficiency and sustainability practices in building construction and operation are primarily disregarded, and their environmental impact is quite pronounced (Anzagira et al., 2022).
The building and construction industry is one of the largest consumers of natural resources and emitters of greenhouse gases (with approximately over 40% and 20% of total energy and water consumption and 36% of greenhouse gas emissions, respectively) (IEA, 2019; UNEP, 2022). On that basis, it is placed at the forefront of other production and manufacturing industries to embrace sustainability (UNEP, 2022). This position was attained by adopting sustainable construction practices (Goh et al., 2020; Oke et al., 2019). Green building adoption is one of the key sustainability movements in the building construction sector. Green building adoption involves designing, constructing, and operating buildings in an environmentally responsible and resource-efficient manner to reduce their impact on the natural environment throughout their life cycle (Kibert, 2004; Yudelson and Fedrizzi, 2008).
Many countries have issued and adopted green building evaluation standards to promote green building development. These standards include Green Star SA in South Africa, Green Mark BCA in Singapore, and LEED in the United States. The standards aim to evaluate the sustainability levels of buildings and their social, environmental, and economic impacts on the environment and occupants (Agbajor and Mewomo, 2022). Nonetheless, green building adoption has been lagging, especially in developing economies. The absence of proof of their economic value and benefits is a primary obstacle to their widespread adoption (Darko and Chan, 2017). Studies have demonstrated that the commissioning costs of green buildings tend to be higher than those of conventional buildings because of the cost premium associated with their sustainability features (Dwaikat and Ali, 2016; Zhang et al., 2018). As a result, prospective adopters lack the confidence to pursue green building investments without empirical evidence of trade-offs between initial costs and future savings. Proof of economic benefits (such as energy and water savings) and reduced life cycle costs are found in the economic evaluation and life cycle cost information (Zuo and Zhao, 2014).
There are contradictions in the energy performance of green buildings. While Dwaikat and Ali (2018) and Miraj et al. (2021) indicated that green buildings save over 30% of energy usage, Wong et al. (2019) and Lin et al. (2016) reported that there were no significant differences in energy efficiency between green and non-green buildings. Moreover, opinions on the economic benefits of green buildings vary. Scofield (2009, 2013) and Menassa et al. (2012) claimed that green buildings do not necessarily present long-term savings. Conversely, Tjenggoro and Prasetyo (2018), Alsulaili et al. (2020) and Weerasinghe and Ramachandra (2020) noted that the long-term economic savings of green buildings can be elaborated using different case studies. Inferring from these contradictions, the current study was founded on the premise that more robust findings are imminently required to explore and consequently recommend the benefits of green buildings. That deliberation could lead to enhancing green building uptake.
Therefore, the study intends to contribute to the daunting debate about whether green building adoption has significant economic benefits that can adequately offset their costs. Moreover, the study sought to transcend the prevailing gap between the theory and practice of green building adoption. The study aimed to attain two specific objectives: First, to evaluate the economic benefits of adopting a green building through analyses of actual green building performance in terms of water and energy savings; Second, to examine the life cycle costs incurred during the operations of green buildings.
2. Benefits of green building adoption
Given that resource efficiency is a critical component of green buildings, their primary benefits include cost savings through reduced energy and water consumption, lower operation and maintenance costs, and improved indoor environmental quality (Darko et al., 2017). The recent findings by Miraj et al. (2021) affirm that green buildings require an additional cost of 9.22% but offer over 50% of energy and water savings over the building’s life cycle. In addition, the study noted that green building adoption reduced cost per area by approximately 40% compared to traditional buildings (Miraj et al., 2021). Similarly, Plebankiewicz et al. (2019) reported that green building adoption allowed for higher rental and lower operating costs by approximately 8% in energy usage. Alves et al. (2018) found that energy-focused retrofits for attaining a green building certification could yield up to 28% energy savings. Earlier studies have also found that green building adoption has great potential for reducing energy costs in a building’s life cycle. For instance, Ries et al. (2006) noted an energy usage decrease of approximately 30% in a building area when comparing conventional and green building shifts. Lau et al. (2009) established that energy savings for cooling (62%), lighting (18%) and equipment (20%) of a green building allowed for approximately eight years of pay-off.
However, studies (Geng et al., 2019; Gou et al., 2013; Su et al., 2022) have also noted that green buildings do not necessarily provide long-term energy and water savings. A study by Wong et al. (2019) revealed that buildings with energy-saving design considerations and climate-responsive design elements (window-to-wall ratio, reduced glass façade) performed better than certified buildings. In addition, large-scale analyses of green and non-green buildings have revealed no significant differences in indoor environmental quality, energy efficiency, water conservation, or occupant satisfaction (Gou et al., 2013; Nkini et al., 2022). In light of these findings, it is essential to continue advancing research on green building adoption by empirically appraising its economic benefits. The supplementary file provides a comparative review of green building rating tools and extended literature. A detailed account of the literature search steps, including databases, keywords, and inclusion/exclusion criteria, is provided in the supplementary file.
3. Research methods
3.1 Choice of research design
This study adopted a case study research design to present the economic benefits of adopting green buildings by investigating their actual and future water and energy cost performance. Case studies are preferable to other research methods because they provide a more in-depth examination of real-world contexts (Yin, 2018). This investigation processed the actual utility records available from both the building records and utility authorities to obtain factual information about the performance of green buildings. Mushi et al. (2023) adopted a case study design to explore the factors attributable to green building adoption. This study furthers the research by using similar case studies to explore the economic benefits of adopting energy- and water-efficient principles in certified green buildings.
3.2 Case buildings selection
The case buildings in this study were three green-certified office buildings located in Tanzania. These case buildings were purposively selected because they demonstrated initiatives in Tanzania to enhance sustainable building designs, construction, and operation principles (Mushi et al., 2023). The case buildings included in this study were certified using internationally recognized green building certification systems (Mushi et al., 2023). Table 1 provides information about the green building cases in the study.
Description of green building cases
| Case ID | I | II | IV |
|---|---|---|---|
| Current function | Office (banking, restaurant and offices) | Office (banking) | Office (government) |
| Certification date | 2016 | 2020 | 2015 |
| Approximated floor area (m2) | 6,141 | 1,394 | 13,810 |
| Type of certification | LEED BD + C: Core and Shell (v2009) | LEED ID + C: Commercial Interiors (v2009) | New Construction |
| Certification level | Gold | Certified | Certified |
| Certifying organization | LEED | LEED | BCA Green Mark Singapore |
| Ownership | Private | Private | Public |
| Energy saving features score | 25/37 | 18/37 | 7/10 |
| Water saving features score | 8/11 | 8/11 | 8/10 |
| Key green features | Enhanced energy efficiency and renewable energy generated on-site | Water-saving design, energy efficiency and reusing and recycling furniture | Energy-efficient lighting, solar photovoltaic panels, and water-efficient appliances |
| Approximate number of users | Between 100 and 300 | Between 100 and 200 | Between 200 and 400 |
| Nature of the building envelope | Glass curtain wall | Glass curtain wall | Reinforced concrete and blockwork |
| Nature of the building fenestration | Double glazed windows | Low E glass windows | Low E glass windows |
| Solar shading | Trees and artificial shading | No shading | Minimized glazing |
| Reference | USGBC (2016) | USGBC (2020) | BCA Green Mark (2016) |
Note(s): Abbreviations: LEED BD + C: Leadership in Energy and Environmental Design (LEED) for Building Design and Construction. LEED ID + C: Leadership in Energy and Environmental Design (LEED) for Interior Design and Construction
Source(s): Authors’ own work
3.3 Data collection
The buildings’ historical performance data were obtained from the records maintained by the facility managers’ offices and from the utility-supplying companies. In Tanzania, electricity and water services and tariffs are regulated by the Energy and Water Utilities Regulatory Authority (EWURA). Water is also supplied by the Dar es Salaam Water Supply and Sanitation Authority (DAWASA), while electricity is supplied by Tanzania Electric Supply Company Limited (TANESCO). The dataset in this study comprised the performance data of the buildings from the date of certification until 2023.
3.3.1 Energy costs
In order to calculate energy costs, two types of energy data were collected: annual energy consumption (yearly kilowatt hour (kWh)) and annual electricity tariff (US$/kWh). Electricity rates were obtained from the TANESCO records. Specifically, buildings in this study are categorized in the low voltage general use (T2) group since pricing is based on the type of building and consumption per month. Detailed categorization is provided in the supplementary file.
3.3.2 Water costs
The water cost of the buildings was calculated by combining two types of data: the total water usage (annual cubic meter (m3)) and the annual water tariff (US$/m3). The water and energy prices were obtained in Tanzania’s local currency and subsequently computed in terms of the United States dollars. The exchange rates were obtained from the Bank of Tanzania’s database. Unlike the electricity tariffs, the water usage tariffs for domestic, institutional, commercial, and industrial are charged at the same rate (EWURA, 2023).
3.4 Data analysis
3.4.1 Estimating energy and water saving benefits
The standard procedure for determining the actual energy and water savings in buildings is to compare them with the industry baseline (benchmarks) and the existing national resource efficiency standards or code of practices, respectively. Unfortunately, there are no published data on the industry baseline for energy and water usage in buildings in Tanzania. Moreover, there are no standards or codes of practice for the efficient use of energy and water in buildings. Nkini et al. (2023) established that the average baseline value for office buildings was 153 kWh/m2/year, represented as energy use intensity (EUI). The EUI is expressed as kWh/m2/year and is computed by dividing a building’s annual energy consumption by its gross floor area in square meters.
Table 2 illustrates the average EUI from different studies and the average EUI adopted in this study. This study first established the actual energy performance of the buildings during each building’s operating year from the certification date. Then, the actual energy performance was compared to the adopted baseline at each elapsed year.
Comparison of energy use intensity in tropic zones
| Country | Average EUI (kWh/m2/y) | Number of buildings | Reference |
|---|---|---|---|
| Tanzania | 154 | 17 | Nkini et al. (2023) |
| Singapore | 250 | 300 | BCA (2023) |
| Brazil | 135 | 72 | Wong et al. (2019) |
| Singapore | 200 | 56 | Deb and Lee (2018) |
| Singapore | 232 | 99 | Ma et al. (2017) |
| China (Hong Kong) | 236 | 30 | Jing et al. (2017) |
| Malaysia | 135 | 68 | Saidur (2009) |
| Malaysia | 155 | Not specified | Shaikh et al. (2017) |
| Others in tropic zones | 150 | Less than five (5) | Miraj et al. (2021), Dwaikat and Ali (2018), Li et al. (2020) and Duarte et al. (2018) and Zaid et al. (2017) |
| Average | 183 | ||
| Median | 155 |
Source(s): Authors’ own work
In order to estimate the energy-saving benefits (quantities) of the buildings, the comparative energy consumption based on the established baselines was calculated based on the buildings’ gross floor areas. The building’s baseline energy use index (BEI) was determined by multiplying the baseline energy use intensity by the floor area of the building. Then, the following steps were taken to conduct the performance analysis of the current building’s energy consumption and cost: Firstly, at each year’s average energy tariff, the baseline yearly energy costs were calculated by multiplying the baseline annual energy consumption by the year’s applied energy tariff. Secondly, the actual energy costs of the buildings were computed using the actual annual energy consumption and the applicable energy tariff for each year.
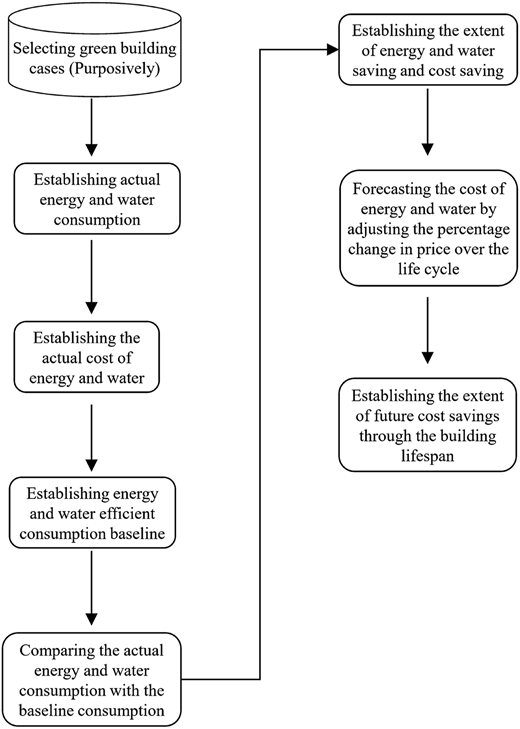
The elapsed water cost was calculated and compared to the existing baseline recommendations for office buildings to establish the cost of water usage and the extent of savings. Since there are currently no baseline records or benchmarks for water usage in office buildings in Tanzania, this study utilized references from previous studies. The unit of measurement for benchmarking water use in office buildings is water consumption per floor-plan area, expressed as water per square meter per year (m3/m2/year). The previous studies’ consensus has established 1.3 m3/m2/year as the average baseline for water consumption in office buildings (Mohd Zaini et al., 2021; Silva et al., 2021). In order to estimate the water savings benefits (quantities and costs), the comparative water consumption based on the baseline was calculated using the gross floor areas of the buildings. The baseline yearly water consumption for the buildings was calculated by multiplying the baseline water consumption by the floor area of each building. Then, the baseline water costs based on the average annual water tariff were established using the yearly water consumption and the applicable water tariff for each year. Figure 1 illustrates the methodological steps of this study.
3.4.2 Energy and water saving throughout the life cycle of buildings
This study determined the building’s future energy and water savings by incorporating the inflation factor into the building’s current performance compared to the baseline. The price change records were derived from the EWURA annual reports (EWURA, 2021, 2023). Furthermore, the building life cycle or lifespan was established based on the consensus of the existing research and industry standards. Studies conducted by Li et al. (2020), Miraj et al. (2021), Islam et al. (2015), and Dwaikat and Ali (2018) established that the average concrete office building lifespan is 25, 30, 50 and 60 years, respectively. The buildings in this study are assumed to have a 40-year lifespan. Considering the current building performance, the present study established the baseline life cycle energy and water costs at different utilities’ prices using the following equation (1):
Where:
FC: Future cost
PC: Present or current cost in the base year
i: Inflation rate or expected percentage of annual cost increase (increase in tariffs)
n: Number of years between the base date and the occurrence of the cost
4. Results and discussion
4.1 Estimating energy and water saving benefits
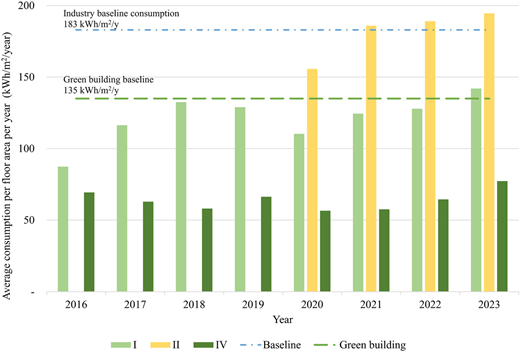
The findings show that energy consumption for the elapsed time for the buildings is below the average industry baseline for office buildings in tropical regions (Figure 2). Figure 2 shows that only buildings I and II performed below the reported green buildings’ building energy index (BEI) baseline. Findings also show that for the elapsed time, the BEIs are 121 kWh/m2/y, 181 kWh/m2/y, and 64 kWh/m2/y for buildings I, II and IV, respectively. Thus, for the elapsed time, BEI for the building I is 6%, while building IV is 53% below the baseline green building energy use index. Although the average BEI for building II is 34% above the baseline green office building BEI, its BEI in the first year after certification is only 15% (155 kWh/m2/y) above the average green building BEI. Compared to the industry baseline BEI for office buildings (green and non-green buildings), the BEI for buildings I, II and IV are 34%, 1%, and 65% below the average industry baseline. Therefore, the energy performance of the building is above the reported performance of the office buildings in the tropic zones. These findings are consistent with previous research (BCA, 2023; Dwaikat and Ali, 2018).
Comparison of buildings’ actual energy consumption to the reported baselines. Source: Authors’ own work
Comparison of buildings’ actual energy consumption to the reported baselines. Source: Authors’ own work
The comparison of the actual energy-saving and cost-saving in buildings is illustrated in Table 3. To present the actual energy savings, the actual energy consumption of the buildings is compared to the BEI of the baseline using the buildings’ floor areas. Table 3 shows that a hypothetical green building energy consumption data (kWh/y) was formulated using the reported baseline BEI for green buildings, i.e. 135 kWh/m2/y multiplied by the floor area of individual buildings. For instance, to develop the energy consumption data for building I based on the green building baseline, the baseline BEI (kWh/m2/y) is multiplied by building I’s floor area (m2).
Comparison of energy consumption and cost saving of buildings with green building baseline
| Building ID | Year | Baseline energy consumption (kWh/y) (a) | Actual energy consumption (kWh/y) (b) | Actual energy saving (kWh/y) c (a-b) | Price of energy ($/kWh) (d) | Actual cost saving ($) e (c x d) | Percentage of energy saving f (c/a) |
|---|---|---|---|---|---|---|---|
| I | 2016 | 829,035 | 536,222 | 292,813 | 0.091 | 26,646 | 35% |
| 2017 | 829,035 | 714,099 | 114,936 | 0.082 | 9,425 | 14% | |
| 2018 | 829,035 | 813,332 | 15,703 | 0.079 | 1,241 | 2% | |
| 2019 | 829,035 | 792,096 | 36,939 | 0.079 | 2,918 | 4% | |
| 2020 | 829,035 | 677,434 | 151,601 | 0.079 | 11,976 | 18% | |
| 2021 | 829,035 | 763,990 | 65,045 | 0.079 | 5,139 | 8% | |
| 2022 | 829,035 | 785,003 | 44,032 | 0.084 | 3,699 | 5% | |
| 2023 | 829,035 | 871,725 | −42,690 | 0.088 | −3,757 | −5% | |
| Total | 6,632,280 | 5,953,901 | 678,379 | 57,286 | |||
| Annual average | 829,035 | 744,238 | 84,797 | 7,161 | 10% | ||
| II | 2020 | 188,190 | 217,003 | −28,813 | 0.079 | −2,276 | −15% |
| 2021 | 188,190 | 259,100 | −70,910 | 0.079 | −5,602 | −38% | |
| 2022 | 188,190 | 263,551 | −75,361 | 0.084 | −6,330 | −40% | |
| 2023 | 188,190 | 271,131 | −82,941 | 0.088 | −7,299 | −44% | |
| Total | 752,760 | 1,010,785 | −258,025 | −21,507 | |||
| Annual average | 188,190 | 252,696 | −64,506 | −5,377 | −34% | ||
| IV | 2016 | 1,864,350 | 957,760 | 906,590 | 0.091 | 82,500 | 49% |
| 2017 | 1,864,350 | 868,370 | 995,980 | 0.082 | 81,670 | 53% | |
| 2018 | 1,864,350 | 801,900 | 1,062,450 | 0.079 | 83,934 | 57% | |
| 2019 | 1,864,350 | 915,180 | 949,170 | 0.079 | 74,984 | 51% | |
| 2020 | 1,864,350 | 780,620 | 1,083,730 | 0.079 | 85,615 | 58% | |
| 2021 | 1,864,350 | 794,180 | 1,070,170 | 0.079 | 84,543 | 57% | |
| 2022 | 1,864,350 | 890,330 | 974,020 | 0.084 | 81,818 | 52% | |
| 2023 | 1,864,350 | 1,066,803 | 797,547 | 0.088 | 70,184 | 43% | |
| Total | 14,914,800 | 7,075,143 | 7,839,657 | 645,248 | |||
| Annual average | 1,864,350 | 884,393 | 979,957 | 80,656 | 53% |
Source(s): Authors’ own work
Findings in Table 3 show that, with respect to the green office building baseline, the average annual energy consumption is 829,035 kWh/y, 188,190 kWh/y, and 1,864,350 kWh/y for building I, II, and IV, respectively, while the actual annual average energy consumption is 744,237 kWh/y, 252,696 kWh/y and 884,392 kWh/y for building I, II, and IV, respectively. Comparing the baseline and actual consumption, the average energy savings are 84,797 kWh/y and 979,957 kWh/y for building I and IV, respectively, for the elapsed time. Moreover, the average cost savings are $7,160 and $80,656 for buildings I and IV, respectively, corresponding to 10% and 53% average savings for buildings I and IV, respectively, for the elapsed time. Although the performance of building II is below the industry baseline, its magnitude is higher when compared to that of the green building baseline. As a result, energy and cost savings for building II are only realized at the industry baseline comparison. Table 3 shows that the maximum recorded BEI for the buildings is 194 kWh/m2/y, the minimum is 56 kWh/m2/y, and the average is 122 kWh/m2/y. Thus, the average BEI is below the reported industry and green building baselines. These findings signify that the green buildings in this study performed fairly below the BEI industry baseline for office buildings. These findings correspond with those documented in earlier research by Nkini et al., (2023) and Zaid et al. (2017).
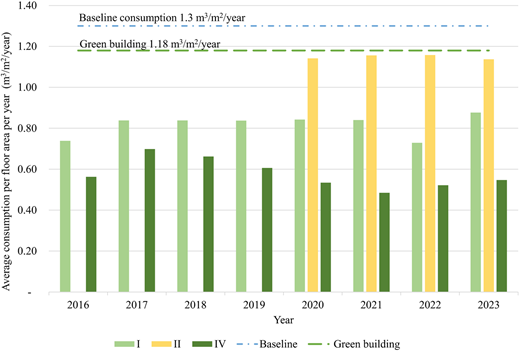
To establish the extent of water consumption and saving throughout the elapsed time, actual utility bills were obtained and compared between the buildings. The buildings’ water efficiency index (WEI) was further compared to the reported baseline for office buildings and green office buildings. Findings show that the WEI is 0.82 m3/m2/y, 1.15 m3/m2/y and 0.58 m3/m2/y for buildings I, II and IV, respectively (Figure 3), which corresponds to 37%, 12%, and 56% below the reported baseline of office buildings for building I, II and IV, respectively. Moreover, the WEI for the building is 31%, 3% and 51% below the reported baseline for green office buildings for buildings I, II and IV, respectively. Thus, unlike the BEI, the WEI for all buildings is below the reported baseline for office buildings and green office buildings.
Comparison of buildings’ actual water consumption to the reported baseline. Source: Authors’ own work
Comparison of buildings’ actual water consumption to the reported baseline. Source: Authors’ own work
The comparison of the actual water-saving and cost-saving in buildings is illustrated in Table 4. To present the actual water savings, the actual water consumption of the buildings is compared to the WEI of the baseline using the buildings’ floor areas. Table 4 shows that a hypothetical green building water consumption data (m3/y) was formulated using the reported baseline WEI for green office buildings, i.e. 1.18 m3/m2/y multiplied by the floor area of individual buildings. With reference to the green office building baseline, the average annual water consumption is 7,983 m3/y, 1,812 m3/y, and 17,953 m3/y for buildings I, II, and IV, respectively. The annual average water consumption is 5,019 m3/y, 1,600 m3/y and 7,965 m3/y for building I, II, and IV, respectively. Comparing the baseline and actual water consumption, the average water savings are 2,963 m3/y, 211 m3/y and 9,987 m3/y for building I, II and IV, respectively. Moreover, the average cost savings are $2,175, $151 and $7,306 for buildings I, II and IV, respectively, corresponding to 37%, 12% and 56% savings for buildings I, II and IV, respectively. Prior research (Bint et al., 2013; Mohd Zaini et al., 2021) has also shown that green buildings have exhibited higher rates of water conservation.
Comparison of water saving and water cost saving
| Building ID | Year | Baseline water consumption (kWh/y) (a) | Actual water consumption (kWh/y) (b) | Actual water saving (kWh/y) c (a-b) | Price of water ($/kWh) (d) | Actual cost saving ($) e (c x d) | Percentage of water saving f (c/a) |
|---|---|---|---|---|---|---|---|
| I | 2016 | 7,983 | 4,534 | 3,449 | 0.77 | 2,667 | 43% |
| 2017 | 7,983 | 5,147 | 2,836 | 0.75 | 2,136 | 36% | |
| 2018 | 7,983 | 5,148 | 2,835 | 0.74 | 2,088 | 36% | |
| 2019 | 7,983 | 5,141 | 2,842 | 0.73 | 2,087 | 36% | |
| 2020 | 7,983 | 5,172 | 2,811 | 0.73 | 2,054 | 35% | |
| 2021 | 7,983 | 5,159 | 2,824 | 0.73 | 2,065 | 35% | |
| 2022 | 7,983 | 4,476 | 3,507 | 0.73 | 2,557 | 44% | |
| 2023 | 7,983 | 5,382 | 2,601 | 0.67 | 1,747 | 33% | |
| Total | 63,866 | 40,159 | 23,707 | 17,400 | |||
| Annual average | 7,983 | 5,020 | 2,963 | 2,175 | 37% | ||
| II | 2020 | 1,812 | 1,591 | 221 | 0.73 | 162 | 12% |
| 2021 | 1,812 | 1,611 | 201 | 0.73 | 147 | 11% | |
| 2022 | 1,812 | 1,614 | 198 | 0.73 | 145 | 11% | |
| 2023 | 1,812 | 1,585 | 227 | 0.67 | 153 | 13% | |
| Total | 7,249 | 6,401 | 848 | 606 | |||
| Annual average | 1,812 | 1,600 | 212 | 151 | 12% | ||
| IV | 2016 | 17,953 | 7,767 | 10,186 | 0.77 | 7,875 | 57% |
| 2017 | 17,953 | 9,643 | 8,310 | 0.75 | 6,259 | 46% | |
| 2018 | 17,953 | 9,137 | 8,816 | 0.74 | 6,491 | 49% | |
| 2019 | 17,953 | 8,366 | 9,587 | 0.73 | 7,038 | 53% | |
| 2020 | 17,953 | 7,373 | 10,580 | 0.73 | 7,731 | 59% | |
| 2021 | 17,953 | 6,691 | 11,262 | 0.73 | 8,233 | 63% | |
| 2022 | 17,953 | 7,199 | 10,754 | 0.73 | 7,841 | 60% | |
| 2023 | 17,953 | 7,551 | 10,402 | 0.67 | 6,985 | 58% | |
| Total | 143,624 | 63,727 | 79,897 | 58,453 | |||
| Annual average | 17,953 | 7,966 | 9,987 | 7,307 | 56% |
Source(s): Authors’ own work
4.2 Life cycle energy and water cost saving compared to the industry baseline
The current analysis of the building performance shows a significant energy cost saving in buildings I and IV compared to building II. As a result, this study’s life cycle cost-saving analyses for energy and water efficiency are only focused on buildings I and IV.
The historical data on utility prices show that the pattern of change in water and energy prices is relatively low in Tanzania compared to the general inflation rate. Moreover, these prices are generally regulated by the government. For example, the results indicate that the price of water per cubic meter has remained constant from 2016 to 2022 (EWURA, 2017, 2022). Currently, the price for the category of buildings in this study is $0.09 per kWh (EWURA, 2023). Table 5 illustrates the percentage change in price and the trend of percentage change in electricity price in six years. For forecasting future cost savings, this study adopted a 2.5% energy price change throughout the life cycle of the building (Table 5). Moreover, the study adopted a 1% increase in water prices over the life cycle of the buildings. Using equation (1), the energy and water consumption life cycle costs were projected, as illustrated in Tables 6 and 7.
Trend of energy price changes
| Year | Price ($/mWh) | Price ($/kWh) | Percentage price increase | Trend of percentage price increase between the years | Notes on the trend of price change between years |
|---|---|---|---|---|---|
| 2016 | 90.69 | 0.091 | |||
| 2017 | 81.55 | 0.082 | −10.08% | ||
| 2018 | 79.28 | 0.079 | −2.78% | 7.29% | 2017 and 2018 |
| 2019 | 79.24 | 0.079 | −0.05% | 2.73% | 2018 and 2019 |
| 2020 | 78.59 | 0.079 | −0.82% | −0.77% | 2019 and 2020 |
| 2021 | 78.76 | 0.079 | 0.22% | 1.04% | 2020 and 2021 |
| 2022 | 84.34 | 0.084 | 7.08% | 6.87% | 2021 and 2022 |
| 2023 | 88.42 | 0.088 | 4.84% | −2.25% | 2022 and 2023 |
| Average | 2.49% |
Source(s): Authors’ own work
Life cycle costs comparison of energy consumption
| Building ID | Number of years | Year | Baseline life cycle cost ($) | Forecasted life cycle cost ($) | Expected life cycle cost saving ($) |
|---|---|---|---|---|---|
| I | (Base year) | 2021 | 65,494 | 60,355 | 5,139 |
| 1 | 2022 | 67,066 | 61,804 | 5,262 | |
| 2 | 2023 | 68,675 | 63,287 | 5,388 | |
| 3 | 2024 | 70,323 | 64,806 | 5,517 | |
| 4 | 2025 | 72,011 | 66,361 | 5,650 | |
| 5 | 2026 | 73,739 | 67,954 | 5,785 | |
| 10 | 2031 | 83,023 | 76,509 | 6,514 | |
| 20 | 2041 | 105,244 | 96,987 | 8,257 | |
| 30 | 2051 | 133,413 | 122,946 | 10,467 | |
| 40 | 2061 | 169,121 | 155,852 | 13,269 | |
| Total | 4,486,934 | 4,134,895 | 352,039 | ||
| Average | 109,437 | 100,851 | 8,586 | ||
| Average saving $/m2 | 1.40 | ||||
| Percentage saving | 8% | ||||
| IV | (Base year) | 2021 | 147,284 | 62,740 | 84,543 |
| 1 | 2022 | 150,818 | 64,246 | 86,572 | |
| 2 | 2023 | 154,438 | 65,788 | 88,650 | |
| 3 | 2024 | 158,145 | 67,367 | 90,778 | |
| 4 | 2025 | 161,940 | 68,984 | 92,956 | |
| 5 | 2026 | 165,827 | 70,639 | 95,187 | |
| 10 | 2031 | 186,704 | 79,533 | 107,172 | |
| 20 | 2041 | 236,676 | 100,820 | 135,856 | |
| 30 | 2051 | 300,022 | 127,804 | 172,218 | |
| 40 | 2061 | 380,323 | 162,011 | 218,312 | |
| Total | 10,090,304 | 4,298,290 | 5,792,014 | ||
| Average | 246,105 | 104,836 | 141,269 | ||
| Average saving $/m2 | 10.23 | ||||
| Percentage saving | 57% |
Source(s): Authors’ own work
Life cycle costs comparison of water consumption
| Building ID | Number of years | Year | Baseline life cycle cost ($) | Forecasted life cycle cost ($) | Expected life cycle cost saving ($) |
|---|---|---|---|---|---|
| I | (Base year) | 2021 | 5,836 | 3,771 | 2,065 |
| 1 | 2022 | 5,894 | 3,809 | 2,085 | |
| 2 | 2023 | 5,953 | 3,847 | 2,106 | |
| 3 | 2024 | 6,013 | 3,886 | 2,127 | |
| 4 | 2025 | 6,073 | 3,925 | 2,148 | |
| 5 | 2026 | 6,134 | 3,964 | 2,170 | |
| 10 | 2031 | 6,447 | 4,166 | 2,281 | |
| 20 | 2041 | 7,121 | 4,602 | 2,519 | |
| 30 | 2051 | 7,866 | 5,083 | 2,783 | |
| 40 | 2061 | 8,689 | 5,615 | 3,074 | |
| Total | 293,993 | 189,985 | 104,008 | ||
| Average | 7,171 | 4,634 | 2,537 | ||
| Average saving $/m2 | 0.18 | ||||
| Percentage saving | 35% | ||||
| II | (Base year) | 2021 | 1,325 | 1,178 | 147 |
| 1 | 2022 | 1,338 | 1,189 | 149 | |
| 2 | 2023 | 1,351 | 1,201 | 150 | |
| 3 | 2024 | 1,365 | 1,213 | 152 | |
| 4 | 2025 | 1,379 | 1,226 | 153 | |
| 5 | 2026 | 1,392 | 1,238 | 155 | |
| 10 | 2031 | 1,463 | 1,301 | 162 | |
| 20 | 2041 | 1,616 | 1,437 | 179 | |
| 30 | 2051 | 1,786 | 1,587 | 198 | |
| 40 | 2061 | 1,972 | 1,753 | 219 | |
| Total | 66,736 | 59,327 | 7,409 | ||
| Average | 1,628 | 1,447 | 181 | ||
| Average saving $/m2 | 0.09 | ||||
| Percentage saving | 11% | ||||
| IV | (Base year) | 2021 | 13,124 | 4,891 | 8,233 |
| 1 | 2022 | 13,255 | 4,940 | 8,315 | |
| 2 | 2023 | 13,388 | 4,990 | 8,398 | |
| 3 | 2024 | 13,522 | 5,040 | 8,482 | |
| 4 | 2025 | 13,657 | 5,090 | 8,567 | |
| 5 | 2026 | 13,794 | 5,141 | 8,653 | |
| 10 | 2031 | 14,497 | 5,403 | 9,094 | |
| 20 | 2041 | 16,014 | 5,968 | 10,046 | |
| 30 | 2051 | 17,690 | 6,593 | 11,097 | |
| 40 | 2061 | 19,540 | 7,283 | 12,258 | |
| Total | 648,013 | 241,511 | 406,502 | ||
| Average | 16,200 | 6,038 | 10,163 | ||
| Average saving $/m2 | 4.95 | ||||
| Percentage saving | 63% |
Source(s): Authors’ own work
The year 2021 was used as the base year for projecting the life cycle cost since both buildings were already in operation, and there was enough data to forecast the changes in the price of energy and water. Table 6 shows that the baseline energy costs for the base year were approximately $65,493 and $147,283 for buildings I and IV, respectively, while the buildings’ energy costs were $60,355 and $62,740 for buildings I and IV, respectively. Table 6 also shows that the overall (total) forecasted baseline life cycle energy costs (i.e. 40 years) are $4,486,934 and $10,090,304 for building I and IV, respectively, and the forecasted buildings’ life cycle energy costs are $4,134,895 and $4,298,290 for building I and IV, respectively.
These findings translate to the overall energy cost saving of $352,039 and $5,792,014 for buildings I and IV, respectively. Comparatively, the overall energy cost savings for buildings I and IV are 8% and 57%, respectively. Moreover, the findings translate to the overall average buildings’ life cycle energy costs of $100,851.09 and $104,836.35 for buildings I and IV, respectively, which, when compared to the average baseline life cycle energy costs, yield the average energy cost savings of $8,586.32 and $141,268.62 for building I and IV, respectively. Furthermore, from an energy efficiency perspective, the life cycle energy cost savings amount to approximately 1.4 $/m2 and 10.2 $/m2 for buildings I and IV, respectively, which fall within the benchmark for green building performance. Previous research (Duarte et al., 2018; Dwaikat and Ali, 2018; Miraj et al., 2021) has also shown that green buildings offer even greater savings as energy prices rise.
Moreover, concerning the water cost savings, it is observed in Table 7 that the overall forecasted baseline life cycle water costs (i.e. 40 years) are $293,993, $66,736 and $648,013 for buildings I, II and IV, respectively. The forecasted buildings’ life cycle water costs are $189,985, $59,327 and $241,511 for buildings I, II and IV, respectively. These findings translate to the overall savings in the life cycle of buildings’ water cost savings of $104,008, $7,409, and $406,502 for buildings I and IV, respectively, compared to the baseline life cycle energy costs. Moreover, it is observed that the overall water cost savings for buildings I, II and IV are 35%, 11% and 63%, respectively. It is also observed that, from the energy efficiency perspective, the life cycle water cost savings correspond to savings of approximately 0.2 $/m2, 0.1 $/m2 and 5 $/m2 for buildings I, II and IV, respectively, which fall within the benchmark for green building performance.
The findings demonstrate an evaluation based on the existing buildings’ performance data and those derived from the escalated average energy and water prices. These findings indicate that from an economic standpoint, green buildings offer positive economic advantages irrespective of energy and water use patterns. Additionally, the findings reveal that green buildings provide the potential for energy and water cost savings in the short and long term (Dwaikat and Ali, 2018; Miraj et al., 2021).
5. Study’s implications
The findings underscore several significant implications; First, green buildings are a financially attractive investment due to their reduced resource consumption, offering substantial economic benefits amidst the rising global resource prices. Second, the empirical evidence provided by this study can promote green building adoption, influencing policy and practice in the construction sector. Policymakers can adopt these findings to advocate for stricter green building regulations and incentives, while stakeholders in the construction industry can leverage the data to make informed decisions about adopting sustainable building practices. Please also see the supplementary file for an expanded discussion on implications, limitations, and future research directions.
6. Study limitations and future research directions
Despite the valuable insights, a few limitations were encountered while conducting the study. First, using a case study methodology restricts the generalizability of the findings. The limited sample size constrains the ability to generalize the findings. The limitation implies that further research employing more extensive and diverse samples is required to confirm these results. Additionally, the study did not account for variations in building design, occupancy patterns, and maintenance practices, which can significantly influence resource use efficiency.
This study acknowledges the importance of qualitative factors in complementing the economic benefit evaluation of green building adoption. Therefore, forthcoming research should integrate qualitative factors, such as user satisfaction and social acceptance, into the evaluation. Moreover, future studies should look at establishing a more robust framework for predicting the performance of green buildings in the face of dynamic economic and technological conditions.
7. Conclusions
Based on the study findings, several conclusions are recapped: first, from the historical perspective of the buildings’ performance, it is evident that green buildings potentially reduce energy and water consumption. However, green building certification does not necessarily present energy saving potential unless the energy usage is monitored and rectified. Second, regarding water saving, it is concluded that green buildings provide great potential for water conservation and cost saving. Third, the overall energy cost savings were 8% and 57% for buildings I and IV, respectively. Furthermore, the outcome of this investigation is that the potential for water conservation in buildings is more apparent than that of energy conservation. Green buildings are an attractive investment due to their reduced resource consumption, which provides substantial economic benefits, particularly in light of the increasing global resource prices and consumption of buildings.
References
The supplementary material for this article can be found online.

