The aim of this study is to develop a method for predicting voluntary employee turnover using grey machine learning and to demonstrate its effectiveness as a decision-support tool in HR management.
This study presents an innovative approach that integrates machine learning with grey system theory to predict voluntary employee turnover. The developed method follows a six-step procedure, encompassing variable selection, data preparation, and model training. A grey cluster-based decision model is applied as an activation function within a novel machine learning architecture, enabling the incorporation of imprecise, vague, and error-prone data. A quantitative study was conducted using survey data from 1,030 employees, collected through a CAWI method. The dataset was analyzed using machine learning techniques, and model validation was performed through cross-validation. This methodology enhances HR decision-making by addressing uncertainty in turnover prediction.
The study demonstrates that integrating grey system theory with machine learning enhances the prediction of voluntary employee turnover by effectively handling imprecise and uncertain data. The developed grey cluster-based decision model improves the representation of social science complexities, capturing key turnover factors such as salary, job satisfaction, and organizational culture. The model’s performance was validated through a quantitative study, achieving an average accuracy of 80.94%. These findings confirm its applicability in HR decision-making, suggesting that grey machine learning provides a robust framework for predicting employee departures and enabling organizations to implement proactive retention strategies while minimizing turnover-related costs.
The originality of this study lies in the unique integration of grey system theory with machine learning architecture through the application of a grey cluster-based decision model as an activation function. This approach has not been widely applied to predicting voluntary employee turnover, and its novelty stems from the ability to operate directly on imprecise and incomplete data without the need for full “whitening”. The developed model captures complex, multidimensional, and often subjective factors influencing employee decisions, making it more resilient to informational noise than traditional algorithms. An additional value is the method’s potential transferability to other areas of social science research where uncertainty and incomplete data pose significant challenges, opening opportunities for further development in both theoretical and practical analytical contexts.
1. Introduction
Employee turnover, especially voluntary departures, is one of the key challenges in modern human resource management. In a dynamic market environment where acquiring and retaining talent is of particular importance, accurately predicting employees’ intentions to leave is essential for effective strategic planning. Traditional analytical methods based on classical statistical models often fail to account for the complexity and uncertainty inherent in social data, limiting their effectiveness.
This article proposes an innovative approach that integrates machine learning with grey system theory—an original grey cluster-based decision model. The proposed model introduces a novel integration of grey system theory into a machine learning framework, addressing the limitations of conventional predictive methods in handling ambiguous and incomplete social data. Grey system theory allows the use of so-called grey numbers, which effectively represent informational uncertainty in social research, thereby capturing the nuances influencing employees’ decisions more accurately. In the presented approach, grey system theory is integrated with machine learning by applying a grey cluster-based decision model as an activation function in a novel machine learning architecture. This model allows operations on grey numbers, enabling effective representation of imprecise and incomplete information typical for social research. The innovation of this method lies in combining the adaptive capabilities of learning algorithms with the uncertainty-handling features of grey models. As a result, a predictive tool is created that not only learns from empirical data but also maintains strong resilience to informational noise, making it particularly valuable in the context of human resource management.
The aim of this study is not only to introduce a novel model for predicting voluntary employee turnover but also to demonstrate how integrating grey machine learning can serve as a valuable decision-support tool in HR management. The research findings suggest that applying this methodology enhances the ability to account for uncertainty in social data, leading to more accurate predictions of employee behavior.
The article fits into a broader trend of developing new models related to grey systems theory, as exemplified by (Zhang et al., 2025; Hu and Xie, 2025; Li and Li, 2024; Nowak et al., 2021). These models typically address predictive problems (Jia and Pang, 2024; Rathnayaka and Seneviratna, 2024; Zhang and Li, 2024) as well as decision-making problems (Guo et al., 2024; Qin et al., 2025). At the same time, the integration of tools from grey systems theory with machine learning constitutes an important research aspect (Wang et al., 2024; Yao and Liu, 2024; Qin and Zhao, 2024; Hakan et al., 2024).
Section 2 of the article presents a literature review on the fundamentals of machine learning and decision models within grey system theory. Section 3 introduces the formal model of the proposed method for predicting voluntary employee turnover intentions using grey machine learning. Section 4 presents the results of empirical research in which the developed grey machine learning method was applied.
2. Literature review
2.1 Voluntary employee turnover
Voluntary employee turnover is one of the most critical topics in organizational behavior research, impacting both business efficiency and the costs associated with recruiting and training new employees. Over the past century, research on employee turnover has evolved, manifesting in a wide range of theoretical and methodological approaches. Classical theories, such as those proposed by March and Simon (1993), Price (1977), and Mobley et al. (1978), laid the foundation for subsequent studies. In recent years, with the advancement of information technologies and analytical methods, there has been an intensification of research utilizing advanced statistical techniques and machine learning models. Hom et al. (2017), in their work “One Hundred Years of Employee Turnover Theory and Research,” conducted an extensive literature review, highlighting the complexity of the processes underlying employee departures. The authors emphasize that turnover is not merely a result of individual employee decisions but rather an outcome of the interaction of numerous factors—ranging from compensation and job satisfaction to perceptions of organizational justice (Hom et al., 2017). Lee et al. (2017), in “On the Next Decade of Research in Voluntary Employee Turnover,” propose advancing research by integrating traditional theoretical approaches with modern analytical techniques, such as machine learning. They note that while earlier models often relied on statistical regression analyses (Griffeth et al., 2000; Tett and Meyer, 1993), contemporary research is shifting toward more dynamic methods that better account for the instability and variability of factors influencing employee decisions (Holtom et al., 2008; Maertz and Campion, 2004).
The latest trends in employee turnover research are summarized by Bolt et al. (2022) in “A Century of Labour Turnover Research: A Systematic Literature Review.” This work provides a systematic analysis of hundreds of studies, emphasizing the growing importance of interdisciplinary approaches and methodologies that combine traditional statistical analyses with modern computational tools. The authors highlight that integrating quantitative and qualitative data, along with the application of machine learning—including models based on grey system theory—enhances predictive accuracy and deepens the understanding of the mechanisms driving voluntary employee turnover (Bolt et al., 2022).
The literature also includes numerous studies that expand upon classical models and adapt them to contemporary market conditions. For example, Griffeth et al. (2000) conducted a meta-analysis that identified key determinants of turnover, emphasizing the importance of motivational and demographic factors. Similar conclusions were drawn by Maertz and Campion (2004), who critically evaluated previous approaches and proposed new research directions that account for organizational and cultural contexts. In their view, it is crucial not only to identify influencing factors but also to understand their interactions (Mobley et al., 1978; Price, 1977).
Holtom et al. (2008) highlight the role of the work environment and organizational support in shaping employees’ intentions to leave. Their research indicates that high levels of employee engagement and effective internal communication can significantly reduce turnover rates, a finding also confirmed by Hausknecht et al. (2009). Similarly, Tett and Meyer (1993) suggest that job satisfaction and organizational commitment are key predictors of employee retention, though these relationships can be moderated by industry- and culture-specific conditions. Another important research stream examines the impact of organizational factors on turnover. Eisenberger et al. (2005) emphasize that supervisor support and fair treatment of employees contribute to a lower willingness to leave. Allen et al. (2010) expand on these findings, suggesting that implementing evidence-based retention strategies can yield significant benefits in reducing turnover.
Thus, voluntary employee turnover is a multidimensional phenomenon, shaped by the interaction of various factors—individual, organizational, and external (Nowak, 2024). Given the dynamic changes in the labor market and increasing competition in attracting and retaining talent, the development of analytical tools is a key component of human resource management strategies. Therefore, future research on voluntary turnover should focus not only on identifying its determinants but also on developing tools that effectively integrate these factors into comprehensive predictive models (Allen et al., 2010; Holtom et al., 2008).
In recent years, researchers have begun to combine grey systems theory with human resource analytics to better capture uncertainty, incomplete data, and nonlinear decision-making processes. This integration allows for enhanced modeling of employee behavior and strategic HR forecasting, particularly in complex or information-poor environments. For instance, Mallick and Mukhopadhyay (2024) developed a grey-based multicriteria decision-making model for “boomerang recruitment,” providing an intelligent rehiring framework that accounts for multiple uncertain inputs. Jin and Yang applied a grey backpropagation neural network to forecast HR demand in port enterprises, demonstrating how grey modeling enhances prediction in sectors with limited historical data. Liu and Zhang (2024) used grey correlation analysis to study the relationship between strategic human resource management and corporate performance, showing that grey models can effectively handle vague causalities in organizational data. Tao (2024) explored the impact of HRM strategies on organizational structure and brand image using grey correlation analysis, bridging soft managerial aspects with measurable outputs. Esangbedo and Xue (2025) proposed a more general application of grey system theory to business decision-making, suggesting its relevance in HR contexts through multi-criteria frameworks. These studies collectively demonstrate the growing potential of grey system methods in HR analytics, particularly in contexts where data is partial, subjective, or hard to quantify. Their relevance to voluntary turnover research lies in the ability of grey models to incorporate uncertain perceptions, such as job satisfaction or organizational fairness, into predictive architectures.
2.2 Machine learning
Machine learning, which is now at the core of artificial intelligence (AI) and data science development, has its origins in the mid-20th century (Nowak and Pawłowska-Nowak, 2024). The first significant studies on the concept of machine “learning” date back to the 1950s when Alan Turing proposed the idea of a “learning machine” in 1950 (Naeini and Prindle, 2018).
In an analytical perspective, machine learning can be described as the process in which a computer program develops the ability to solve tasks T based on experience E, in accordance with a specific evaluation criterion p, with the quality Q of solving these tasks improving as experience E accumulates (Mitchell, 1997). Fields closely related to machine learning include primarily probability theory, statistics, formal logic, information theory, control theory, cybernetics, as well as psychology and neurophysiology. It is often emphasized that machine learning represents an area of knowledge at the intersection of computer science and cybernetics (Sharma and Kumar, 2017).
In 1957, F. Rosenblatt developed an early machine learning model known as the perceptron, which was designed to mimic aspects of human cognitive processes (Rosenblatt, 1957, 1958). This initial approach, later referred to as Rosenblatt’s perceptron, was capable of identifying handwritten characters and laid the foundation for the creation of artificial neural networks (ANNs). Later, in 1959, A. Samuel helped bring the concept of “machine learning” to the forefront by defining it as a discipline that enables computers to learn autonomously without being directly programmed (Samuel, 1959).
The 1980s saw key breakthroughs, including the development of genetic algorithms, which drew inspiration from evolutionary theory and natural adaptation processes. John Holland’s work on genetic algorithms was crucial for the advancement of this field (Othman et al., 2022; Jones et al., 2018). At the turn of the 21st century, machine learning witnessed explosive growth in both its theoretical underpinnings and real-world applications. This rapid expansion was driven by several major developments (Kaplan, 2016):
A significant boost in the computational speeds of modern computer networks.
A notable increase in the memory capacity available in IT systems.
A sharp decline in the cost per unit of both data processing and memory.
A shift from physical media to digital data storage.
Improved access to data, especially facilitated by the Internet.
The emergence of affordable, high-resolution digital sensors.
The fast-paced advancement of big data technologies.
3. Methods
The developed method for predicting voluntary employee turnover, which integrates grey system theory (grey cluster-based decision model) with machine learning, can be presented as a six-step procedure:
Step 1. Defining the set of variables influencing the intention of voluntary employee turnover
In the developed method, the following set of variables is applied: gender (x1), age (x2), education (x3), job position characteristics (x4), salary (x5), job satisfaction (x6), sense of fairness (x7), promotion opportunities (x8), professional development opportunities (x9), work performance (x10), working conditions (x11), team atmosphere (x12), recognition and rewards (x13), relationships with supervisors (x14), job stability (x15), communication within the company (x16), work-life balance (x17), independence at work (x18), level of autonomy at work (x19), job responsibility (x20), work engagement (x21), remote work availability (x22), flexible working hours (x23), sense of burnout (x24), workload (x25), commuting time (x26), recognition at work (x27), organizational management (x28), job monotony (x29), employer reputation (x30), and organizational culture (x31). Each variable can be measured using different value scales. All variables are expressed as grey numbers. The selection of 31 variables applied in the first step of the method was based on both theoretical premises and empirical findings in the literature on voluntary employee turnover. As highlighted by numerous studies (Hom et al., 2017; Bolt et al., 2022; Lee et al., 2017; Holtom et al., 2008), decisions to leave a job result from complex interactions among individual, organizational, and contextual factors. The included variables reflect key areas of influence such as salary, job satisfaction, organizational culture, sense of fairness, relationships with supervisors, opportunities for professional development, and work-life balance. The initial inclusion of a broad set of variables is also in line with standard practices in machine learning, where feature selection is performed in later stages—here, through correlation analysis (Step 3). This approach allows for theoretical comprehensiveness while reducing model dimensionality to the most predictive variables, thereby enhancing both methodological validity and predictive efficiency of the developed tool.
Step 2. Preparing the dataset for machine learning
In the second step of the method, employee surveys must be conducted. Given that machine learning is used in this approach, the sample does not need to be representative—conclusions should be limited to the studied group. A sample research group may consist of employees from a large enterprise. The survey questionnaire must include questions related to the variables identified in Step 1.
Step 3. Data Preparation
As part of this stage, the model involves the following actions:
rescaling variables to uniform scales (or standardizing variables) – a crucial step for facilitating the machine learning process, necessary for many algorithms.
transforming multi-value nominal data into a set of binary variables – converting categorical variables into numerical representations.
conducting correlation analysis and selecting the 10 most strongly correlated variables with the target label – different correlation coefficients are used depending on the nature of the variables.
The actions outlined in this step are performed on white numbers (following the kernel of the grey number concept) to define a catalog of the 10 most strongly correlated features with the target variable. In the subsequent steps, the model learns using grey numbers.
Step 4. Splitting the Dataset into Training and Testing Data
In machine learning, it is standard practice to randomly split the entire dataset into two distinct groups: one used for training and the other reserved for testing (Nguyen et al., 2021). Both groups include records with specific feature values and their corresponding labels. Typically, the training group comprises between 70 and 90% of the overall data (Nguyen et al., 2021). This separation allows the algorithm to develop its predictive capabilities using the training data, while its effectiveness is independently evaluated on the test data. A robustly trained model is one that achieves high classification accuracy when applied to this test set.
Step 5. Implementing the Machine Learning Process Using the Grey Cluster-Based Model as an Activation Function
The author of this study has frequently applied classification, relational, and predictive methods in previous research on management problems, all of which are part of grey system theory. This theory models informational uncertainty using so-called grey operators, particularly grey numbers, weighted whitening functions, grey matrices, and grey numerical sequences (or series).
In 2019, the author developed a decision-classification model based on grey system theory—the grey cluster-based decision model. This model utilizes grey numbers and the concept of reference points, making it particularly suitable for modeling the informational uncertainty characteristic of social sciences. However, like many similar models, it is not inherently capable of learning in the machine learning sense, meaning its full potential has not been realized.
The integration of this model with machine learning allows for the incorporation of imprecise, vague, and error-prone data. This approach ensures an accurate representation of the uncertainty inherent in social sciences. The grey machine learning process for each object can be represented by the following procedure:
Determining the Attribute Vector for Each Object in the Training Set
Where k = {1, 2, …, m} – represents the number of decision objects.
Initializing Weights in the Grey Machine Learning Model
The weights are selected as small random numbers, following standard machine learning methodology. The weight vector is represented as follows:
Determining the Number of Epochs – it is assumed that the learning process will be completed in no more than 50 epochs
Determining the Weighted Attribute Vectors According to the Following Formula:
where = .
Which can also be expressed by formula (4):
Determining the Total Weighted Score for All Objects in the Training Set
In step five, the so-called weighted overall evaluation is calculated for each decision-making object. This overall evaluation, represented as a grey number, has a lower bound equal to the sum of the lower bounds of the gray numbers from the weighted gray decision vector D*, and an upper bound equal to the sum of the upper bounds of these numbers, as specified by formula (5).
The appendix to this article presents the pseudocode for the developed grey machine learning algorithm for predicting voluntary employee turnover.
Assigning Labels to the Training Set
It is assumed that the cluster-based model will assign objects to two categories: the presence or absence of turnover intention. In this case, a single reference vector is sufficient. If the total weighted grey score for a given object is greater than the total weighted score of the reference vector , the object is assigned a value of 0 (absence of turnover intention). Conversely, if the total weighted grey score is lower, the object is assigned a value of 1 (presence of turnover intention). When comparing the total weighted score with the total weighted score of the reference vector , the probability that one grey number is greater than another is determined according to formula (6) (Eshtaiwi et al., 2017).
where .
Updating Weights in Each Epoch
The next step of the method involves comparing the labels for the training set with the known reference labels. If the computed label for a given decision object does not match the known label, the weights are updated according to formula (7).
where:
– change in the weight of the j-th criterion,
– learning rate coefficient,
– known label values,
– predicted label values,
– attribute value in the j-th criterion.
To adapt formula (8) for the entire training dataset, the following notations are introduced:
where:
i – sample number.
After the update, the new weight for the j-th criterion is given by:
If the algorithm’s predicted label matches the expected one, the weight for that particular criterion remains unaltered. The learning rate, denoted by η, sets the magnitude of the weight adjustments—high values of η result in substantial updates, whereas lower values lead to more gradual changes. This learning rate is one of the most pivotal hyperparameters in any machine learning architecture. The model’s weights continue to be updated until either convergence is reached (i.e. the predicted labels in the training set align closely with the actual labels) or the predetermined number of training epochs has been exceeded.
Step 6. Validating the Effectiveness of the Grey Machine Learning Model in Predicting Voluntary Employee Turnover Intentions
The effectiveness of a model within the training set can be evaluated using various metrics (Wei et al., 2022). One of the most commonly used measures is accuracy, which is recommended for this purpose. The method for calculating accuracy is presented in Equation (10).
where:
accuracy – machine learning model accuracy,
TP (true positives) – value correctly classified as true,
FP (false positives) – value incorrectly classified as true,
TN (true negatives) – value correctly classified as false,
FN (false negatives) – value incorrectly classified as false.
4. Research results
A prediction method for voluntary employee turnover intentions has been developed using the proposed formal model of a new machine learning architecture based on grey system theory. The structure of the implemented actions within the empirical research followed a procedure consisting of six steps.
Step 1. Defining the set of variables influencing the intention of voluntary employee turnover
In the developed method, based on the catalog of criteria and utilizing the grey machine learning architecture, the prediction of voluntary employee turnover intentions is conducted. Based on a review of the relevant literature, a catalog of variables has been formulated and is presented along with the applied scales in Table 1 (Bolt et al., 2022; Holtom et al., 2008; Hom et al., 2017; Lee et al., 2017).
The label indicating the presence of turnover intention is marked as 1 ([1;1]), while the absence of this intention is marked as 0 ([0;0]).
Step 2. Preparing the dataset for machine learning
The data was collected through a CAWI survey conducted on a purposefully selected sample of 1,030 individuals, consisting of Polish employees regardless of the type of employment contract. The survey was carried out between August 1 and September 30, 2024, allowing for data collection under various organizational conditions. A fragment of the dataset is presented in Table 2.
To ensure a uniform representation of all input variables in the grey machine learning model, both quantitative and qualitative variables were converted into grey numbers. In the case of nominal variables, such as gender or education level, each category was assigned a single-point grey interval—for example, [1;1] for female and [0;0] for male. This conversion was purely technical and did not imply any ordinal or continuous structure. Despite the use of interval notation, these variables were interpreted by the model as categorical data. Their role was limited to class differentiation, without modeling any quantitative relationships between categories. This approach is consistent with the logic of grey system theory, which allows for the use of singleton intervals to represent certain, unambiguous information. As a result, it was possible to maintain a consistent structure of the input data without affecting the classification performance or violating the assumptions of predictive modeling.
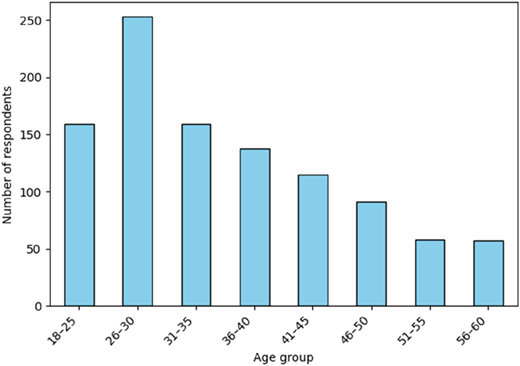
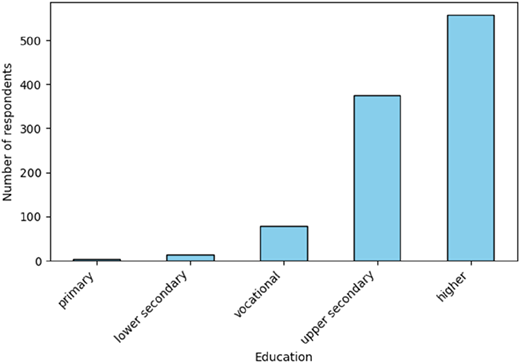
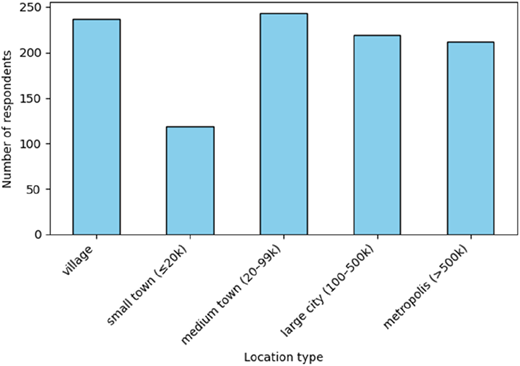
A total of 515 women and 515 men participated in the study. The distributions of age, education level, and place of residence are presented in Figures 1 and 3.
The sample reflects considerable diversity in demographic characteristics. As shown in Figure 1, the age structure is skewed towards younger respondents, with the largest group aged 26–30 (253 individuals), followed by the 18–25 and 31–35 age groups (159 each). This concentration of younger participants aligns with the labor market’s increased turnover in early career stages. In terms of education (Figure 2), most respondents held a higher education degree (558), while a substantial group reported upper secondary education (376). This reflects a relatively well-educated sample, which corresponds with recent trends in workforce qualifications in Poland. As illustrated in Figure 3, the place of residence is varied. Respondents come from all types of settlements, with a slight predominance of medium towns (243) and rural areas (237), followed by large cities and metropolitan areas. This distribution ensures a broad contextual basis for modeling employee turnover intentions and enhances the generalizability of the findings within the national labor context.
Step 3. Data Preparation
In the first step of this stage, the variables (expressed as white numbers) were rescaled to a 0–1 scale. Next, multi-state nominal data was transformed into a set of binary variables. Subsequently, a correlation analysis was conducted. Given that the label is binary, a point-biserial correlation coefficient (formula 11) was applied to quasi-continuous variables, while Cramér’s V (formula 12) was used for the remaining variables.
where:
rpb-point-biserial correlation coefficient,
M1 is the mean value of the variable for individuals exhibiting turnover intention,
M0 is the mean value of the variable for individuals not exhibiting turnover intention,
σ is the standard deviation of the variable,
n1 is the number of individuals exhibiting turnover intention,
n2 is the number of individuals not exhibiting turnover intention,
n is the number of individuals in the dataset.
where:
– Chi-square goodness-of-fit test result,
– total number of observations,
– the minimum of (k−1) and (r−1),
– number of columns in the contingency table,
– number of rows in the contingency table.
In the following section of the study, the strength of relationships between variables was analyzed based on the calculated values of both the point-biserial correlation coefficient and Cramér’s V coefficient. The adopted scale for this analysis is as follows:
0 to 0.2 – weak relationship between variables,
0.2 to 0.4 – moderate relationship between variables,
0.4 to 0.6 – medium relationship between variables,
0.6 to 0.8 – strong relationship between variables,
0.8 to 1.0 – very strong relationship between variables.
The list of the ten variables most strongly correlated with the label is as follows:
Salary – 0.601 (p < 0.001)
Job satisfaction – 0.482 (p < 0.001)
Sense of fairness – 0.379 (p < 0.001)
Recognition at work – 0.296 (p < 0.001)
Professional development opportunities – 0.282 (p < 0.001)
Relationships with supervisors – 0.262 (p < 0.001)
Team atmosphere – 0.259 (p < 0.001)
Work engagement – 0.252 (p < 0.001)
Organizational culture – 0.251 (p < 0.001)
Working conditions – 0.250 (p < 0.001)
For further research, the dataset will include only these ten variables, as they have the most significant impact on the label. The extremely low p-values (all p < 0.001) indicate a high level of statistical significance, reinforcing the reliability of these correlations for the analysis.
Step 4. Splitting the Dataset into Training and Testing Data
To prepare the data for the machine learning process, the dataset was divided into two subsets: training and test sets. Both sets contain records described by feature (variable) values along with their corresponding labels. The division was carried out so that the training set includes 750 records, accounting for 75% of the total data, while the test set consists of 250 records (25% of the data). This process was randomized and executed using the train_test_split function from the scikit-learn library, which is designed for machine learning applications in Python.
Step 5. Implementing the Machine Learning Process Using the Grey Cluster-Based Model as an Activation Function
- (1)
Determining a Sample Attribute Vector for Each Object in the Training Set
A sample attribute vector for a selected employee is as follows:
- (2)
Initializing Weights for the Grey Machine Learning Model
The weight vector, which was randomly initialized in the study on predicting voluntary employee turnover intentions, took the following form in the training set:
- (3)
It was established that the learning process would take place over 50 epochs.
The selection of 50 epochs in the training process of the grey machine learning model was based on preliminary experimental tests aimed at identifying the point at which the error curve stabilizes and minimizing the risk of overfitting. The conducted analysis showed that after approximately the 40th epoch, the decrease in error began to slow down, and further increases in the number of epochs did not result in significant improvements in classification performance. At the same time, extending the training process beyond 50 epochs led to greater fluctuations in test set errors, which could indicate an increasing risk of model overfitting. For this reason, a compromise value of 50 epochs was adopted as an optimal balance between sufficient training duration and maintaining proper generalization.
- (4)
Determining the Weighted Attribute Vectors for Each Object in the Training Set
A sample weighted attribute vector for a selected employee is as follows:
- (5)
Assigning Labels to the Training Set
After the first epoch of machine learning using the grey machine learning architecture, the following labels were obtained in the training set:
However, after the first epoch, it became evident that most labels were assigned incorrectly, necessitating weight adjustments and rerunning the algorithm in subsequent epochs.
- (6)
Updating Weights in Each Epoch
After running the algorithm for 50 epochs on the training set, the resulting weight values are as follows:
After executing the machine learning algorithm, the following set of labels was obtained in the training set:
Step 6. Validating the Effectiveness of the Grey Clustering Machine Learning Model in Predicting Voluntary Employee Turnover Intentions
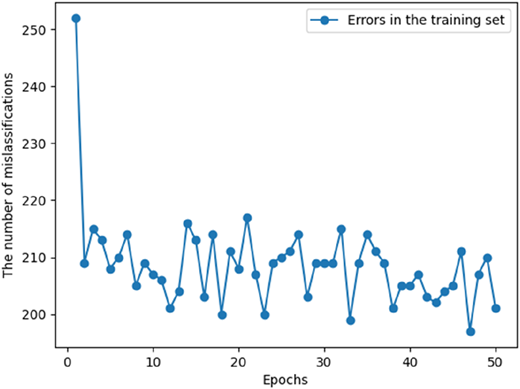
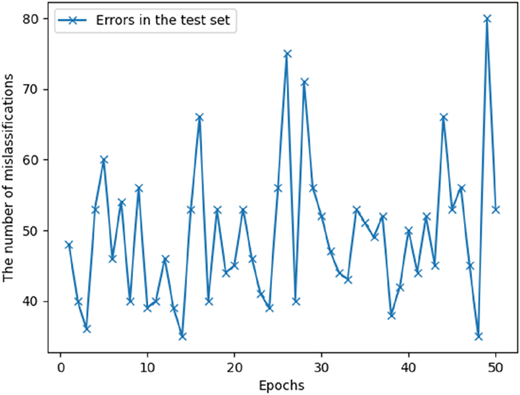
Figure (1) presents the number of incorrect predictions in the training set, while Figure (2) shows the number of incorrect predictions in the test set as a function of the number of epochs. Both figures refer to a single example of the machine learning model training process (with a specific random seed).
Figure 4 presents the number of misclassifications in each epoch of training for a sample learning process. At the beginning (early epochs), the highest number of errors is observed—reaching approximately 250. Then, as training progresses, this number systematically decreases and stabilizes around 200–220 errors. Some fluctuations occur during the learning process, which is typical for iterative optimization algorithms. However, the overall downward trend indicates an improvement in model quality over successive epochs (see Figure 5).
The presented figure shows the number of misclassifications in the test set across successive epochs for a sample learning process. The number of errors often remains within the range of approximately 40–60, which may indicate a generally acceptable, though not perfect, model performance in predicting new data. It should be emphasized that the observed fluctuations in the number of errors in both the training and test sets are typical for iterative learning processes, especially when working with imprecise data and noise-resistant models. These variations do not indicate model instability but rather reflect the adaptive nature of the algorithm as it adjusts to the heterogeneous structure of the input data. Importantly, the overall downward trend and the comparable number of misclassifications in the training and test sets suggest that the model is not overfitted and demonstrates good generalization capability.
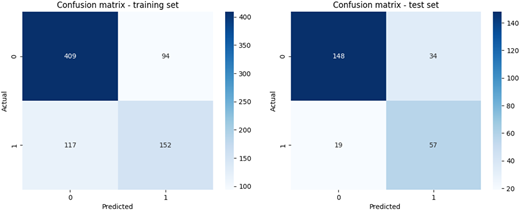
For the sample learning process, a confusion matrix was prepared to better illustrate the model’s quality (for both the training and test sets) (Figure 6).
The data presented in the confusion matrices indicate that the accuracy for the training set was 72.7%, while for the test set, it was 79.5%. However, these values depend, among other factors, on the randomly selected training and test sets.
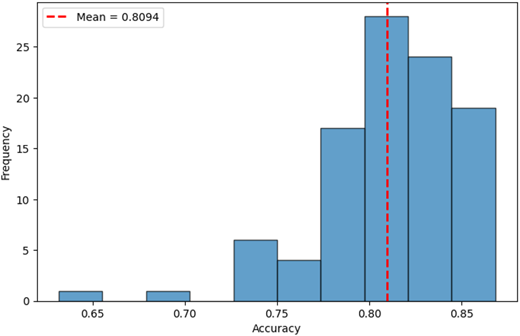
To avoid the effect of a “lucky draw,” a cross-validation procedure was conducted for the developed model. A total of 100 training processes were performed, and the accuracy metric was calculated for each. The results of this procedure are presented in Figure 7.
It turned out that the average accuracy metric for the grey clustering machine learning model in predicting voluntary employee turnover intentions was 0.8094 with a standard deviation of 0.0368. It is worth emphasizing that the empirical data revealed the highest correlations with the label as 0.601 for salary, 0.482 for work satisfaction, and 0.379 for a sense of fairness. These correlations are relatively modest, underscoring the intricate and unpredictable nature of voluntary employee departure intentions. Nonetheless, the machine learning architecture devised using grey system theory manages to predict turnover intentions with a success rate above 80%—an excellent performance. This suggests that integrating machine learning methods with grey system theory models can provide highly effective instruments for social science research, especially in the fields of management.
The article pointed out that the key advantage of the developed method over traditional machine learning algorithms is its ability to model uncertainty using grey numbers. In such cases, the application of other machine learning algorithms is not feasible. However, for the purpose of comparative analysis, the respondents' answers were “whitened” and an assessment was conducted to determine the predictive performance of machine learning algorithms such as: the naïve Bayes classifier, linear and nonlinear support vector machines, decision trees, and logistic regression. In this scenario, the level of uncertainty in the whitened responses is inherently lower than at the outset of the grey clustering machine learning model. It was therefore assumed that if the developed model performs no worse than the average accuracy metric value of the five comparative models (with cross-validation applied to all models), it would be positively validated. Table 3 presents the average accuracy metric value for classical machine learning models (after data whitening) in predicting voluntary employee turnover intentions.
The average accuracy metric across all the traditional machine learning algorithms analyzed was 0.7706, with a standard deviation of 0.0513. This indicates that, although the data in these algorithms do not exhibit the same level of uncertainty as in the proposed algorithm based on grey system theory, their average accuracy is lower than that of the proposed method. The only model that slightly outperformed the proposed approach was the linear support vector machine (0.8105 compared to 0.8094 in the proposed method). The nonlinear support vector machine and logistic regression algorithms produced results very similar to the developed method. Considering the obtained results, it can be concluded that the machine learning method developed based on grey system theory has also been positively validated in comparison to traditional machine learning algorithms.
5. Summary
This article makes a significant theoretical contribution to the field of employee turnover forecasting by integrating machine learning with grey system theory. The proposed grey clustering machine learning model, based on the grey cluster-based decision mechanism, introduces the concept of operating with grey numbers, which enables the representation of imprecise and uncertain data—characteristic of social science research. This approach allows for the consideration of the complexity and multidimensionality of the determinants of voluntary employee turnover, offering an innovative extension of traditional predictive models.
The final performance of the model was influenced by several key training parameters, particularly the number of learning epochs and the choice of learning rate. These were fine-tuned through preliminary experiments to achieve a stable training process and a satisfactory generalization performance. While not the primary focus of this study, their selection significantly impacted predictive accuracy and should be carefully calibrated in future implementations.
The practical application of the developed model is highly relevant for human resource management. With an accuracy exceeding 80%, it can serve as a decision-support tool in HR, enabling the early detection of employee turnover intentions. As a result, organizations can implement preventive measures, minimize costs associated with recruitment and training, and improve retention strategies. The integration of imprecise data into machine learning models allows for a better understanding of the nuances influencing employee decisions.
In real-world HR applications, several implementation challenges should be considered. First, although the model effectively handles data uncertainty, its interpretability may be limited for individuals without analytical training, which could hinder acceptance among decision-makers. Second, the implementation requires access to standardized employee data, which is often not systematically collected. Additionally, the preparation and deployment of such systems may entail technical and financial resources, especially when scaled.
Despite promising results, this study has certain limitations. The size and specificity of the dataset may limit the generalizability of the findings to other organizational contexts. Reliance on survey data, based on respondents' self-assessment, may introduce subjective biases. These may arise from social desirability, recall inaccuracies, or varying interpretations of questions. Respondents may, consciously or not, give answers aligned with expected norms rather than objective self-evaluation.
Additionally, while the transformation of qualitative variables into grey numbers is methodologically innovative, it may not fully reflect the depth of human perception and behavior. The model is also dependent on appropriate feature selection, which can affect its performance. Although the empirical part of this study was based on data collected in Poland using a structured employee survey, the developed method is not limited to this dataset. The model is architecture-independent from the content of specific variables and can be applied to other datasets, provided that predictors of voluntary turnover are available and can be expressed in the form of grey numbers.
Future research should validate the model using larger and more diverse datasets across sectors and cultures. Particular attention should be paid to cultural differences that may influence employee perceptions, communication norms, and turnover motivations. Since the grey machine learning model operates on subjective and imprecise input data, its effectiveness may vary depending on how social and organizational constructs are understood and expressed in different cultural contexts.
Further refinement of the transformation process for qualitative variables and exploration of alternative grey operators may increase accuracy, especially when dealing with culturally nuanced concepts such as job satisfaction, fairness, or loyalty. Additionally, integration with advanced machine learning techniques and the use of longitudinal datasets would allow for testing the model’s predictive stability over time and across regions. Such research could contribute to a deeper, context-sensitive understanding of employee turnover dynamics and support the development of adaptable, culturally aware HR analytics tools.
Appendix Algorithm Pseudocode
Input:
- Dataset D with N employee records and 31 features (converted to grey numbers)
- Learning rate η
- Maximum number of epochs E (e.g. 50)
- Reference vector R (grey values defining turnover intention threshold)
Output:
- Trained weight vector W
- Predicted labels Y_pred
Procedure:
1. Initialize:
- Convert all variables in D to grey numbers
- Standardize and encode nominal variables
- Perform correlation analysis → select 10 most relevant features
- Split D into training set D_train and test set D_test
- Initialize weight vector W with small random grey values
2. Training loop (epochs):
For epoch = 1 to E do:
For each object i in D_train:
- Compute weighted grey sum G_i = sum(W_j * X_ij) for j = 1 to 10
- Compare G_i with grey reference R using grey relational ordering
If G_i < R → Y_pred_i = 1 (turnover intention)
Else → Y_pred_i = 0 (no turnover intention)
- If prediction incorrect:
For each feature j:
Update W_j:
W_j = W_j + η * (Y_true_i–Y_pred_i) *X_ij
3. After training:
- Predict labels for D_test using final weight vector W
- Evaluate performance (accuracy, confusion matrix, etc.)
Return W, Y_pred