
1-20 of 5903
Follow your search
Access your saved searches in your account
Would you like to receive an alert when new items match your search?
Journal

Topical and wide-ranging analysis of contemporary developments in training and development affecting how practice is delivered in organizational settings.
Journal Articles
Journal:
Industrial and Commercial Training
Industrial and Commercial Training 1–18.
Published: 08 September 2026

in Agile coaching 5.0 as a tool for workforce development and employee engagement
> Industrial and Commercial Training
Published: 08 September 2026
Figure 1 Agile Coach core dimensions Source: Authors’ own work An illustration presents four Agile Coach roles covering team facilitation, observation, motivation, and strategic partnership. The illustration presents a head silhouette labelled Agile Coach, containing four puzzle pieces repr... More about this image found in Agile Coach core dimensions Source: Authors’ own work An illustration...
in Agile coaching 5.0 as a tool for workforce development and employee engagement
> Industrial and Commercial Training
Published: 08 September 2026
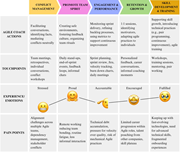
Figure 2 Agile Coach Journey Map for SW teams Source: Authors’ own work A journey map presents Agile Coach actions, touchpoints, emotions, and pain points across five areas of team and skill development. The journey map has five columns headed Conflict Management, Promote Team Spirit, Eng... More about this image found in Agile Coach Journey Map for SW teams Source: Authors’ own work A jo...
in Agile coaching 5.0 as a tool for workforce development and employee engagement
> Industrial and Commercial Training
Published: 08 September 2026
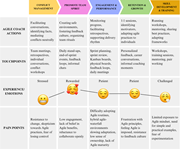
Figure 3 Agile Coach Journey Map for N-SW teams Source: Authors’ own work A Journey map traces Agile coaching from conflict management to skill development through actions, interactions, emotions, and challenges. The journey map progresses through five areas: Conflict Management, Promote Te... More about this image found in Agile Coach Journey Map for N-SW teams Source: Authors’ own work A Jo...
in Agile coaching 5.0 as a tool for workforce development and employee engagement
> Industrial and Commercial Training
Published: 08 September 2026
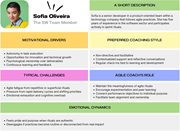
Figure 4 The SW team member persona Source: Authors’ own work A Profile infographic summarises software team member Sofia Oliveira’s motivations, coaching preferences, challenges, coach support, and emotions. The profile infographic identifies Sofia Oliveira as The S W Team Member. A port... More about this image found in The SW team member persona Source: Authors’ own work A Profile info...
in Agile coaching 5.0 as a tool for workforce development and employee engagement
> Industrial and Commercial Training
Published: 08 September 2026
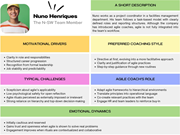
Figure 5 The N-SW team member persona Source: Authors’ own work A Profile infographic outlines N S W team member Nuno Henriques’s motivations, coaching needs, challenges, coach support, and emotions. The profile infographic identifies Nuno Henriques as The N S W Team Member. A portrait besi... More about this image found in The N-SW team member persona Source: Authors’ own work A Profile info...
in Enhancing psychological capital (PsyCap) to improve job satisfaction and retention: a pilot intervention study
> Industrial and Commercial Training
Published: 18 August 2026
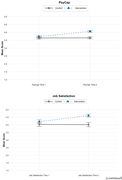
Figure 1 Mean PsyCap, job satisfaction and intention to quit over time for intervention and control groups Two line graphs compare control and intervention mean scores for P s y C a p and job satisfaction across two time points. The upper line graph presents P s y C a p mean scores at Time 1 a... More about this image found in Mean PsyCap, job satisfaction and intention to quit over time for intervent...
in Enhancing psychological capital (PsyCap) to improve job satisfaction and retention: a pilot intervention study
> Industrial and Commercial Training
Published: 18 August 2026
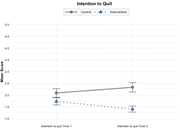
Figure 1 A line graph compares control and intervention mean intention-to-quit scores across two time points. The line graph presents mean intention-to-quit scores for control and intervention groups at Time 1 and Time 2. The control group increases from about 2.1 to 2.3. The intervention grou... More about this image found in A line graph compares control and intervention mean intention-to-quit score...
Journal Articles
Journal:
Industrial and Commercial Training
Industrial and Commercial Training 1–15.
Published: 18 August 2026
in Mediating role of job satisfaction on quality of work life and talent retention among HEI educators
> Industrial and Commercial Training
Published: 13 August 2026
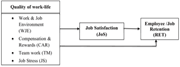
Figure 1 Proposed research framework Source: Authors’ own work A model links quality of work-life directly and through job satisfaction to employee or job retention. Quality of work-life includes Work and Job Environment, W J E, Compensation and Rewards, C A R, Team work, T M, and Job Stres... More about this image found in Proposed research framework Source: Authors’ own work A model links q...
in Mediating role of job satisfaction on quality of work life and talent retention among HEI educators
> Industrial and Commercial Training
Published: 13 August 2026
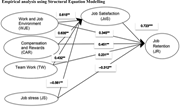
Figure 2 Empirical results of hypothesised model Note(s): **p-value less than 5% and ***p-value less than 1% Source: Authors’ calculation A structural equation model links work-life factors and job stress with job satisfaction and job retention through direct pathways. The structural equation model includes Work and Job Environment, W J E, Compensation and Rewards, C A R, Team Work, T W, Job Stress, J S, Job Satisfaction, J o S, and Job Retention, J R. Work and Job Environment leads to Job Satisfaction with 0.615 and to Job Retention with 0.345. Compensation and Rewards leads to Job Satisfaction with 0.635 and to Job Retention with 0.451. Team Work leads to Job Satisfaction with 0.432 and to Job Retention with 0.231. Job Stress leads to Job Satisfaction with negative 0.561 and to Job Retention with negative 0.312. Job Satisfaction leads to Job Retention with 0.723. Double asterisks follow all coefficients except 0.723, which is followed by three asterisks. More about this image found in Empirical results of hypothesised model Note(s): **p-va...
Journal Articles
Journal:
Industrial and Commercial Training
Industrial and Commercial Training 1–15.
Published: 13 August 2026
Journal Articles
Journal:
Industrial and Commercial Training
Industrial and Commercial Training 1–19.
Published: 16 July 2026
in Human-centered AI in HRM: enhancing recruitment and talent development in the Jordanian manufacturing sector
> Industrial and Commercial Training
Published: 16 July 2026
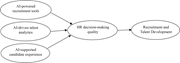
Figure 1 The conceptual framework of the study Source: Author’s own work A flow diagram links A I recruitment factors through H R decision-making quality to recruitment and talent development. The entries A I-powered recruitment tools, A I-driven talent analytics, and A I-supported candidat... More about this image found in The conceptual framework of the study Source: Author’s own work A flo...
Journal Articles
Journal:
Industrial and Commercial Training
Industrial and Commercial Training 1.
Published: 02 July 2026
Journal Articles
Journal:
Industrial and Commercial Training
Industrial and Commercial Training 1–10.
Published: 01 June 2026
Journal Articles
Journal:
Industrial and Commercial Training
Industrial and Commercial Training 1–14.
Published: 08 April 2026
in Psychological safety and employee development: the role of energy at work in strengthening job embeddedness in Indian luxury hotels
> Industrial and Commercial Training
Published: 08 April 2026
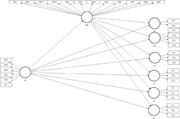
Figure 1 Path model Source: Authors’ own work A structural equation model links P S and E W to multiple outcome constructs, including O F, O S, O L, C F, C S, and C L with indicators. The structural equation model shows latent variables in circles and indicators in rectangles. A latent vari... More about this image found in Path model Source: Authors’ own work A structural equation model link...
Journal Articles
Journal:
Industrial and Commercial Training
Industrial and Commercial Training (2026) 58 (2): 143–161.
Published: 25 February 2026

