


Using cross-country data on the 1,000 largest global banks for 2019, the paper aims to examine the response of bank risk and returns to the pandemic.
The author employs weighted least squares (WLS) techniques for the purposes of analysis.
The findings suggest that banks with Islamic windows increased their riskiness in response to the pandemic, although there was not much impact on profitability. Additionally, the author categorizes banks based on certain major characteristics and find that these findings are manifest primarily for well-capitalized and less liquid banks.
Research as to the impact of the pandemic on banks' balance sheets has been an unaddressed area of research. By focusing on a large sample of banks across countries with both Islamic and conventional banking presence, the analysis sheds light on the balance sheet response of banks to the pandemic, an aspect that has not been addressed earlier.
1. Introduction
The coronavirus (COVID-19) outbreak that began in December 2019 and rapidly spread all over the globe shows gradual signs of abating. As of December 2022, the virus has spread to over 200 jurisdictions, affected close to 650mn people and inflicted over 6.5mn deaths (Our World in Data, 2022) [1]. In addition to significant disruption to economic activity all over the world, the outlook generated a major economic slowdown. Global growth was −3.1% in 2020, perhaps the lowest since the Great Depression of the 1930s, with several advanced economies registering double-digit (or, close to double-digit) negative GDP growth (IMF, 2021) [2].
Perhaps the most immediate and graphic impact of COVID-19 was manifest in financial markets. Within a week during February 23–28, 2020, the S&P fell by over 20% and lost over US $5tn in market value. Major financial markets elsewhere such as the UK and Japan also registered similar or higher order declines. Concurrently, large international banks witnessed a rapid plunge in their share price. For instance, from December 2019 to April 2020, the Euro Stoxx banks index witnessed a 40% decline followed by Stoxx North America banks index (30%) and Stoxx Asia–Pacific banks index (25%). Coupled with weaknesses in demand and an abundance of supply, oil prices were driven down to zero levels, unnerving investors and causing a flight to safety (IMF, 2020a).
Consistent with the increasing intensity of the pandemic, countries responded proactively to contain the untoward effects of the sharp and sudden decline in economic activity (Cavallino and de Fiore, 2020). On the one hand, governments launched massive fiscal stimulus (IMF, 2020b) over and above emergency support measures by central banks (IMF, 2020c). In addition, prudential policies supported these measures to ensure credit growth (BIS, 2020a). In addition, measures were also undertaken to maintain public health and safety and expand social safety nets to protect the poor and the vulnerable segments of society.
Notwithstanding its increasing impact on almost all spheres of global economic activity, the impact of the pandemic on the banking sector has been a relatively under-researched area. Only a few studies have examined this aspect in some detail. Most of these have been in the nature of cross-national evidence (BIS, 2020b; Ramelli and Wagner, 2020; Demirguc-Kunt et al., 2021; Duan et al., 2021; Tran et al., 2022). Even within the banking sector, the focus has primarily been on the behavior of bank equity prices. For instance, Aldasoro et al. (2020) report a massive sell-off during the pandemic and a retraction thereafter particularly for profitable and well-capitalized banks, consequent upon the stabilization measures employed. Hardy (2020) observes that given their strong capital position prior to the pandemic, the relaxation of liquidity and capital buffers in several jurisdictions has been viewed much less favorably by equity investors, although debt investors recognized the relevance of such policy measures for the safety that it provided. As a result, while equity prices have been volatile, banks' funding costs have remained well-contained, supported to a large extent by monetary and related measures.
A few studies have focused on specific geographies. In case of the USA, Acharya and Steffen (2020) find that firms with access to liquidity support garnered higher premia as compared with those which were relatively illiquid. Likewise, Haddad et al. (2021) studied the disruptions in the debt market and showed that investors sold safer and more liquid securities to raise cash since riskier financial instruments traded at a significant discount. This discount for riskier assets dissipated substantially once the Fed policies took hold. Exploiting the heterogeneity and intensity of the spread of COVID-19 across Europe and the USA, Chen et al. (2020) analyze the impact on the real sector. Their findings indicate that although the overall impact (in terms of decline in electricity consumption) was similar in both cases, the impact was uneven within jurisdictions. In particular, as compared with the same period in 2019, states such as Washington, New York and New Jersey in the USA experienced a 4–5.5% decline in electricity consumption, whereas the decline in the case of Europe was much larger, ranging from a minimum of 9% to anywhere between 25–30% in case of Italy, Spain and France. Stress analysis by the European Central Bank suggested that Euro Area banks' tier-I capital would decline by 2% (ECB, 2020). Using data on publicly listed Chinese firms, He et al. (2020) show that industries with a significant human interface such as tourism, transport and hospitality were significantly affected, with the extent of the decline in their returns being 97–100% at end of the 2020:Q1 relative to end-2019. Our analysis is complementary to these studies in the sense that we combine the heterogeneity in the spread of COVID-19 with the balance sheet reporting date of the largest global banks across countries and analyze the impact on risk and returns, after onboarding other relevant factors.
Even this analysis does not pay adequate attention to the behavior of Islamic banks. FinDev Gateway (2020) provides an overview of the pandemic and documents its supervisory implications for Islamic banks. Based on their analysis regarding the policy measures and actions taken by jurisdictions with significant Islamic banking presence, it concludes that countries need to ensure a balance between ensuring the stability of Islamic banks and supporting economic activity. Jobst and Sole (2020) provide an assessment of the stress testing methodologies for Islamic banks, accounting for the unique risks faced by them. These studies either predate the pandemic or alternately, do not carefully assess the interlinkage between COVID-19 and bank behavior, limiting their policy relevance.
To contribute to this debate, we analyze the impact of the pandemic on the banking sector. To be more specific, we employ data from the top 1,000 largest global banks for the year 2019 – both conventional and Islamic, including Islamic windows – and integrate this information with the staggered timing of the first reported COVID-19 cases within a country and examine the impact on bank risk and return. The findings suggest that there is not much significant impact of the pandemic on bank returns, although riskiness was affected. Importantly, such evidence was manifest primarily in the case of Islamic banks and those with Islamic windows, and the magnitude of the impact was much higher in the case of the latter as compared with the former. Thereafter, we categorize banks based on some of their major characteristics akin to the monetary literature (Kashyap and Stein, 2000; Kishan and Opiela, 2000; Peek and Rosengren, 2013; Morck et al., 2019) and continue to find evidence in favor of an impact of the pandemic on bank riskiness and primarily in case of Islamic windows. We also categorize the response of banks based on policy measures undertaken by countries and once again find evidence which suggests that Islamic banks and especially Islamic windows raised their riskiness in response to the pandemic. Collectively, it appears that Islamic banks and windows increased their riskiness to a much greater extent as compared with their conventional counterparts, after taking into account bank-, country- and other related factors.
2. Literature
Research on various facets of COVID-19 continues to evolve over the past couple of years. Without loss of generality, the available evidence has expanded in two major directions. The first line of analysis examines the policy responses to the pandemic. Thus, Caballero and Simsek (2020) show that COVID-19 leads to a contraction in asset valuation. Using cross-country data, studies find that such massive shocks typically depress economic activity and lower natural rates of interest (Barro et al., 2020; Jorda et al., 2020). From a macroeconomic standpoint, Elgin et al. (2020) develop an economic stimulus index using the fiscal, monetary and exchange rate measures employed by central banks during the pandemic and correlate it with country characteristics. Their findings suggest that the size of the stimulus is larger for countries with higher GDP per capita, ceteris paribus.
Another stream of thinking examines the impact of the pandemic on the banking and corporate sectors. The evidence reflects that firms with prior experience in tackling stress episodes were able to effectively address the after-effects of the pandemic (Hassan et al., 2020). Utilizing daily data on S&P-500 index (as a proxy for US financial market volatility), Albulescu (2021) documents that financial market volatility is exacerbated with an increase in the number of global and US reported COVID-19 cases and is particularly pronounced when fatality rates increase. Bartik et al. (2020) find that US firms located in communities that were hit hardest by COVID-19 exhibited much larger lending increases from their banks.
Several studies have also examined how financial markets responded to the pandemic (Gormsen and Koijen, 2020; Landier and Thesmar, 2020). Using daily data on US firms, Ramelli and Wagner (2020) show that the cumulative stock returns of firms that were more exposed to China gradually retreated as the situation appeared to improve in the country. Within a statistical framework, Zhang et al. (2020) document how the strength of the stock market reaction in each country is dependent on the severity of the pandemic outbreak in that country. Demirguc-Kunt et al. (2021) combine daily stock price data for banks and non-bank financial companies within a cross-country setup and show that the adverse impact of the pandemic was much more pronounced on the banking sector.
We complement the existing evidence in a few distinct ways. First, we provide evidence regarding the effect of COVID-19 on bank profitability and risk. Related research has explored the impact of the pandemic on various facets of bank behavior. For example, using data on over 100 banks across 28 jurisdictions, Aldasoro et al. (2020) show that credit default swap spreads increased significantly, being the highest at over 200 basis points in case of emerging markets and additionally, sell-offs were highest for banks with weak capital positions. Utilizing a sample of over 5,000 banks at end-2019, Lewrick et al. (2020) find that after accounting for capital depletion due to the pandemic, only 10% of the US $2.7tn of the potential buffers would be available to support lending. Relatedly, Drehmann et al. (2020) also examine the role of capital buffers and their usefulness as a prudential policy tool in the context of broader policy levers comprising fiscal and monetary policies. Other studies examine the contagion risk on the banking sector (Daly et al., 2020) and show that the correlation is particularly strong between the US and UK banking systems. Rizwan et al. (2022) focus on the evolution of systemic risk of listed banks in ten countries with significant Islamic banking presence and show that the systemic risk of Islamic banks was of similar magnitude as compared with conventional counterparts. Unlike their analysis, we focus on a larger set of countries and exploit the heterogeneity in the first reported coronavirus case across country with banks' balance sheet reporting date to ascertain the impact on risk and return. The findings suggest that there is a notable impact on the former, whereas the impact on profitability is muted.
Second, the analysis makes a distinction between Islamic and conventional banks (Kammer and an IMF Staff Team, 2015). On the liabilities side, these banks raise funds from depositors/investors (termed, investment account holders, IAH) and therefore have quasi-equity obligations to their IAH. Likewise, on the asset side, consistent with Sharia'h practices, their financing is either asset-backed or asset-based. In addition, several conventional banks have Islamic windows, which offer Sharia'h-compliant products, over and above the conventional ones. Under this framework, the conventional ex ante interest rate is replaced by the ex-post PLS rate (Chong and Liu, 2009) in order to encourage these banks to invest in long-term projects (Mills and Presley, 1999) and promote social justice (Berg and Kim, 2014). Solarin et al. (2018) argue that under Islamic setup, banks and borrowers are involved in venture financing. Studies have explored several facets of Islamic banking. Using cross-national data, Cihak and Hesse (2008) report that large Islamic banks performed relatively better as compared with their conventional counterparts during the global financial crisis. Ismal and Hidayat (2016) and Zhang and Zoli (2016) explored the relevance of macroprudential policies for these banks. Other studies highlighted the relevance of loan-to-value and debt-to-income ratios in Asian economies with significant Islamic banking presence such as Malaysia and Indonesia (Zhang and Zoli, 2016). Yet others examine the drivers of growth of Islamic banks, both at the cross-country level (Cham, 2018; Iqbal et al., 2022) or for individual countries (Rafay and Farid, 2019; Miyajima, 2020).
Third, our analysis is a contribution to the literature on Islamic windows, an area where research has been limited, presumably owing to paucity of data. Only a handful of studies have explored this aspect in some detail. Using country-level data, Mokhtar et al. (2006) report that although Islamic banks tend to have higher efficiency levels as compared with their window counterparts, this finding is reversed for foreign banks. Utilizing data on Malaysian banks, Kamaruddin et al. (2008) observe that Islamic banks and Islamic windows are relatively more efficient in controlling costs (average cost inefficiency was 28%) rather than generating profits (average profit inefficiency was 37%). Abdul-Majid et al. (2011) document no perceptible differences in cost efficiencies between domestic, publicly-owned and foreign banks with Islamic windows although for the last category, those without windows exhibit higher cost efficiencies as compared with the former two categories. Thereafter, using cross-national data for 2000–2011 for countries with substantial Islamic presence, Doumpos et al. (2017) found that Islamic windows exhibit higher profitability and greater efficiency as compared with their conventional and Islamic counterparts. Chenguel et al. (2019) examine the impact of Islamic product offerings by conventional banks and indicate that the provision of such products improves bank performance. As compared with these studies, we focus on whether Islamic windows exhibit a differential response to the pandemic, after controlling for economic, financial and other relevant factors.
Penultimately, we explore the relevance of bank characteristics on risk and returns, and in particular, for Islamic banks and Islamic windows. The growth of Islamic windows as an integral part of banking has been widely noted in recent research (Abedifar et al., 2015). Borrowing from the monetary literature, we categorize banks according to their size, liquidity and capital position and re-estimate the model to investigate the impact of COVID-19. In our case, the findings suggest that Islamic banks and banks were Islamic windows were differentially affected by the pandemic, depending on their capital and liquidity position.
Finally, we examine the behavior of banks in response to the pandemic across countries with different policy responses, which is an evolving area of research. Focusing on a larger set of countries, Demirguc-Kunt et al. (2021) show that borrower assistance measures exerted a salutary impact on banks as compared with measures such as asset purchases. In the case of Euro Area banks, Altavilla et al. (2020) investigate the effectiveness of the policy responses and find that the micro- and macro-prudential relief measures complemented monetary policy action in supporting bank lending activity. In contrast, our analysis is broader in scope in the sense that it examines the response of banks to the pandemic across countries with varying policy responses and shows that there is a differential impact for Islamic banks especially those with Islamic windows.
3. Data and empirical strategy
We utilize three major categories of data. The first is at the bank-level, the second is at the banking industry level and the third is at the country level.
3.1 Bank-level data
The bank-level data is sourced from The Banker. In July every year, The Banker Database publishes a list of the top 1,000 global banks, ranked according to their tier-I capital. The database provides, inter alia, the country and region to which the bank belongs, the financial position of banks such as total assets, tier-I capital and loan-to-asset ratio. On the income side, it provides information on return on asset, return on capital, loan-to-deposit and the cost-income ratio. As regards risk, the data provides two variables: the non-performing loan ratio and the risk-weighted asset ratio. We employ the latter for purposes of analysis, consistent with prior research (Shrieves and Dahl, 1992; Van Roy, 2008; Berger et al., 2014; Turk-Ariss, 2017). Besides its forward-looking nature, this choice is dictated by the fact that our focus is on the largest global banks for whom not only credit risk, but other categories of risks are also equally pertinent. In addition, the database provides the balance-sheet date of the bank [3].
Using previous versions of the same database, we also identify whether a bank is Islamic and alternately, whether it operates an Islamic window (IW). In the sample, 3% of the banks are Islamic and 1% of them have an Islamic window.
Relatedly, we also utilize the Financial Stability Board database to extract information on whether a bank is a global systemically important bank (G-SIB). We employ the most recent available (November 2019) version (which is computed based on end-2018 data), that takes on board the changes that have taken place over the period. This includes a total of 30 banks, all of which constitute part of the top 1,000 database. Of these, eight are from the USA, four each from France and China, three each from the UK and Japan, two each from Canada and Switzerland and one each from Germany, Italy, Netherlands and Spain.
3.2 Banking industry data
At the industry level, we use data on deposit insurance. This is a binary variable which equals one if a country has explicit deposit insurance in place, else zero. We use the latest available data reported by Demirguc-Kunt et al. (2014) which takes into account the changes during the period.
3.3 Country-level data
At the country level, we use two pieces of data. The first is economic and financial data on country-level variables such as per capita GDP, domestic private credit, inflation and other related variables related to legal origin, type of government, monetary policy and supervisory practices. Information on these variables is obtained from manifold sources such as the World Bank, central bank websites, bank regulation and supervision database (Anginer et al., 2019) and legal origin database (La Porta et al., 1998).
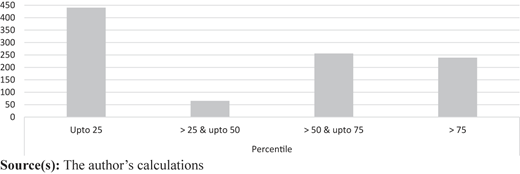
The second is data on the first COVID-19 case reported in the country. Data on this variable is sourced from the World Health Organization (WHO) website. Using this variable and taking on board the balance sheet reporting date of the bank, we construct a variable, defined as the number of days between the first reported COVID-19 case in the country less the balance sheet reporting date for the concerned bank in that country. A negative value of this variable would indicate that the first reported COVID-19 case in the country occurred before the bank balance sheet finalization date, reverse would be the case if this variable is positive. We normalize this by the maximum value of the variable, so that the final variable (Gap) ranges between −1 (minimum) and 1 (maximum). Since the pandemic evolved over the course of 2019, the Gap variable captures its evolution from a tranquil to stress situation. Using these values of Gap, we classify it into quartiles and bucket the number of banks that belong to each quartile [4]. Figure 1 shows that the majority of the banks belong to the first quartile (which also includes with negative values of Gap): in other words, there exists significant heterogeneity in the evolution of the first reported COVID-19 case and banks' balance sheet reporting date across countries.
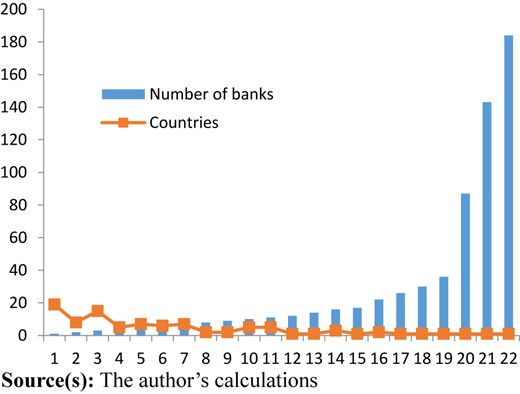
The following charts provide a snapshot of the database. The top 1,000 banks span across 94 countries, with a maximum of 184 banks from the USA; five countries account for nearly half of the total number of banks, 30% of total banking assets and 56% of total tier-I capital. For as many as 19 countries, only one bank features in the database (Figure 2 and Appendix).
In terms of region, the banks are spread across seven regions (Figure 3). East Asia and Pacific (EAP) account for 35% of the total number of banks and around 45% of total asset and tier-I capital. At the other end, Sub-Saharan Africa accounts for just over 2% of the number of banks; and less than 1% of total asset and tier-I capital.
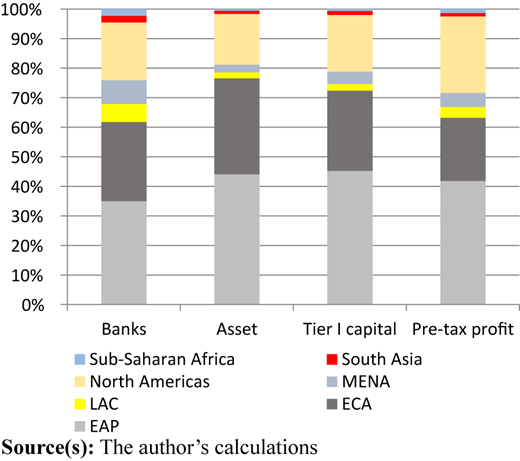
Table 1 provides the definitions, sources and the summary statistics of the key variables. To moderate outliers, all continuous variables are winsorized at the 1% level. Risk-weighted assets comprise roughly 63% of total assets on average, although the variability remains high. Return on Asset averages close to 1%, although for 24 banks this figure is negative.
Variable definitions and summary statistics
| Variable | Definition | Data source | N.Obs | Mean (SD) | Min (Max) |
|---|---|---|---|---|---|
| Dependent | |||||
| RWA | Risk weighted asset/Total asset | Banker | 958 | 0.626 (0.196) | 0.150 (1.062) |
| RoA | Net Profit/Total asset | Banker | 1,000 | 0.009 (0.008) | −0.007 (0.047) |
| Independent | |||||
| Gap | (Number of days between the first reported Covid case in the country less balance sheet end date for the reporting banks in the country)/(Maximum number of days between the first reported Covid case in any country less balance sheet end date for the reporting banks in that country) | Wikipedia, Banker | 1,000 | 0.084 (0.186) | −0.223 (1.00) |
| Bank controls (Bank) | |||||
| Size | Ln(Total asset) | Banker | 1,000 | 10.378 (1.409) | 8.246 (14.520) |
| CAP | Total capital/Total asset | As above | 964 | 0.165 (0.053) | 0.084 (0.410) |
| LTA | Gross loan/Total asset | As above | 975 | 0.636 (0.149) | 0.176 (0.934) |
| LTD | Gross loans/Gross total deposits | As above | 923 | 0.964 (0.528) | 0.260 (4.840) |
| CIR | Cost-to-income ratio | As above | 992 | 0.512 (0.163) | 0.203 (0.933) |
| Islamic | Dummy = 1, if a bank is Islamic, else zero | Author calculations based on The Banker | 1,000 | 0.031 (0.173) | 0 (1.00) |
| IW | Dummy = 1 if a bank has a Islamic window, else zero | As above | 1,000 | 0.011 (0.104) | 0 (1.00) |
| GSIB | Dummy = 1, if a bank is a globally systemically important bank, else zero | BIS (2019) | 1,000 | 0.030 (0.171) | 0 (1.00) |
| Banking industry (Industry) | |||||
| DIS | Dummy = 1, if a country has explicit deposit insurance, else zero | Demirguc Kunt et al. (2014) | 1,000 | 0.768 (0.422) | 0 (1.00) |
| Country controls (Country) | |||||
| Ln PCGDP | ln (per capita GDP, base 2010) | World Bank | 995 | 10.024 (1.045) | 7.121 (11.436) |
| Credit | Domestic private credit/GDP | Author calculations | 888 | 1.273 (0.567) | 0.105 (1.922) |
| Openness | (Exports + imports)/GDP | World Bank | 996 | 0.695 (0.541) | 0.275 (3.191) |
| INFL | Annual percentage change in GDP deflator (We set to zero all observations for which inflation takes negative value and apply the inverse hyperbolic since transformation (INFL = Ln(INFL+ | Author calculations, akin to Arcand et al. (2012) | 995 | 1.179 (0.701) | 0 (3.328) |
| Policy initiatives | |||||
| Liquidity | Dummy = 1 if a country has provided liquidity support measures, else zero | IMF (2020a, b, c) and World Bank (2020) | 1,000 | 0.933 (0.250) | |
| Prudential | Dummy = 1 if a country has undertaken prudential measures, else zero | As above | 1,000 | 0.939 (0.239) | |
| Borrower | Dummy = 1 if a country has provided borrower support measures, else zero | As above | 1,000 | 0.820 (0.384) | |
| Asset purchase | Dummy = 1 if a country has undertaken asset purchase measures, else zero | As above | 1,000 | 0.468 (0.499) | |
| Policy rate | Dummy = 1 if a country has changed its policy rate, else zero | As above | 1,000 | 0.872 (0.334) | |
| Digital | Dummy = 1 if a country has undertaken measures to support digital activity, else zero | As above | 1,000 | 0.251 (0.434) | |
| Market functioning | Dummy = 1 if a country has undertaken measures to support market functioning, else zero | As above | 1,000 | 0.606 (0.489) | |
| Other controls (Other) | |||||
| Governance | Estimate of World Bank Governance Indicator based on six areas: Voice and accountability, Political stability, Government effectiveness, Regulatory quality, Rule of law and Control of corruption. We obtain an aggregate value of the indicator using these six areas and classify countries into four quartiles depending on whether the aggregate value is less than or equal to 25th percentile, greater than 25th and upto 50th percentile, greater than 50th and upto 75th percentile and finally, above 75th percentile | World Bank Governance Indicators | 999 | 2.478 (1.119) | 1.00 (4.00) |
| Supervision | Dummy = 1 if bank supervision is with central bank, else zero | Anigner et al. (2019) | 1,000 | 0.506 (0.500) | |
| Interest | Cumulative interest rate cut by the monetary authority/central bank in the past one year | Central bank website | 970 | −0.462 (1.189) | −12.00 (3.25) |
| Multiple | Dummy = 1, if the monetary authority/central bank has resorted to multiple interest rate cuts during the past one year, else zero | As above | 970 | 0.539 (0.499) | |
| Legal | Legal origin of the country, according as French, English, German and Others (control category) | La Porta et al. (1998) | 1,000 | 2.214 (0.861) | 1.00 (4.00) |
| Parliamentary | Dummy = 1, if a country has parliamentary type of government, else zero | World Factbook, Central Intelligence Agency | 1,000 | 0.346 (0.476) | 0 (1.00) |
| Presidential | Dummy = 1, if a country has presidential or semi-presidential type of government, else zero | As above | 1,000 | 0.374 (0.484) | 0 (1.00) |
| Others | Dummy = 1, if a country has any type of government which is neither Parliamentary or Presidential (control category) | As above | 1,000 | 0.280 (0.449) | 0 (1.00) |
| Region | Dummy for different regions, based on World Bank classification. These include, East Asia and Pacific (control category), Europe and Central Asia, Latin America and Caribbean, Middle East and Central Asia, North Americas, South Asia and Sub-Saharan Africa | World Bank | 1,000 | 2.661 (1.727) | 1.00 (7.00) |
Source(s): The author's calculations
Among the bank-level controls, the natural logarithm of asset is 10.4 on average. Banks are well-capitalized and exhibit high liquidity levels as reflected in their high average loan-to-deposit (LTD) ratio of over 90%. At the industry level, just over 75% of countries have explicit deposit insurance. The cost-to-income is the ratio of operating expense to operating income and has been employed as a measure of efficiency (Borio et al., 2017).
Among the other controls, we find that the average value of the governance indicator is 2.5. In 50% of the countries, bank supervision rests with the central bank. We also take into account the monetary developments during the year including interest rate changes as well as the possibility of multiple interest rate changes. During the past one year, interest rates were cut by around 46 basis points on average and as many as 53% of the central banks resorted to multiple rate changes.
The correlation matrix in Table 2 shows that the Gap variable is positively correlated with profitability and negatively associated with risk. However, the correlations are modest, ranging from 8–16%. Importantly, Islamic banks exhibit a positive correlation with measures of bank behavior, although they do not appear to display any such correlation with Islamic windows. To better assess the underlying relationship, we specify an econometric framework to examine the importance of the key variables.
4. Econometric methodology and results
We begin with regressions with profitability and risk as dependent variables and bank characteristics, banking industry feature and other relevant economic and financial controls as independent variables. For bank b in country c and region r, we run regressions of the following form:
In Eq.(1), y is the response variable, which is either return on asset (RoA) or risk-weighted asset ratio (RWA), Bank-, Industry-, Country- and Other are the bank-specific, industry-level, country-level and other variables that are likely to influence the outcome variable, ηc and νr are country- and region-fixed effects that account for unobservable at the country and region levels and finally, ε is the idiosyncratic error term.
The key coefficients are δo and its interaction with Islamic and IW, respectively. More specifically, δo captures the average effect of COVID-19 on bank behavior: provided the pandemic exerts a perceptible impact on the outcome variable, this coefficient would be statistically significant. Intuitively, a negative value of this variable would impel banks to take this aspect on board in their lending decisions, so that its risk-weighted asset could be affected, although the impact on profitability is not obvious, a priori.
Similarly, γ1 and γ2 focus on the differential effect of the pandemic on the behavior of Islamic banks and Islamic windows, respectively. A statistically significant coefficient for γ1 and γ2 would suggest that the pandemic exerts a discernible impact on the behavior of Islamic banks and relatedly, on Islamic windows. Since the financial transactions for Islamic entities are typically asset-backed or asset-based, a downturn in asset prices following the pandemic could lead such entities to cut back their risk and provided it lowers profitability as well, γ1 and γ2 are likely to be negative. Throughout, we present the results with robust standard errors. The overall effect of Islamic banks (resp, Islamic windows) on bank behavior during the pandemic can be computed as:
Since the number of banks vary by country, following prior research (Claessens et al., 2001; Hermes and Lensink, 2004; Hassan et al., 2020), we employ the weighted least square (WLS) approach, where the weights are the inverse of the number of banks in that country.
Table 3 presents the regression results. In column (1), the coefficient on Gap and its interaction terms are not statistically significant, suggesting no discernible impact of the pandemic on either bank profitability or risk, either directly or indirectly. One way to interpret these findings would be to suggest that in most cases, banks would have finalized their income statements before the pandemic erupted in the country, thereby obviating any possible impact. Column (2) includes additional controls and finds limited evidence in favor of any impact of the pandemic on bank risk. In column (3), we examine potential non-linearities in the relationship, but we do not find any compelling evidence in favor of the same.
Impact of pandemic on bank behavior
| (1) | (2) | (3) | (4) | (5) | (6) | |
|---|---|---|---|---|---|---|
| Dep var = RoA | Dep var = RWA | |||||
| Gap | 0.00009 (0.0009) | 0.0004 (0.0009) | 0.0003 (0.0009) | −0.006** (0.003) | −0.006** (0.003) | 0.008** (0.004) |
| Islamic | 0.0002 (0.005) | 0.0002 (0.005) | 0.003 (0.017) | −0.116** (0.056) | −0.115** (0.057) | −0.163* (0.085) |
| IW | 0.001 (0.003) | 0.0008 (0.003) | −0.029 (0.042) | −0.167*** (0.071) | −0.165** (0.075) | 1.061* (0.608) |
| Gap*Islamic | 0.00005 (0.00009) | 0.00005 (0.00009) | −0.0001 (0.0009) | −0.002* (0.001) | −0.002* (0.001) | −0.004 (0.003) |
| Gap*IW | −0.00005 (0.00006) | −0.00002 (0.00006) | 0.002 (0.002) | −0.003** (0.001) | −0.004** (0.002) | −0.065** (0.032) |
| Sq.(Gap)*Islamic | 0.185 (1.083) | −2.151 (11.556) | ||||
| Sq.(Gap)*IW | −2.317 (3.162) | 93.226** (44.862) | ||||
| Size | −0.0006*** (0.0002) | −0.0006*** (0.0002) | −0.0006** (0.0002) | −0.035*** (0.004) | −0.033*** (0.004) | −0.034*** (0.004) |
| CAP | 0.028*** (0.009) | 0.027*** (0.009) | 0.027*** (0.009) | −0.930*** (0.152) | −0.945*** (0.153) | −0.946*** (0.153) |
| LTA | 0.0009 (0.002) | 0.0008 (0.002) | 0.0008 (0.002) | 0.216*** (0.054) | 0.209*** (0.054) | 0.208*** (0.054) |
| LTD | −0.0002 (0.0008) | −0.0002 (0.0008) | −0.0002 (0.0008) | 0.010 (0.021) | 0.011 (0.021) | 0.011 (0.021) |
| CIR | −0.023*** (0.003) | −0.023*** (0.003) | −0.022*** (0.003) | −0.119** (0.055) | −0.119** (0.056) | −0.120** (0.056) |
| DIS | −0.0007 (0.001) | 0.014 (0.021) | 0.014 (0.021) | −0.024 (0.027) | 0.095 (0.234) | 0.098 (0.235) |
| GSIB | 0.001 (0.0009) | 0.001 (0.0009) | 0.001 (0.0009) | 0.038* (0.020) | 0.034* (0.020) | 0.034* (0.020) |
| Ln PCGDP | −0.001 (0.0009) | 0.005 (0.006) | 0.005 (0.006) | −0.316 (0.200) | 0.156 (0.118) | 0.156 (0.119) |
| INFL | 0.028 (0.022) | 0.028 (0.022) | 0.028 (0.022) | 0.384 (0.392) | 0.356 (0.392) | 0.353 (0.393) |
| Openness | −0.005** (0.002) | −0.011 (0.015) | −0.011 (0.015) | −0.327 (0.259) | −0.246 (0.283) | 0.245 (0.284) |
| Credit | −0.037 (0.029) | −0.026 (0.029) | −0.026 (0.029) | 0.493 (0.508) | 0.128 (0.161) | −0.127 (0.162) |
| Interest | −0.002 (0.004) | −0.003 (0.004) | 0.025 (0.031) | 0.025 (0.032) | ||
| Multiple | −0.004 (0.011) | −0.004 (0.011) | 0.027 (0.059) | 0.026 (0.059) | ||
| Supervision | 0.031 (0.031) | 0.030 (0.032) | −0.110 (0.158) | −0.111 (0.158) | ||
| Governance: Q2 | 0.011* (0.006) | 0.011** (0.005) | 0.476 (0.647) | 0.471 (0.649) | ||
| Governance: Q3 | 0.015 (0.016) | 0.070 (0.072) | 0.077 (1.015) | 0.068 (1.017) | ||
| Governance: Q4 | 0.006 (0.008) | 0.006 (0.008) | −0.313 (0.497) | −0.317 (0.498) | ||
| Legal_France | −0.053 (0.057) | −0.053 (0.057) | −0.115 (0.403) | −0.111 (0.404) | ||
| Legal_English | −0.028 (0.025) | −0.028 (0.025) | −0.296 (0.485) | −0.293 (0.487) | ||
| Legal_German | −0.021 (0.019) | −0.021 (0.019) | −0.513 (0.943) | −0.505 (0.946) | ||
| Parliamentary | −0.047 (0.051) | −0.047 (0.052) | −0.224 (0.343) | −0.220 (0.385) | ||
| Presidential | −0.046 (0.051) | −0.046 (0.051) | −0.321 (0.379) | −0.317 (0.381) | ||
| Constant | 0.054*** (0.021) | 0.004 (0.023) | 0.004 (0.023) | 3.078** (0.849) | −0.735 (1.204) | −0.733 (1.206) |
| Gap threshold | 0.0003 | |||||
| Country FE | Y | Y | Y | Y | Y | Y |
| Region FE | Y | Y | Y | Y | Y | Y |
| Observations | 782 | 765 | 765 | 778 | 761 | 761 |
| R-sq | 0.7113 | 0.6882 | 0.6883 | 0.7913 | 0.7436 | 0.7439 |
Note(s): Robust standard errors in parentheses
***p < 0.01; **p < 0.05; *p < 0.10
Weights are inverse of number of banks in each country
Source(s): The author's calculations
As compared to this, the evidence across columns (4)–(6) show that the coefficient on Gap is negative and statistically significant and thus, there was an overall cutback on risk during the pandemic. In addition, the coefficients on both Islamic banks and Islamic windows are negative as well. In terms of magnitude, the point estimates in column (4) show that Islamic banks cut back their risk by 12% and Islamic windows by 16.7%.
The point estimates in column (4), evaluated at the mean value of Gap indicate that Islamic windows lowered their risk even further, by 17% (=−0.167–0.003*0.084), while for Islamic banks, the magnitude of such reduction is smaller, of the order of 12%. Similar evidence is reflected in column (5) which includes additional controls, over and above those already included in column (4). Finally, column (6) explores the possibility of threshold effects. Accordingly, we include the interaction of the squared Gap with Islamic and Islamic windows as additional variables among the regressors (Arcand et al., 2012). The interaction of Gap*IW is negative, whereas Sq.(Gap)*IW is positive and these terms are both statistically significant. In other words, Islamic banks initially cut back on their risk during the pandemic, but increased it subsequently, after a threshold, indicative of a convex relationship.
The control variables indicate that profitability is lower for bigger banks, consistent with evidence which suggests that these banks face scale inefficiencies (Berger et al., 2014; Athanasoglou et al., 2008). A one standard deviation increase in size lowers profitability by 0.6% and risk by a much larger magnitude of 36%. The sign on capital variable is positive, and so these banks face lower predicted bankruptcy and funding costs, enabling them to maintain margins (Berger and Bouwman, 2013). Inefficiency has a negative sign and is statistically significant, as expected. There is also evidence to suggest that more open economies are typically less profitable. Intuitively, such economies are typically developed ones where bank competition is high, which could dampen profits.
Among the other controls, there does appear to be a positive effect of governance on the profitability of the banking sector. This is in line with evidence that supports the fact that better governance raises the standards of disclosure and transparency and facilitates relevant and timely information disclosure (Bertrand and Mullainathan, 2003; Armstrong et al., 2014).
With risk as the response variable, size has a negative sign, supporting the “concentration-fragility” hypothesis that concentrated banking systems are usually dominated by larger (and hence, “too-big-to-fail”) banks typically face lower funding costs, encouraging them to resort to riskier market-based activities (Laeven et al., 2014; Calice et al., 2021). Risk and capital are inversely related (Das and Ghosh, 2004; Van Roy, 2008) so higher capital beyond a threshold is associated with a lower risk appetite. We also find that GSIBs exhibit higher risks: on average, the risk-weighted assets of these banks are 4% higher as compared to their counterparts.
5. Robustness checks
5.1 Categorization of bank characteristics
We check the validity of the findings by considering additional robustness checks. As a result, we re-estimate the baseline model across different characteristics of the key variables. Thus, we categorize banks as large and small, depending on the in-sample median: banks with total assets higher than in-sample median are categorized as big; the remaining banks are classified as small. In a similar vein, we categorize banks as well-capitalized (resp., low-capitalized) if their capital-to-asset ratio exceeds (resp., is less than) the in-sample median and likewise, as having high (resp., low) liquidity if the loan-to-deposit ratio is higher (resp., lower) than the in-sample median. We control for all other bank-, country- and other relevant determinants of bank behavior, but report only the relevant coefficients of interest in Table 4.
Impact of pandemic across bank characteristics
| Big banks | Small banks | High capital | Low capital | High liquidity | Low liquidity | |
|---|---|---|---|---|---|---|
| (1) | (2) | (3) | (4) | (5) | (6) | |
| Panel A Dep var = RoA | ||||||
| Gap | −0.0002 (0.0008) | −0.0005*** (0.0001) | −0.001 (0.001) | 0.001** (0.0005) | 0.003 (0.004) | 0.0006 (0.0009) |
| Islamic | 0.008** (0.003) | 0.003 (0.007) | −0.0009 (0.004) | −0.008 (0.009) | −0.0007 (0.007) | 0.002 (0.005) |
| IW | −0.022 (0.023) | . | −0.0002 (0.002) | . | . | −0.002 (0.002) |
| Gap*Islamic | −0.0001 (0.00008) | −0.00005 (0.0002) | 0.00007 (0.00009) | 0.0002* (0.0001) | 0.00008 (0.0001) | −0.00003 (0.0001) |
| Gap*IW | 0.0007 (0.0009) | −0.00006 (0.0003) | −0.00003 (0.00006) | 0.00009 (0.0001) | 0.00004 (0.00009) | −0.00006 (0.00007) |
| Bank controls | Y | Y | Y | Y | Y | Y |
| Country controls | Y | Y | Y | Y | Y | Y |
| Other controls | Y | Y | Y | Y | Y | Y |
| Country FE | Y | Y | Y | Y | Y | Y |
| Region FE | Y | Y | Y | Y | Y | Y |
| Observations | 397 | 368 | 355 | 410 | 391 | 374 |
| R-sq | 0.6379 | 0.6930 | 0.6611 | 0.6778 | 0.5526 | 0.7214 |
| Panel B Dep var = RWA | ||||||
| Gap | −0.003 (0.026) | −0.009*** (0.002) | −0.004* (0.002) | −0.008 (0.023) | −0.039*** (0.014) | −0.016 (0.023) |
| Islamic | 0.043 (0.094) | −0.115 (0.091) | −0.113 (0.079) | −0.116*** (0.045) | −0.139* (0.067) | 0.009 (0.078) |
| IW | 0.419 (0.595) | . | −0.173*** (0.086) | . | . | −0.310*** (0.084) |
| Gap*Islamic | −0.002 (0.001) | 0.001 (0.002) | 0.002 (0.001) | 0.001 (0.001) | 0.003 (0.002) | −0.0007 (0.002) |
| Gap*IW | −0.021 (0.022) | 0.0003 (0.0008) | 0.003** (0.001) | −0.003 (0.002) | −0.001 (0.002) | 0.005** (0.002) |
| Bank controls | Y | Y | Y | Y | Y | Y |
| Country controls | Y | Y | Y | Y | Y | Y |
| Other controls | Y | Y | Y | Y | Y | Y |
| Country FE | Y | Y | Y | Y | Y | Y |
| Region FE | Y | Y | Y | Y | Y | Y |
| Observations | 396 | 365 | 354 | 407 | 391 | 370 |
| R-sq | 0.8043 | 0.6268 | 0.7205 | 0.7213 | 0.7531 | 0.7497 |
Note(s): Robust standard errors in parentheses
***p < 0.01; **p < 0.05; *p < 0.10
Weights are inverse of number of banks in each country
All specifications include the full set of control variables, but these are not included for brevity
Source(s): The author's calculations
Several findings are of interest in the table. First, there does not appear to be any perceptible impact of the pandemic on Islamic banks across size: the coefficients on the key variables are statistically insignificant in both columns (1) and (2). Second, the Islamic windows of well-capitalized banks lowered their riskiness, although, in response to the pandemic, there was an increase in riskiness, entailing a net effect of −0.17, mirroring the results for the overall sample. As compared to this, low capitalized banks appear to show an improvement in profitability in response to the pandemic. The results also show that Islamic banks cut back on their riskiness by nearly 12%, on average. Finally, as regards bank liquidity, the findings indicate that Islamic windows of low-liquid banks display a significant reduction in risk, although in response to the pandemic, their riskiness increased. In addition, highly liquid Islamic banks also cut back on their riskiness, presumably as a move to conserve capital.
Collectively, these findings indicate that the response to the pandemic was manifested primarily on bank riskiness and much less on bank profitability. More importantly, these results show that Islamic windows are the ones that increased their risk in response to the pandemic.
5.2 Categorization by policy initiatives
Second, it is well-recognized that countries undertook a wide battery of financial measures to support their financial systems during the pandemic (IMF, 2020d; World Bank, 2020). Borrowing from these sources, we enlist the policy measures undertaken by each country. We follow Demirguc-Kunt et al. (2021) but given our much larger set of countries, we classify the policy measures under a broader set of categories. These include: liquidity support to the financial sector, prudential measures (e.g. lower reserve requirements, ban on dividend distribution, flexibility in provisioning practices), borrower support (e.g. line of credit for SMEs, waiver of interest payments for individuals and business), asset purchases (e.g. corporate bond purchase, broadening the acceptable list of eligible collateral) and changes in policy interest rates by the central bank. These measures were employed by Demirguc-Kunt et al. (2021). In addition, we also take on board other measures which include promoting digital transactions (e.g. contactless transactions up to certain threshold, waiver of ATM and point-of-sale fees) and ensuring market functioning (e.g. support for wholesale funding markets, easing of restrictions on foreign investment in listed companies).
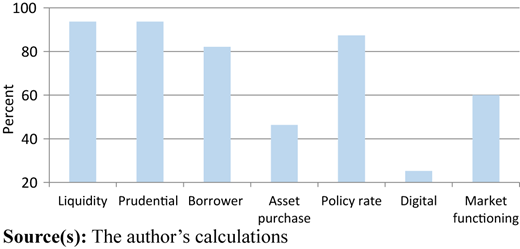
Figure 4 shows the percentage distribution of these measures. Liquidity and prudential measures were the most common, having been employed by over 90% of the countries. Among others, 87% of countries changed their policy rates and over 80% of countries undertook measures to support borrowers. Much less prominent were measures related to asset purchases and promoting digitization, the latter being used mainly in emerging and developing economies. In terms of frequency distribution of measures by countries, 66 countries (70% of sample) undertook four or more measures and on the other hand, five countries undertook just one measure [5].
To investigate this further, we run a similar regression as earlier, but unlike the previous categorization, examine the response of Islamic banks and Islamic windows in terms of the policy measures undertaken. The regressions control for all bank-, country- and other relevant factors, but these are not reported for brevity and instead, we report only the relevant coefficients in Table 5.
Impact of pandemic on banks across policy initiatives by countries
| Liquidity support | Prudential measure | Borrower support | Asset purchase | Policy rate | Digital | Market functioning | |
|---|---|---|---|---|---|---|---|
| (1) | (2) | (3) | (4) | (5) | (6) | (7) | |
| Panel A Dep var = RoA | |||||||
| Gap | 0.0006 (0.0008) | 0.0003 (0.0009) | 0.0003 (0.0008) | 0.0003 (0.0008) | 0.0004 (0.0007) | −0.003 (0.004) | 0.002** (0.0005) |
| Islamic | −0.0006 (0.005) | −0.001 (0.007) | 0.004 (0.003) | . | −0.0006 (0.005) | 0.003 (0.005) | −0.004 (0.008) |
| IW | 0.001 (0.003) | 0.003 (0.005) | −0.002 (0.003) | . | 0.001 (0.003) | −0.003 (0.005) | . |
| Gap*Islamic | 0.0008 (0.00009) | 0.00005 (0.0001) | −0.00003 (0.00006) | 0.0001 (0.0002) | 0.00008 (0.00009) | −0.00001 (0.00009) | 0.0002 (0.0002) |
| Gap*IW | −0.0005 (0.0006) | −0.00006 (0.0001) | −0.00005 (0.00006) | . | −0.00005 (0.00006) | −0.00006 (0.0001) | 0.00003 (0.00008) |
| Bank controls | Y | Y | Y | Y | Y | Y | Y |
| Country controls | Y | Y | Y | Y | Y | Y | Y |
| Other controls | Y | Y | Y | Y | Y | Y | Y |
| Country FE | Y | Y | Y | Y | Y | Y | Y |
| Region FE | Y | Y | Y | Y | Y | Y | Y |
| Observations | 754 | 739 | 667 | 435 | 735 | 195 | 539 |
| R-sq | 0.6151 | 0.6300 | 0.6100 | 0.6092 | 0.6146 | 0.8709 | 0.5957 |
| Panel B Dep var = RWA | |||||||
| Gap | −0.007 (0.029) | −0.017 (0.030) | −0.007 (0.028) | −0.015 (0.030) | −0.008 (0.029) | −0.025 (0.043) | −0.029 (0.028) |
| Islamic | −0.113* (0.065) | −0.092 (0.084) | −0.195*** (0.051) | . | −0.109* (0.065) | −0.102 (0.071) | −0.133 (0.096) |
| IW | −0.165** (0.076) | −0.285*** (0.077) | −0.088 (0.059) | . | −0.166** (0.076) | −0.171* (0.093) | . |
| Gap*Islamic | 0.002* (0.001) | 0.001 (0.001) | 0.003*** (0.001) | −0.0002 (0.0005) | 0.002** (0.001) | 0.001 (0.001) | 0.003 (0.002) |
| Gap*IW | 0.002* (0.001) | 0.004*** (0.001) | 0.001 (0.001) | . | 0.002* (0.001) | 0.003 (0.002) | −0.005*** (0.001) |
| Bank controls | Y | Y | Y | Y | Y | Y | Y |
| Country controls | Y | Y | Y | Y | Y | Y | Y |
| Other controls | Y | Y | Y | Y | Y | Y | Y |
| Country FE | Y | Y | Y | Y | Y | Y | Y |
| Region FE | Y | Y | Y | Y | Y | Y | Y |
| Observations | 751 | 735 | 664 | 435 | 731 | 195 | 536 |
| R-sq | 0.7243 | 0.7272 | 0.7270 | 0.7352 | 0.7307 | 0.7291 | 0.7146 |
Note(s): Robust standard errors in parentheses
***p < 0.01; **p < 0.05; *p < 0.10
Weights are inverse of number of banks in each country
All specifications include the full set of control variables, but these are not included for brevity
Source(s): The author's calculations
Two general findings are of relevance. Firstly, the direct impact of COVID-19 on bank profits and risk is muted in most cases. Only in case of countries that adopted market functioning measures, the evidence supports a positive impact on profitability. Intuitively, streamlining market functioning eased bottlenecks in funding sources. Coupled with liquidity support, this unlocked potential impediments to the flow of credit, improving bank performance. Second, there is no evidence of any effect on profits of Islamic banks or windows, under any of the policy measures.
With bank risk as the dependent variable (Panel B), we report the following results. The coefficient on Islamic and IW is negative when statistically significant, which means Islamic banks and Islamic windows lowered their risk-taking across countries that undertook different policy measures. As compared to this, the interaction term has a positive coefficient in most cases, so that in response to the pandemic, Islamic banks and windows increased their risk across countries undertaking various policy measures. To take an example, note that the coefficient on IW in Column 2 (Panel B) is −0.28, while Gap*IW is negative with a point estimate of 0.004. Evaluated at the mean value of Gap, there was a decline in risk of the magnitude of 27% (=−0.28 + 0.004*0.08), although Islamic windows appear to have increased their risk, albeit marginally. The only exceptions are countries that undertook market functioning measures. In this case, in response to the pandemic, Islamic windows lowered their risk by roughly 0.5%. These results therefore add to the literature and show how the response of Islamic banks and Islamic windows evolved across countries that undertook different policy measures.
6. Concluding remarks
A significant volume of research examines the effect of the pandemic on different facets of the financial sector. An aspect which has largely remained unattended is its impact on the banking sector. Even within the banking sector, research has focused essentially on the behavior of bank equity prices. Not much attention has been devoted to analyzing the response of bank balance sheet related variables and even more importantly, on Islamic banks.
To address this, we assemble data on the largest global banks for 2019, comprising both conventional and Islamic (including Islamic windows), and integrate this with the staggered timing of the first reported coronavirus case in the country and examine the impact on their risk and returns. In this regard, we develop a measure of the difference between the first reported pandemic case and the balance sheet finalization date for a country.
Keeping in view the data limitations, we find that banks with such windows increased their riskiness in response to the pandemic, although there was not much impact on profitability. Segregating banks by their key characteristics, the results show that these findings were in evidence mainly for well-capitalized and less liquid banks. Besides, we also find that in most cases, Islamic banks, especially those with Islamic windows, raised their riskiness in response to the pandemic across countries that undertook different policy measures, although these magnitudes were not compelling.
From a practical standpoint, two observations follow. First, it is important to take a closer look at the behavior of Islamic windows. Typically across countries, Islamic windows are part of conventional banks as part of their overall functioning. In the process, it might lead to co-mingling of funds of the main (conventional) bank with that of the windows, especially in the use of current accounts. This could make it difficult to assess the risks faced by these institutions. Second, the analysis sheds light on the usefulness of policy measures. To be more specific, given the divergent initial conditions of countries in terms of their macroeconomic fundamentals and the health of the financial sector, measures adopted by one country might not necessarily prove effective in others. Viewed from this standpoint, the analysis provides insights as to which policy measures might prove typically effective during periods of crisis across countries with differing initial conditions.
Although our study exhibits several limitations, including potential endogeneity concerns and omitted variable bias, we believe that it furthers our understanding of the economics of the COVID-19 pandemic in two useful ways. First, as more bank-level data becomes available, such an analytical setup will help to better analyze the behavior of bank balance sheet variables during the pandemic. Second and equally relevant, it will help to better inform our understanding of how the behavior of Islamic banks evolved during the pandemic. These aspects can be addressed in future research, enabling to better inform the policy debate.
Notes
Initiated in 2011, “Our World in Data” is a non-profit organization based in the UK whose mission is to present research and data to make progress against the world's largest problems. All the pieces of online scientific information are freely available in an easily downloadable form.
The outlook for 2021 has been promising with leading pharmaceutical companies having begun delivering vaccines globally. Close to 5.5bn (over 70% of world population) have received at least one dose of Covid-19 vaccine. Reflecting these positives, global growth clocked 6% in 2021 (IMF, 2022).
Out of the 1,000 banks, 856 banks have end-December balance sheet reporting date. For the remaining banks, it ranges from end-February 2019 to end-March 2020.
The values of Gap at 25th, 50th and 75th are 0.059, 0.074 and 0.169, respectively.
See also Table 1.
References
Further reading
Appendix
List of countries, by region
| East Asia and Pacific | Europe and Central Asia | Latin America and Caribbean | Middle East and Central Asia | North Americas | South Asia | Africa |
|---|---|---|---|---|---|---|
| Australia | Austria | Argentina | Azerbaijan | Canada | Bangladesh | Angola |
| Brunei | Belarus | Bermuda | Bahrain | USA | India | Kenya |
| Cambodia | Belgium | Brazil | Egypt | Pakistan | Mauritius | |
| China | Bulgaria | Chile | Iran | Sri Lanka | Nigeria | |
| Hong Kong | Cyprus | Colombia | Iraq | South Africa | ||
| Indonesia | Czech Rep | Costa Rica | Israel | Togo | ||
| Japan | Denmark | Cuba | Jordan | |||
| Malaysia | Estonia | Dominican Rep | Kuwait | |||
| New Zealand | Finland | Ecuador | Malta | |||
| Papua and New Guinea | France | Guatemala | Oman | |||
| Philippines | Georgia | Mexico | Qatar | |||
| Singapore | Germany | Panama | Saudi Arabia | |||
| South Korea | Greece | Peru | Tunisia | |||
| Taiwan | Hungary | Puerto Rico | UAE | |||
| Thailand | Iceland | Trinidad and Tobago | ||||
| Vietnam | Ireland | Uruguay | ||||
| Italy | ||||||
| Kazakhstan | ||||||
| Liechtenstein | ||||||
| Luxembourg | ||||||
| Netherlands | ||||||
| Norway | ||||||
| Poland | ||||||
| Portugal | ||||||
| Romania | ||||||
| Russia | ||||||
| Serbia | ||||||
| Slovenia | ||||||
| Slovak Rep | ||||||
| Spain | ||||||
| Sweden | ||||||
| Switzerland | ||||||
| Turkey | ||||||
| UK | ||||||
| Ukraine | ||||||
| Uzbekistan | ||||||
| 16 | 36 | 16 | 14 | 2 | 4 | 6 |
Source(s): The author's calculations

