

This paper aims to determine whether Islamic banks (IBs) and conventional banks (CBs) in Tunisia are distinguishable from one another based on financial characteristics during the 2005–2014 period covering the 2008 global financial crisis (GFC) and the 2011 Tunisian revolution.
For the comparison between IBs and CBs, 11 hypotheses are formulated to distinguish between the two types of banks. The authors use a univariate analysis based on the multi-dimension figures investigation and a multivariate one based on the robust OLS technique for panel linear regression with mixed effects.
Bank-specific factors, dummy and dummy interacting variables indicate that there are differences between Islamic and conventional bank behavior. Both methods show that IBs are more liquid, more profitable and riskier than CBs. Post-2011 Tunisian revolution, small IBs (small CBs) are more (less) solvent, large IBs are more stable and both types of banks are more liquid, which explain why Tunisian governments have relay on bank system to cover budget deficits post-2011 revolution.
In investigating the feature of IBs and CBs from the Tunisian context, the authors take into account the effect of two abnormal events (2008 GFC and 2011 Tunisian revolution) on IBs through interaction variables.
1. Introduction
Since its independence, Tunisia has solely experienced conventional banking. While Islamic banking is spreading worldwide, it remains underdeveloped in North Africa and particularly in Tunisia. The situation has changed for Tunisia after the January 2011 revolution, and an Islamic finance regulatory system that covers Sukuk issuance, insurance and banking leasing was adopted by the end of 2012.
Currently, Islamic banking in Tunisia operates under a dual banking system in which Islamic banks (IBs) operate side by side with conventional banks (CBs). Islamic banking in Tunisia began with the first IB “Al Baraka Bank Tunisia” created in 1983, after receiving an offshore banking license, that has been transformed into a universal bank in December 2013. The second most developed one is the universal commercial bank, “Zitouna Bank,” established in October 2009, which implements the laws governing banking in Tunisia. The third is the regional office “Noor Islamic Bank,” which is a representative office from a financial institution based in Dubai. The fourth is the “Wifak Bank” created in 2015, following the transformation of the company “El Wifack Leasing” into a universal bank specialized in Islamic banking operations whose activity is governed by Law No. 2001-65 of July 10, 2001, on credit institutions.
The conventional system is essentially characterized by interest-based money lending, excessive speculation, the unconditional right to participate in any business and the disconnection between the real sphere and the financial one. Under a conventional financial system, every individual has an unconditional and absolute right to participate in any business to maximize profits (Imran, 2005). However, an Islamic system is based on ethical principles including the prohibition of interest rates, the interdiction of Gharar (excessive uncertainty), the interdiction of unethical activities (such as casinos, breweries or factories making pork products), the sharing of profit and loss principle and the “asset-backed financing.” Speculation is also unacceptable in Islamic finance because of its association with gambling and excessive risk-taking. The speculator will buy stock in anticipation of prices rising in a short-term horizon and sell it in anticipation of prices falling (Naughton and Naughton, 2000). Then, he trades not because of being a long-term investor, but because of a desire to make a quick gain from buying and selling. The danger of this, as observed by Brailsford and Heaney (1998), is that what is initially planned as a short-term position, may result in a longer-term position when the stock does not perform as expected.
In conventional finance, interest rate is regarded as the main tool for making profit, while for Muslim scholars, there is a consensus that interest is prohibited by Sharī‘ah law. Indeed, since the nominal interest is viewed as guaranteed gain, Islamic finance does not allow gain from financial activity unless the beneficiary is also subject to the risk of potential loss. In addition, as outlined by Abu Umar Faruq (2010), the Riba (interest rate) can reinforce the tendency for wealth to be accumulated in the hands of a few men, thereby diminishing human beings for their fellow. Hence, from the Islamic view, the accumulation of wealth through interest or usury is selfish behavior compared to the accumulation through hard work and personal activity.
ARABCCI (2008) addressed the differences between profit and loss-sharing principle (PLS) and interest-based systems. In Islamic banking system, all transactions are based on PLS. Returns are not fixed a priori; they depend on bank performance and are not guaranteed. Consumers can participate in the profit upside/downside in a more equitable way than receiving a predetermined return. Then, risk is shared among the borrower, lender and the IB. In the CBs, this PLS principle is not applied. Indeed, returns to depositors are fixed irrespective of bank performance and profitability. The customer as a depositor is like the lender in receiving a fixed rate of predetermined interest. Hence, unlike the Islamic system, the depositor gain cannot be subject to improvement performance. The conventional bank risks are fully transferred to others.
According to Khan (2010), equity finance is preferable to interest-based debt finance because once the venture fails; the borrower does not bear the entire cost alone or lose the collateral. If the venture succeeds, the financial investor receives a larger return than one allowed by a predetermined interest rate. In addition, in the conventional financial system, independent from fundamentals, major transactions are motivated by speculative intentions. Consequently, several disconnections will be created between the real and financial spheres. However, one of the most important characteristics of Islamic financing is that it is an asset-backed financing.
It is appropriate also to note here that after the recent economic and financial crisis of 2008, the question of the inadequacy between real and financial spheres has received considerable attention. Some proponents of Islamic finance claimed that such a financial crisis would be avoided if asset-backed Islamic finance was adopted (Farooq, 2009). To the 2008 GFC effect, the 2011 Tunisian revolution effect can be also investigated in the context of the Tunisian banking system.
For the Tunisia case, the feature of interest-free banks (IBs) versus CBs is still a fresh debate. However, several papers have analyzed some aspects related to the Islamic financial banks without considering the comparative sides to CBs (Beji, 2015; Central Bank of Tunisia, 2018; Echchabi et al., 2015; Thomson Reuters and Zawya, 2013; Taktak and Zouari, 2014). In our knowledge, this paper is the first paper which aims to contribute to the empirical comparative literature by investigating on a sample of 16 Tunisian banks (14 conventional and 2 Islamic) over the period 2005–2014. We attempt to feel several gaps, which need to be overcome. Particularly, our study investigates the differences between IBs and CBs in terms of financial characteristics. Eleven hypotheses will be investigated.
profitability;
liquidity;
insolvency risk;
stability;
capitalization (or solvency);
impact of the 2008 GFC on IBs;
the effect of the 2011 Tunisian revolution on IBs;
(8) and (9)Islamic and conventional bank size effects;
(10)the share market effect; and
(11)the eleventh deals with the differences between the 2 major Tunisian IBs “Zitouna Bank” and “Al Baraka Bank” evolution.
Two techniques will be considered. In the first stage, we give a univariate analysis based on a multi-dimension figures-based comparison. In the second stage, we run several panel linear static regression models based on the robust OLS techniques.
The remainder of this paper is organized as follows: Section 2 presents hypotheses development and literature review. Section 3 describes the data and variables definition (subsection 3.1). The univariate analysis (figures-based comparison) is the subject of subsection 3.2. The regression-based comparison methodology and findings are given in Sections 4 and 5, respectively. Section 6 concludes the paper.
2. Literature review and hypothesis development
In view of the rapid growth of Islamic banking, recent researches have examined and compared different aspects [including profitability, liquidity, risk, stability, capitalization, 2008 GFC effect, 2011 Tunisian revolution effect, size effect, share market effect and bank variation] of these banks and conventional ones using financial ratios (Khan et al., 2018; Alqahtani and Mayes, 2018; Salih et al., 2018).
In this paper, 11 hypotheses will be investigated in the context of the Tunisian banking system.
The first hypothesis is about bank profitability. The return on assets (ROA) and the return on equity (ROE) are the most used measures for bank profitability in the financial literature.
The majority of previous studies reported that IBs achieve higher records of profitability compared to CBs. For example, Samad and Hassan (2000) concluded that IBs outperform conventional banks in Malaysia (Karim and Ali, 1989; Rosly and Bakar, 2003). They suggested that GCC IBs may be more profitable than GCC banks. Later, Alkassim (2005) attempted to see if internal characteristics may explain the difference in profitability between Islamic and conventional banks in the GCC between 1997 and 2004. Also, concerning GCC countries, Olson and Zoubi (2008) confirmed that IBs are more profitable, and they argued that the PLS of the saving deposits depends on future profits despite the fact that the expected returns are similar to those of conventional saving deposits of the same maturity.
Metwally (1997) and Ahmad and Hassan (2007) reported different results. Ahmad and Hassan (2007) showed that both types of banks have almost similar ROE and ROA in Bangladesh. Recently, using mixed-effect linear regression, Salih et al. (2018) showed that only the CBs in the GCC region have sustained a better performance over the 2006–2012 period in relation to efficiency and return on assets.
Hence, the first hypothesis is formulated as follows:
IBs are more profitable than CBs.
The second hypothesis is about liquidity, which is frequently measured by liquidity ratios, cash to assets ratio and the cash to deposits ratio (CTA and CTD).
There is a consensus among scholars that IBs have usually excessive liquidity due to inadequate investment opportunities (Basu et al., 2015). On the liability side of the balance sheet, IBs receive deposits based on profit and loss sharing (PLS) on which they have to pay profit. On the other hand, they invest those funds on the asset side. Due to limited investment opportunities, they have high liquid assets, so liquidity risk is very low. Therefore, IBs expose themselves to credit risk by extending loans through Murabaha and Ijarah in order to generate more profits, but the overall default risk would still be in control. A bank with low liquidity/credit risk controls both risks jointly as it reflects a very limited overall risk of instability (Imbierowicz and Rauch, 2014). IBs are found to be better than conventional ones in managing credit and liquidity risks (Kabir et al., 2018). Hence, the second hypothesis is formulated as follows:
IBs hold higher liquidity than CBs.
The third hypothesis is about credit and insolvency risks. The mainly used indicators are 4 of credit risk [the ratio of loan loss reserves to gross loans (LLR), non-performing loans to gross loans (NPL), loans to assets (LTA) and loans to deposits (LTD)] and 2 ratios for insolvency risk [deposits to assets (DTA) and Z-score].
Beck et al. (2013) compared the business orientation, efficiency and stability of conventional and Islamic banks. They showed that IBs had significantly lower credit risk using the mean of Z-scores. Based on NPL as a proxy for asset quality, Beck et al. (2013) found that the NPLs of IBs were consistently lower, suggesting lower credit risk in IBs. However, when other factors were controlled, most of the results showed no significant difference between the two banking systems. In assessing credit risk in IBs and using Merton's distance-to-default (DD) model, Boumediene (2011) concluded that IBs have relatively lower credit risk along with a lower probability of default. Other studies confirmed that CBs are more solvent and generated less risks, whereas IBs were found to be riskier (Hasan and Dridi, 2010; Haddad et al., 2019; Rachman et al., 2018).
Hence, the third hypothesis is as follows:
IBs are less risky than CBs.
The most used indicator for comparison of stability is the Z-score. The forth hypothesis will be about stability.
Following the seminal work of Čihák and Hesse (2010), several other studies compared the relative stability of Islamic and conventional banks in different periods and across different countries (Gamaginta and Rokhim, 2011; Abedifar et al., 2013; Beck et al., 2013). Some of them concluded that IBs are more stable, while others found no evidence differences in credit risk across the alternative banking systems.
Čihák and Hesse (2010) analyzed the financial stability of 19 banking systems composed of 77 Islamic banks and 397 conventional ones. They found that, between 1993 and 2004, small IBs tended to be more stable than small CBs, while large CBs tended to be more stable than large IBs, and, in all, the small IBs tended to be more stable than the large CBs. They also showed that IBs are more exposed to difficulties in management, and the increase of the market share of Islamic banking has no significant influence on the stability of the other banks. However, the more the IBs market share grows, the less stable they tend to be.
For 16 countries including ten countries in the MENA region and six countries in Southeast Asia, Rajhi and Hassairi (2014) analyzed financial stability for a total of 467 CBs and 90 IBs between 2000 and 2008. They showed that the average levels of the stability of IBs measured by the proxy Z-scores are higher than CBs except for small IBs.
Later, using a sample of 76 banks across six economies of the GCC region from 2000 to 2013, Alqahtani and Mayes (2018) evaluated also the financial stability prior to, during and after financial shocks. They found that large IBs exhibited weaker financial stability than CBs, highlighting their vulnerable resilience to shocks that spread over to real economic sectors.
Recently, Viphindrartin et al. (2021) considered the effects of bank-specific indicators on the stability of the Indonesian financial system. They concluded that credit has a positive and significant effect on long-term nonperforming loans.
Hence, the fourth hypothesis to be tested is as follows:
IBs are less stable than CBs.
Alkassim (2005) indicated that CBs were less profitable than IBs, and it is the higher capital ratios which favored IBs profitability.
Beck et al., 2010 compared the two types of banking and their performance across many countries. They concluded that both types of banking were affected by the crisis, but IBs which have higher capitalization coupled with higher liquidity reserves have better performance. Using ratio analysis, Parashar and Venkatesh (2010) compared conventional and Islamic banks performance in the GCC before and during the 2008 global financial crisis (GFC). They found that over the four-year period of analysis, from 2006 to 2009, IBs performed better than CBs in respect of profitability as indicated by higher average return on total assets and equity, and were higher capitalized as indicated by higher CAR ratio and higher equity to total assets ratio. Hence, the fifth hypothesis could be formulated as follows:
IBs are more capitalized than CBs.
After the subprime financial crisis, IBs got the attention of academics and scholars to investigate performance, stability and risk management practices in order to check differences with conventional financial system (Čihák and Hesse, 2010; Hasan and Dridi, 2010; Bedifar et al., 2013; Beck et al., 2013; Kabir et al., 2015). This stream of literature found that IBs have a lower credit risk, a better asset quality and are more stable as compared to CBs.
Hasan and Dridi (2010) examined the impact of the crisis on the profitability, credit and asset growth and external ratings of 120 Islamic and conventional banks in eight countries covering the period 2007–2010. They documented that IBs have been affected differently than CBs. They found that weaknesses in risk management practices in some IBs led to a larger decline in profitability in 2009 compared to CBs.
Gamaginta and Rokhim (2011) analyzed the stability of 12 Islamic banks and 71 conventional banks in Indonesia during the 2004–2009 period. Generally, the stability of Islamic banks is found to be lower than that of CBs except during the crisis period of 2008–2009. They also found that small IBs have the same level of stability as small CBs.
However, based on Z-score measure for a sample of 34 IBs and 34 CBs from 16 countries, Bourkhis and Nabi (2013), in investigating the stability during the 2007–2008 financial crisis, revealed that IBs are diverging from their theoretical business model, which would have allowed them to keep the same level of soundness even during the crisis. Hence, the sixth hypothesis is formulated as follows:
IBs are affected by 2008 GFC.
Despite the potential and the strong internal demand, the successive Tunisian governments before January 2011 did not try to push forward or promote the Islamic finance products among the population. For purely ideological reasons, the political authorities saw Islamic banking with suspicion before January 2011, because of its possible association with banned political parties (Beji, 2015).
The situation changed after January 2011, and an Islamic finance regulatory system was discussed to be adopted by the Parliament by the end of 2012, and a Sukuk law was approved later by the government in October 2014 to diversify the government's financing sources and to have an access to Islamic capital markets. Moreover, in July 2014, the National Constituent Assembly adopted a draft law regulating the insurance activities, which facilitate the creation of Takaful legislative framework. In addition, during 2015, a common draft law for both Islamic and conventional banks and financial institutions was issued. Furthermore, issues on banking establishment, operations, guarantee mechanism and depositor assets were discussed for the first time in a specific chapter within the mentioned draft law. Hence, the seventh hypothesis is formulated as follows:
IBs are affected by 2011 Tunisian revolution.
In classifying the banks as small or large, Čihák and Hesse (2010) examined financial stability using Z-scores across Islamic and conventional banks in 20 countries over the period 1994–2004. They present evidence that small IBs tend to be financially stable than larger IBs and small commercial banks, whereas large CBs were found to be stronger than large IBs. These results show that as IBs grow, risk management becomes more difficult, and this was because the credit risk monitoring systems in IBs became more complex when operated on a larger scale.
Bedifar et al. (2013) compared the credit and insolvency risk of 553 banks from 24 countries between 1999 and 2009, employing three different accounting ratios to measure credit risk and several forms of the Z-score to measure insolvency risk. Similar to Čihák and Hesse (2010), they found that small IBs were more stable than CBs. Hence, we formulate the eighth and ninth hypotheses as follows:
Small IBs have a different evolution than large IBs.
Small CBs have a different evolution than large CBs.
Beck et al., 2010 argued that CBs that operate in countries with a higher market share of IBs are more cost-effective but less stable.
Čihák and Hesse (2010) provided also a cross-country empirical evidence on the role of IBs in financial stability in 18 banking system and found that the market share of IBs does not have significant impact on the financial strength of the other banks. They further found that the bank's size has a bearing on its financial strength.
Hence, the tenth hypothesis is formulated as follows.
High share market IBs have a different evolution than CBs.
In 1999, “Bayt Al Tamwil El Saoudi Al Tounsi for Lease” was created as the first Islamic leasing company known as “BEST Lease.” In January 1st, 2010, the bank was renamed “Al Baraka Bank Tunisia,” and in 2011, it submitted its application to become a resident bank in order to provide services to local customers. In 2013, “Al Baraka Bank Tunisia” became the 22nd resident bank in the Tunisian banking system. “Al Baraka Bank Tunisia” is a subsidiary of “Al Baraka Banking Group” based in Bahrain, which owns 80% of its capital. The remaining 20% are owned by the Tunisian state (Chaabouni and Ghanoudi, 2013). In 2013, “Al Baraka Bank” increased its financings and investment portfolios by 7%. This result is achieved thanks to a rise by 24% to its Murabaha sales. Since 2014, “Al Baraka Bank Tunisia” has launched a set of new financing and deposit products including student financing and study accounts. In the same year, the bank opened five new branches including three exchange offices.
“Zitouna Bank” was founded by the President Ben Ali son's-in-law in May 2009, and opened to the public in May 2010. The second Islamic bank “Zitouna” is a domestic retail bank targeting the local market. Mobilizing the classic Islamic finance techniques such as Murabaha, Mudaraba and Ijara, the bank provides funding to real estate, equipment and tourist facilities (African Development Bank, 2011). In 2012, and after the revolution of January 2011, the Tunisian government took control and the direction of the bank. In order to facilitate exchange of expertise and to improve the microfinancing techniques and know-how, the bank signed in April 2014 an agreement with sub-Saharan Islamic banks including Guinea, Mauritania, Niger, Senegal and Sudan banks (Thomson Reuters and Zawya, 2013).
Hence, the eleventh hypothesis is formulated as follows:
Zitouna bank has different evolution than Al Baraka bank.
3. Data and graphic-based analysis
3.1 Variables
Our sample contains 16 banks (14 conventional and 2 Islamic). It is worth noting that since the data are not available or are only partially available for Noor and Wifak banks, we consider the two major Islamic banks “Zitouna” and “Al Baraka” for the empirical analysis. A list of Tunisian banks is given in the Appendix, Table A1. We have 160 observations, or bank-years of data, for banks operating in Tunisia for the calendar years 2005–2014. There are 140 observations for conventional banks (CBs) and 20 observations for Islamic banks (IBs). Twelve financial ratios are used in this study. We classify these ratios into six general categories: profitability ratios (ROA and ROE), liquidity ratios (CTA and CTD) [1], credit risk (LLR, NPL, LTA, LTD), insolvency risk (DTA), regulatory risk (CAP) and asset structure ratios (FAA, OBSIA) [2]. To ensure that our results were not driven by the presence of some outliers, we did correct all variables (we did not eliminate extreme values) [3]. The definition of each ratio is given in Table 1.
List of banks (with code)
| Conventional banks | Islamic banks |
|---|---|
|
|
Source(s): Authors' own work
Definition of variables
| Ratios | Definitions |
|---|---|
| Profitability | |
| ROA | Return on assets = net income/total assets |
| ROE | Return on equity = net income/stockholders' equity |
| Liquidity | |
| CTA | Cash to assets = cash/total assets |
| CTD | Cash to deposits = cash/total customer deposits |
| Credit risk | |
| LLR | Loans loss reserves to gross loans |
| NPL | Non-performing loans to gross loans |
| LTA | Loans to assets = loans/total assets |
| LTD | Loans to deposits = loans/total customer deposits |
| Regulatory risk | |
| CAP | Capital adequacy ratio |
| Insolvency risk | |
| DTA | Deposits to assets = deposits/total assets |
| Asset structure | |
| FAA | Fixed assets to assets = fixed assets/total assets |
| OBSIA | Off-balance sheet items to assets = off-balance sheet items/total assets |
| Dummies | |
| IB | Dummy variable equal to 1 if the bank is Islamic, 0 otherwise (i.e. Conventional banks (CB)) |
| D2011 | Dummy variable equal to 1 if year 2011 |
| D2008 | Dummy variable equal to 1 if year 2008 |
| Bank characteristics | |
| Size | Log(total asset) |
| Market share | Percentage of comparison between Islamic banks total asset and banks |
Note(s): Market share = Islamic bank total assets/country banks total assets × 100%, see Purboastuti et al. (2015) and Aminah et al. (2019)
Source(s): Authors' own work
For stability ratio measure, Z-score computation is based on the formula presented by Groeneveld and de Vries (2009). In order to compute this score, we take into account of the following indicators: ROA (return on assets), equity to assets ratio (ETA) and the standard deviation of ROA. Z-score is computed using the following formula: , where the subscripts “i" and “t” represent individual banks and time period, respectively. As stated by Mercieca et al. (2007), the higher the Z-score, the more stable is the bank.
3.2 Univariate analysis: figure-based comparisons
Figures 1–12 illustrate a comparison of means for ratio between IBs and CBs.
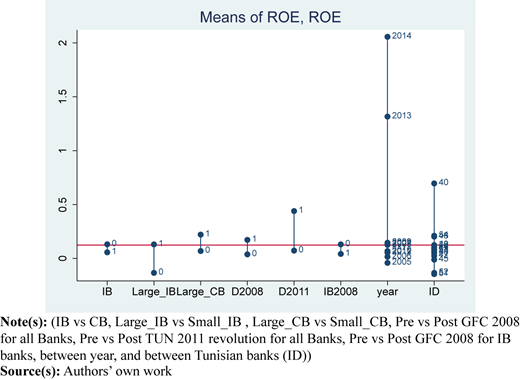
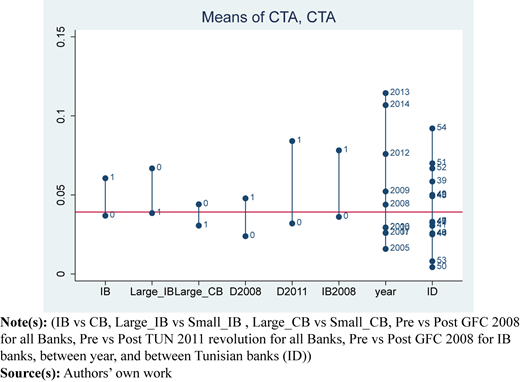
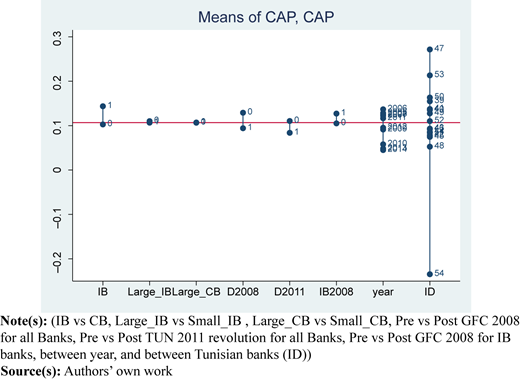
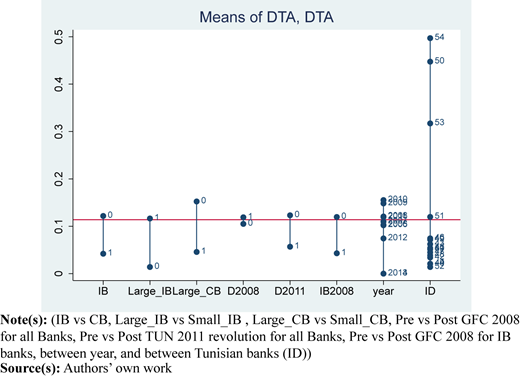
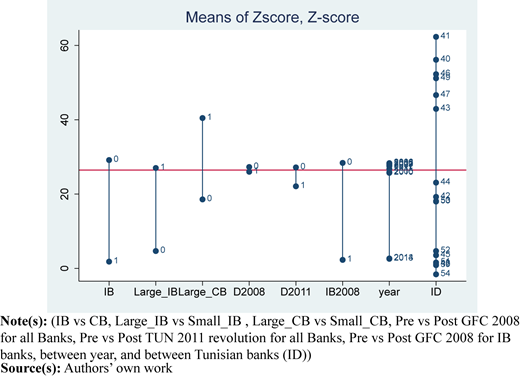
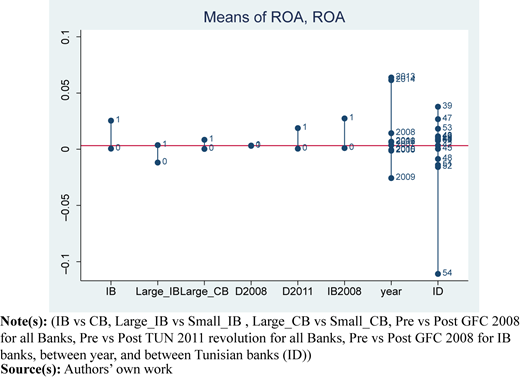
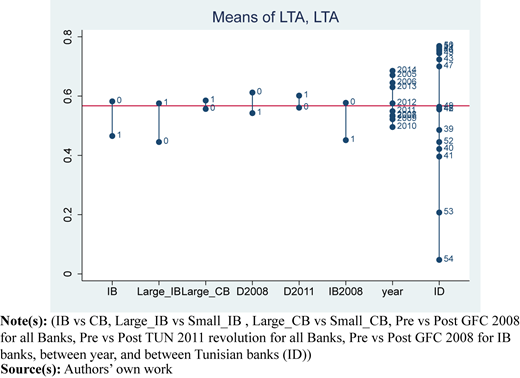
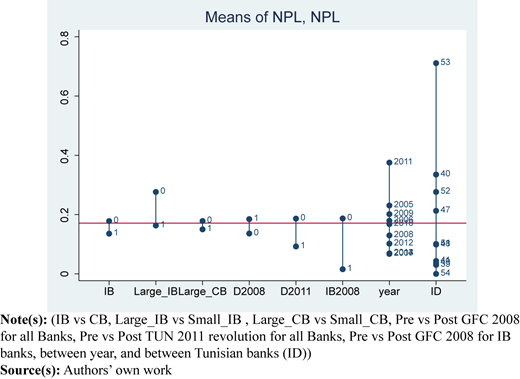
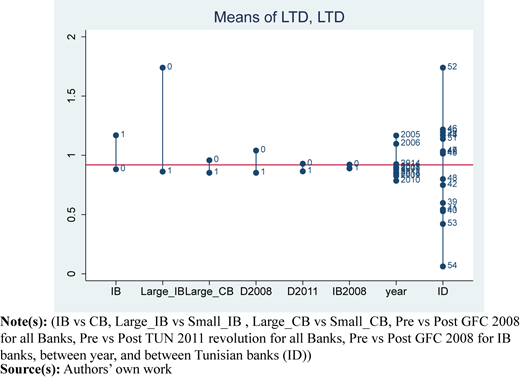
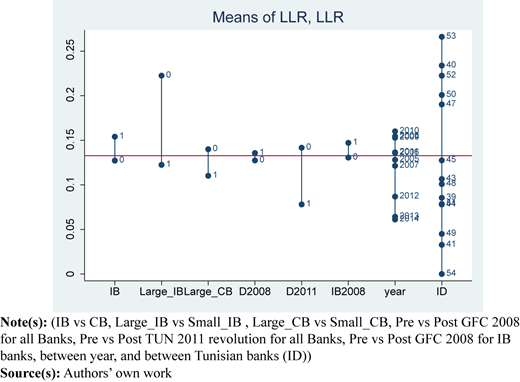
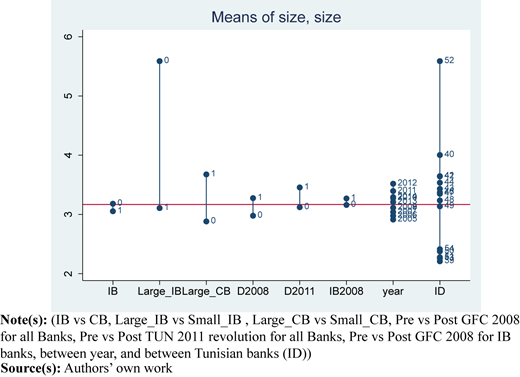
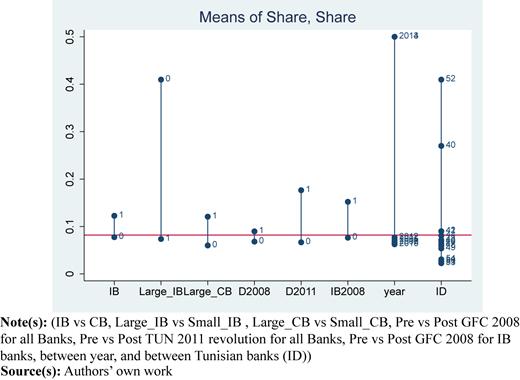
Mean comparisons for each ratio or variable are done in several dimensions: large IB versus small_IB, large_CB versus small_CB, pre- versus post-GFC 2008 for all banks, pre- versus post-Tunisian 2011 revolution for all banks, pre versus post-GFC 2008 for Islamic banks, between year evolution and between all Tunisian banks (ID). Results from these figures are summed up in Table 2. Note that is a dummy variable for Tunisian revolution (taking the value one from year >2011: year date of Tunisian revolution), while is a dummy taking the value one for interest-free banks,
is an interaction term between and to indicate situation of islamic banks after GFC of 2008, large_IB is an interaction term between and large: dummy variable equal to 1 if bank is large (size > median), 0 otherwise, to indicate large Islamic banks, and large_CB is the equivalent of large_IB for conventional banks.
Univariate analysis based on multidimensional figure-based comparison – a sum up from Figures 1–12
| Bank characteristics | IB | Dimensions | |||||||
|---|---|---|---|---|---|---|---|---|---|
| Size | Across IB | Year (max) | |||||||
| Large IB | Large CB | D2011 | IB2008 | MAX | MIN | ||||
| Profitability | − | + | + | 15 | 16 | 2013–14 | |||
| Liquidity | + | − | − | + | + | 2013–14 | |||
| Credit risk | + | − | + | − | − | 16 | 2011 | ||
| Stability | − | + | + | − | − | ||||
| Capitalization | |||||||||
| Solvency | + | − | + | + | + | 16 | |||
Note(s): 15 ≡ Al baraka Bank Tunisia, 16 ≡ Banque Zitouna. Empty cells suggest that the determinant was not significant
Source(s): Authors' own work
We try to investigate the following hypotheses.
H1: in average, IBs are more profitable than CBs,
H2: in average, IBs hold higher liquidity than CBs,
H3: in average, IBs are less risky than CBs,
H4: in average, IBs are less stable than CBs,
H5: in average, IBs are more capitalized than CBs and
H6: in average, IBs are affected by 2008 GFC.
Looking at Table 2, we can say that.
IBs are riskier, more liquid, more solvent, less stable and less profitable than CBs.
Large IBs are less riskier, less liquid, less solvent and more stable than small IBs.
Large CBs are more riskier, less liquid, more solvent and more stable than small CBs.
Post-Tunisian revolution, Tunisian banks are less riskier and less stable but are more liquid, more solvent and more profitable.
Post-GFC 2008, IBs are less riskier and less stable but are more liquid, more solvent and more profitable.
Across banks, “Zitouna bank” is more riskier and more solvent, while “AL Baraka bank” is more profitable.
Across years, Tunisian banks are more riskier in 2011, more liquid and more profitable between 2013 and 2014.
However, this univariate analysis might be not reliable. It can help to determine the difference between sample groups but cannot help in controlling the individual characteristics of banks. Individual characteristics changes may affect the output of these comparisons. To overcome this limitation, we use regression-based comparison analysis.
4. Regression-based comparison methodology
Different regression models are considered in this section. First, we compare interest-free and CBs controlling for bank characteristics. Second, we consider the effect of the Tunisian revolution 2011. Third, we compare IBs and CBs across different size groups. Fourth, we take account of the market share side for each type of bank. Fifth, we analyze cross-bank differences. In this section, different hypotheses to be investigated are formulated as follows:
H7: IBs are affected by the 2011 Tunisian revolution,
H8: Small IBs have different evolution than large IBs,
H9: Small CBs have different evolution than large CBs,
H10: High share market IBs have different evolution than others IBs and
H11: “Zitouna Bank” has a different evolution than “Al Baraka Bank.”
4.1 Controlling for bank characteristics
To assess differences in profitability, liquidity, credit risk, insolvency and stability across different bank types, we run the following regression:
where is the vector of bank characteristics,
where,
Age = number of years since the bank was incorporated,
Size = log(total asset),
Growth = log(total assets) - log(total assets-1),
is one of our measures of profitability, liquidity, credit risk, insolvency and stability of bank i, in year t, are dummy variables for bank-fixed effects, are dummy variables for year-fixed effects, is a dummy taking the value one for interest-free banks, is a dummy variable for GFC (taking the value one from year >2008) and is an error term. We thus compare IBs and CBs.
The robust significant results are summed up in Table 3 (column 1).
Regression-based comparison: a sum up of significant factors
| Bank characteristics | Regression analysis | ||||||||
|---|---|---|---|---|---|---|---|---|---|
| IB | Size | High share | Across | TUN | |||||
| Small IBs | Small CBs | Panel A | Panel B | IBs 15 16 | 2011 Cons | Trend for IBs | |||
| Profitability (ROA/ROE) | +/− | −/+ | +/− | + | − | − | +/− | − | |
| Liquidity (CTA/CTD) | +/− | −/+ | +/− | − | − | + | |||
| Credit risk | + | − | + | − | − | + | − | + | |
| Stability | + | − | + | + | + | ||||
| Capitalization | + | − | + | + | + | − | + | ||
| Solvency | − | + | − | − | + | − | − | ||
Note(s): A positive sign “+” indicates that the considered variable has a positive significant effect. A negative sign “−” suggests a negative significant effect. Empty cells suggest that the determinant was not significant
Source(s): Authors' own work
4.2 During and post-2011 Tunisian revolution
Taking into account the GFC effect and time trend (long-run effect) on IBs, we run the following regression:
where,
=
, is a dummy variable for the Tunisian revolution (taking the value 1 from year >2011).
A sum up of robust OLS significant results from regressions (2) for each group of considered measures is given in Table 3 (columns 8 and 9).
4.3 Cross different size
Now, we split the sample of all banks according to their asset size. Specifically, we split the sample into banks above the 50th percentile (large banks) and banks below the 50th percentile (small banks). We therefore run the following regressions:
where small_IB is an interaction term between small bank and IB (a dummy variable equal to 1 if IB is small, 0 otherwise), and small_CB is an interaction term between small bank and CB (a dummy variable equal to 1 if CB is small, 0 otherwise).
A sum up of robust OLS significant results from regressions (3) for each group of considered measures is given in Table 3 (columns 2 and 3).
4.4 Controlling for market shares
Taking into account differences in market share, we use additional specifications, including interacting the IB dummy with high market share variable (HShare). To do so, we split the sample of all banks according to their market share. Specifically, we split the sample into banks above the 50th percentile (high market share banks) and banks below the 50th percentile (low market share banks). We use additional specifications, including interacting the IB dummy with the high market share dummy. We therefore run the following regression:
where,
= HShare IB,
HShare = 1 if market share ≥ median market share,
Market share = bank total assets/country banks total assets 100%.
A sum up of robust OLS significant results from regressions (4) for each group of considered measures are given in Table 3 (column 4, panel A; and column 5, panel B). Compeared to panel A, panel B results are based on regression that control in addition to variables (bank size, age, growth and asset structure of banks), some other variables (including fixed assets to assets ratio, off-balance sheet items to assets ratios).
4.5 Cross-banks variation investigation
To control for individual IB characteristics in assessing the differences across different bank types, we run the following regression:
where,
IB is an Islamic bank indicator.
A sum up of robust OLS significant results from regression (5) for each group of considered measures is given in Table 3 (columns 6–7). We have two Islamic banks: 15 ≡ “AL Baraka” and 16 ≡ “Zitouna.”
5. Regression findings
Significant results based on a robust estimation technique [proposed by Rousseeuw et al. (1986)] from regression (1) to regression (5) are summed up at Table 3 hereafter.
Looking at Table 3 (from the first column), we conclude that.
IBs are more profitable than CBs, which confirm hypothesis H1. This result is in line with results of Samad and Hassan (2000), Samad (2004) and Olson and Zoubi (2008). However, it may be possible that shareholders in IBs are willing to accept a lower ROE (Karim and Ali, 1989).
IB's asset is more liquid than CB's as represented by CTA. This result confirms hypothesis H2, which is consistent with Basu et al.’s (2015) findings. However, CB has the better CTD ratio, indicating that compared to IB, CB asset has more cash than its customer deposit.
Contrary to hypothesis H3, IBs carry higher credit risk compared to CBs. This result is not in line with findings of Boumediene (2011) and Beck et al. (2013). An explanation for this may be that “It is not permitted to stipulate any financial compensation, either in cash or in other consideration, as a penalty clause in respect of a delay by a debtor in settling his debt” (AAOIFI Sharī‘ah Standard No. 3). Indeed, Islamic scholars have differentiated two types of defaulters: those who are really in distressed situations and those who can pay but refuse to meet their obligation. However, in practice, it is hard for IB to determine whether the default arises from a genuine reason or otherwise (Hasan, 2013). This indicates that the IBs should be able to manage credit supply by not excessively lending to risky sectors, which will only increase the credit risk exposures.
IBs have higher deposits to assets (DTA) ratios that show a lower insolvency risk in CBs.
IBs have higher Z-score than CBs, revealing that the former are more stable than the latter. Hence, hypothesis H4 is not confirmed in the studies of Abedifar et al. (2013), Beck et al. (2013), Miah and Uddin (2017), Rajhi and Hassairi (2014). However, this result contradicts findings of Čihák and Hesse (2010) and Gamaginta and Rokhim (2011).
IBs have higher capital adequacy ratios (CAP), which confirm hypothesis H5, stipulating that IBs are more capitalized than CBs. This result is in line with those reported by Alkassim (2005), Beck et al., 2010 and Parashar and Venkatesh (2010).
Looking at the second column, we deduce that.
Large IBs are more profitable than small IBs. However, it may be possible that shareholders in large IBs are more willing to accept a lower ROE.
Large IB's asset is more liquid than those of the small IBs. However, the small IBs 'asset contains more cash than its customer deposit compared to the large IB.
Small IBs have lower capital adequacy ratios, suggesting that large IBs are more capitalized.
Large IBs are riskier than small IBs.
Small IBs have lower Z-score than large IBs. This result is not in line with those reported by Čihák and Hesse (2010) and Bedifar et al. (2013).
The comparative analysis allows us to confirm the hypothesis that small IBs have different evolution than large IBs (H8). We conclude that the stability of IBs can be attributed to the size effect (large IBs). Moreover, the stability of large IBs is driven by higher capitalization and liquidity.
Looking at the third column, we deduce that:
Small CBs are more profitable than large CBs. However, it may be possible that shareholders in small CBs are more willing to accept a lower ROE.
Small CB's asset is more liquid than those of the large CBs. However, small CB's asset contains less cash than its customer deposit compared to large CB.
This result suggests that small CBs are riskier than large CBs. It also shows that as CBs grow, risk management becomes more difficult. The credit risk monitoring systems in CBs became more complex when operated on a larger scale.
Small CBs have higher insolvency risk than large CBs.
Moreover, small CBs have higher capital adequacy ratios (CAP) than large CBs.
Looking at the 4th and 5th columns, we deduce that:
The lower profitability of IBs vis-à-vis CBs is driven by markets with lower market shares of IBs. While IBs have higher credit risk than CBs, this difference increases as the market share of IBs decreases.
IBs have lower insolvency risk with a higher market share.
We confirm that high-share market IBs have different evolution than CBs (hypothesis H10). This result is not in line with the Čihák and Hesse’s (2010) finding, stipulating that the market share of IBs does not have a significant impact on the financial strength of other banks.
Looking at the 6th and 7th columns, we can say that:
“AL Baraka bank” is less profitable but riskier and more solvent than other banks.
Across banks, “Zitouna bank” is less liquid but more stable and more profitable. However, it may be possible that Zitouna's shareholders are more willing to accept a lower ROE.
Both banks are more capitalized than other Tunisian banks.
These results are consistent with hypothesis H11, postulating that “Zitouna Bank” has a different evolution than “Al Baraka Bank.”
Looking at the 8th and 9th columns, we conclude that:
Post-2011 Tunisian revolution, there is no significant difference in terms of stability, insolvency and credit risk between IBs and CBs. However, IBs are less profitable, more liquid and less capitalized than CBs.
However, over the hall period of study, IBs have lower insolvency risk and tend to be riskier, more capitalized and more stable than CBs.
These results are consistent with hypothesis H7, which postulates that IBs are affected by the 2011 Tunisian revolution. An explanation for this may be that the customers' preference for Islamic banking products post-Tunisian revolution appears significant, and it is essentially based on the motivation of compliance with the Islamic religion principles.
6. Conclusion
This paper provides a comparison between Tunisian Islamic and conventional banks on the basis of financial characteristics (including profitability, liquidity, capitalization, stability and insolvency risks). We use multidimensional figures and regression comparison methods. The comparison analysis between IBs and CBs of bank-specific factors and dummy interacting variables indicates that there are differences between Islamic and conventional banks' behavior.
Based on multidimension figures analysis, results say in particular that post-2008 GFC, IBs are more profitable, more liquid, less riskier, less stable and more solvent.
Both methods show that IBs are riskier, more liquid and less profitable than CBs. In addition, both methods reveal that small IBs (small CBs) are more (less) solvent, and large IBs are more stable. We conclude that the solvency (insolvency) of IBs (CBs) can be attributed to the size effect.
Regression-based comparison analysis shows that IBs are more profitable and more liquid than CBs. However, CB's asset contains more cash than its customer deposit compared to IB. IBs carry higher credit risk compared to CBs. Results show also lower insolvency risk in CBs. IBs are more capitalized and stable than CBs. Comparing Islamic and conventional banks across different size groups, we find that large IBs are more profitable, more capitalized and riskier than small IBs. Small IBs have also a lower Z-score than large IBs. We conclude that the stability of IBs can be attributed to the size effect (large IBs). Moreover, the stability of large IBs is driven by higher capitalization and liquidity. Small CBs behave inversely to small IBs. Small CBs are more profitable, more capitalized and riskier than large CBs. The result reveals lower insolvency risk in large CBs. Moreover, results suggest that “AL Baraka bank” is less profitable but more riskier and more solvent than other banks. Across banks, “Zitouna Bank” is less liquid, less riskier and less solvent, but more profitable and more stable. However, it may be possible that Zitouna's shareholders are more willing to accept lower ROE. Both banks are more capitalized than other Tunisian banks.
We confirm hypothesis H10, postulating that high-share market IBs have different evolution than CBs. Regression-based comparison analysis shows that high share IBs have less credit risk and IBs tend to be riskier, more stable, more capitalized and more solvent. Moreover, we find that post-2011 Tunisian revolution, there is no significant difference in terms of stability between IBs and CBs, but all Tunisian banks are more liquid. However, over the study period, IBs had lower insolvency risk and tended to be more capitalized and stable than CBs.
The financial and investment managers can obtain more insights regarding investment decisions. The comparative study suggests that their portfolios should consider the principles governing different types of banks with the perspective of diversifying the risk and hedging, and reaping benefits as well. The comparison identifies the significance of investor awareness and education toward the risk of investment they are making in the financial market. Additionally, bank executives shall use it to benchmark their performance against peers and optimize their position in the market.
A future study based on a larger sample, more advanced statistical tools and more recent data covering all financial ratios of Tunisia would have allowed us a more powerful analysis and a deeper investigation taking into account unstable conditions (in politics, economics, Covid-19 and finance) as done in El-Chaarani et al. (2022).
The authors would like to thank the reviewers for their suggestions on this manuscript. They would also like to acknowledge the editors of the Islamic Economic Studies journal for their support.
Notes
Liquidity means how quickly a bank can convert its assets into cash at face value to meet the cash demands of the depositors and borrowers.
Regarding the later ratios, we use fixed assets to assets ratio and off-balance sheet items to assets ratio to account for the operating leverage and off-balance sheet activities, respectively. These ratios are used in the previous empirical banking literature (see Srairi, 2010; Ben Khediri et al, 2015).
To control for the remaining outliers, we will use a robust estimation technique (an alternative method) as a superior estimation method, less sensitive to outliers, as proposed by Rousseeuw et al. (1986). Our objective is to see the evolution behavior in a somewhat stable government situation (before and after 2011 until 2014) since post-2014, Tunisia has a government by year, the economic environment is not stable and from 2019, with the COVID crisis, everything was abnormal and the data could not give a clear DGP (data generation process). Note also that since 2011, and more recently from 2015 to 2022, Tunisia has suffered from worrying levels of budget deficits and current account deficits that are in increasing gravity. In addition, maybe more than 10 governments have relied on banking system to cover budget deficits. These conditions mixed with social crisis may make abnormal relationships between considered variables.
Disclosure statement: No potential conflict of interest was reported by the authors. No funding was received for conducting this study.
