Despite the increased retrofitting of Finnish residential buildings, there are limited post-retrofit studies on the actual measured indoor environmental quality (IEQ) and occupant satisfaction during summer-time. This paper provides a better understanding of the actual performance of retrofitted residential apartment buildings in Finland, focusing on some aspects of and the risk of summer overheating through post-occupancy evaluation (POE).
The study used both qualitative and quantitative data collection methods, including satisfaction surveys, indoor air temperature and relative humidity measurements, self-reported behaviour forms, open-ended discussions, and site visits in five apartments in different residential buildings in Tampere city, monitored during the summer-time, for at least 2 weeks at a time.
While occupants were positive regarding most aspects of IEQ, concerns about indoor air quality (IAQ), summer overheating and acoustic comfort were raised. The summer-time monitoring highlighted that indoor air temperatures could reach as high as 27 °C for 2–9 days depending on the monitored apartment. Little cloud cover and warmer outdoor temperatures directly influenced indoor air temperature overheating. For some aspects of the investigated IEQ parameters, it was noted that while occupants’ satisfaction was influenced by the length of their residence, their acceptance of the same conditions remained positive over time (i.e. more than one year) as they adapted over time.
The number of participants and case studies was relatively small due to the well-known difficulty in gaining access to private homes, so the results do not allow generalisation but do provide interesting insights of these specific cases to be validated with future additional research. The short sequential rather than long-term parallel monitoring of the case study apartments was another limitation making comparison between cases and understanding reasons for differences difficult.
Findings highlight the need to maintain the performance of housing in Finland during summer-time. The highlighted subjective issues emphasised in this study underscore the necessity for enhanced pre- and post-retrofit quality processes and the prompt resolution of issues as they arise. The integration of POE studies into all residential construction practices becomes pivotal for the advancement of sustainable homes now, but also in the future, especially when subjected to a warming climate.
This study is among the few POE studies conducted in Finland, offering insights into post-retrofit performance and occupant satisfaction during the summer-time. The study highlights the potential of POE to understand the performance of retrofitted Finnish apartments from a user-centric perspective.
1. Introduction
Residential buildings play an important part in people’s lives since occupants spend most of their time indoors (Rouleau et al., 2018). Currently, existing residential buildings represent the largest proportion of the built environment in Europe (Eurostat, 2023). Their general overall lack of energy efficiency does not meet users’ needs in terms of indoor environmental quality (IEQ), contrary to highly efficient buildings (Konzeptbau, 2019). In Finland, 40% of all residential buildings were constructed between 1960 and 1980, during a time when building standards for thermal insulation and energy efficiency were less stringent than today (Hassler, 2009). As a result, many of these buildings now face challenges in maintaining optimal IEQ, often requiring retrofits to improve insulation, reduce energy consumption and enhance thermal comfort for occupants (Hajian et al., 2024). Finland is characterised by its predominantly longer and prolonged colder days during, and around, the winter season. During winter season which is about 90 days (i.e. quarter of the year.), the mean temperature remains below 0 °C (FMI, 2022). Due to these cold weather conditions, Finnish residential buildings have traditionally been constructed for cold winters and mild summer, often lacking summer solar shading and lack of openable windows to provide night cooling opportunities during summer-time (Elsayed et al., 2023; Hassi, 2002; Sukanen et al., 2023). Despite achieving winter-time thermal comfort satisfaction by following and applying building regulations that seek to insulate buildings and make them airtight, summer-time thermal discomfort levels is becoming more prevalent (Velashjerdi Farahani et al., 2024). This discomfort affects not only thermal comfort but also various other aspects of IEQ especially in view of an increasingly warming climate and future heatwaves that is expected (Sukanen et al., 2023; Taylor et al., 2023), and the observed increase of 2 °C in the years 1847–2013 (Mikkonen et al., 2015; Sukanen et al., 2023).
There are generally four key IEQ parameters: thermal comfort, indoor air quality (IAQ), acoustic comfort, and visual comfort (Mewomo et al., 2023; Pereira et al., 2020). In addition to these four parameters other factors such as colour schemes, textures, furniture comfort, window-to-wall ratio, can also significantly influence IEQ and occupant satisfaction (Kent et al., 2024; Koesalamwardi et al., 2024). Thermal comfort is widely regarded as one of the four primary parameters determining occupants’ satisfaction with IEQ (Rizzo et al., 2004), and it is defined according to ASHRAE: as the condition of mind that expresses satisfaction with the thermal environment and is assessed by subjective evaluation (ASHRAE, 2020). The acceptable thermal conditions are defined by physical parameters (e.g. air temperatures and relative humidity), as well as subjective parameters (e.g. clothing insulation and metabolic rate) (Raimondo et al., 2012). Achieving the appropriate indoor air temperature is arguably the most important and easily quantifiable aspect of occupants’ thermal comfort, significantly influencing their satisfaction, health, well-being, and overall IAQ (Al horr et al., 2016). According to Finnish guidelines, the recommended design temperature for the occupied residential area during summer-time should be 23 °C ± 1 °C (Ministry of the Environment, 2003). Summer overheating is considered to occur when the indoor air temperature exceeds 27 °C for at least 150 h during summer-time (i.e. 6 days and 6 h) (Ministry of the Environment, 2017).
Since the 1970 energy crisis, efforts have been made in Finland to achieve occupant thermal comfort during winter and reduce space heating through regulations and retrofitting activities. This has been accomplished by making buildings more sealed and airtight (Vinha et al., 2015). However, this practice has led to unintended consequences, not only summer overheating (Jones et al., 2016; Velashjerdi Farahani et al., 2024) especially in absence of solar shading and night cooling (Sukanen et al., 2023), but also some moisture build-up, and microbial growth, which affect occupants’ health and well-being and can even lead to building demolition (Hirvonen et al., 2020). As a result, there has been a growing emphasis on building renovation in Finland with a focus on enhancing and improving IEQ (Hautajärvi and Böök, 2017). Moreover, studying retrofitted residential buildings in Finland is crucial due to the country’s aging housing stock, much of which requires energy-efficient upgrades, which are essential for sustainability efforts, resource conservation, achieving environmental goals and enhancing occupant satisfaction (Hirvonen et al., 2022).
As a result of factors such as adherence to thermal insulation regulations and energy-efficient building practices, Finnish residential apartment buildings typically perform well during the heating season, with indoor thermal environments maintained at comfort levels. However, little is known about their performance during summer, especially when buildings are in “free-running mode”. A free-running mode is when a building does not have mechanical systems for controlling the indoor conditions (Nicol, 2017), and it’s indoor environmental conditions are determined by variables such as solar radiation, solar shading, the thermal capacity of the building, the design, orientation, operability and size of window openings, occupants’ behaviour (Lomas and Giridharan, 2012), and local climate (temperatures and temperature differences between day/night and indoor/outside and outdoor wind) (REHVA, 2021). Limited previous research highlighted some IEQ issues with existing residential buildings in Finland, such as not meeting occupants’ satisfaction (Naaranoja and Uden, 2007), health issues related to mould (Pirhonen et al., 1996), poor IAQ post-retrofit and lack of adequate fresh air (Ala-Kotila et al., 2020). Modelling studies have also shown an increased risk of summer-time building overheating in central and northern Europe, especially in a changing climate (Taylor et al., 2023). In Finland in particular, recent research highlights that increasing solar shading to reduce summer-time solar gains and increased natural ventilation to dissipate heat build-up will be important measures to consider reducing overheating and thermal discomfort (Taylor et al., 2024).
As such, the Finnish Ministry of the Environment’s aims to identify problems linked to the indoor environment (Ruosteenoja and Jylhä, 2021) and consequences for indoor conditions for users in current residential buildings (Ministry of the Environment Finland, 2020). The objectives of this study are aligned with these goals, focusing on understanding and evaluating occupants’ post-retrofit satisfaction with IEQ, alongside in situ measurements of summer-time indoor air temperatures for five apartments. The main scope of this research was to gain actual summer-time performance data of some typical Finnish apartments. This was undertaken by conducting post-occupancy evaluation (POE) for five different apartments located in five different retrofitted multi-storey residential buildings in Tampere, a city located in the region of Pirkanmaa, the western part of Finland. POE is defined as “the process of evaluating an asset/facility after it has been completed and is in use to understand its actual performance against that aimed for and to capture lessons learned” (BSI, 2015). This paper is organised into four sections: Section 2 outlines the research methods, including the five case study descriptions and the data collected. Section 3 presents the findings and discussion from the case studies, followed by the conclusions in Section 4.
2. Research methods
This study follows the road map recommendations for POE best practices as suggested by Elsayed et al. (2023), incorporating elements of both thermal comfort psychophysical research (Mansi et al., 2021) and qualitative and quantitative data collection methods (Creswell and Clark, 2017; Edmonds and Kennedy, 2017). While the study links physical stimuli (such as indoor air temperatures (°C) and relative humidity (RH%)) to sensory responses (e.g. thermal comfort), qualitative data, gathered through occupant satisfaction surveys, site visits, and building walkthroughs with open-ended discussions, helps explain these quantitative measurements from the occupants’ point of view.
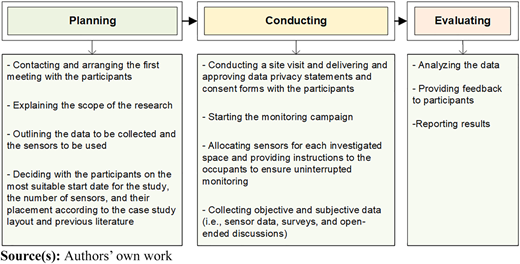
The study was accomplished in three phases: planning, conducting and evaluating. In the planning phase, a meeting with the occupant took place to determine the scope of the research and engage the subject, delivering an explanation of the data to be collected. The second phase, conducting, foresaw the choice of the most suitable data collection method by the researcher, according to the specific situation of the case study, occupants and previous literature (i.e. sensors placement, monitoring time, survey explanation, self-reported explanation and the open-ended discussions) (Preiser and Nasar, 2008). In the final phase, evaluating, while analysing the data, the researcher returned to available occupants to share the results and report the findings (Khalil and Husin, 2009). A summary of different steps is summarised in the following (Figure 1).
Five case studies were purposively selected based on the availability to monitor the indoor environment (Elsayed et al., 2022) and to conduct an occupant survey. Participants were recruited from five different apartments by sending an online invitation and using word of mouth; this approach has been shown to be effective in attracting voluntary individuals (Vogiatzi et al., 2015). All the technical data and necessary drawings for the case studies were sourced from the construction information service at Tampere city hall (Kaupunki, 2022).
Participation in the study was voluntary, and participants were free to withdraw at any point. All participants, aged 25 to 44, provided informed consent, and all identifiable data was omitted from the study to ensure confidentiality. Research ethics approval, including a data privacy statement and informed consent forms were obtained before the study. The research information sheet explained the purpose of the survey and monitoring campaign and occupants’ rights as research participants. On the first visit, an occupant satisfaction survey and a privacy statement were handed to occupants. Both documents were provided in Finnish and English languages, checked with native speakers, and piloted with other colleagues before the field study. All five participants responded to the survey and agreed to participate.
The paper-based survey was a development of a previous survey by Elsayed et al. (2022) and it consisted of nine sections investigating: (1) aspects of apartment and participant overview; (2) energy and water consumption cost overviews (i.e. fixed price, including in the rent, or based on the consumption); (3) thermal comfort; (4) perceived air quality; (5) acoustic comfort; (6) visual comfort and lighting conditions; (7) domestic hot water satisfaction level (i.e. time it takes to get the hot water, temperature level, and water smell); (9) health and wellbeing conditions, and finally an open section for feedback.
The survey contained open-ended as well as multiple-choice questions, and according to ASHRAE Standard 55 (ASHRAE, 2017a) a 7-point satisfaction scale was used (where 1 is very dissatisfied and 7 is very satisfied), a 7-points perception scale (from feeling cold to warm), a 3-point preferences scale (with a middle point for no change) as well as a 4-point acceptance scale (from clearly unacceptable to clearly acceptable) (Lollini et al., 2020). The purpose of this survey was to gather the occupants’ subjective feedback on the investigated IEQ parameters. In addition, an open-ended discussion with each participant took place while placing and collecting the sensors, as well as a walkthrough investigation; this lasted approximately 45 min. The purpose of the open-ended discussion at the beginning of the study was to guide the participants through the survey questions, ensuring that all occupants perceived the questions the same way as well as understanding occupants’ behaviour and activities they do in their flats which might influence the reading of the sensors. At the end of the study, the purpose of the open-ended discussion was to help understand and explain any highlighted comments in the satisfaction survey, especially when occupants expressed their extreme satisfaction or dissatisfaction with any IEQ parameters. Data obtained during site visits provide a better understanding of how occupants use their homes and whether any habits or behaviours, such as cooking, showering, opening windows or moving sensors during cleaning activities, might affect or explain sudden changes in monitored air temperature or RH% values (Zhao and Carter, 2015). Visits were conducted between June and September 2022 which is a period when residential buildings typically operate in a free running mode in this region (i.e. without background heating and with no mechanical cooling systems), and monitoring was performed for a few weeks in each apartment (see Table 2).
2.1 Description of case studies
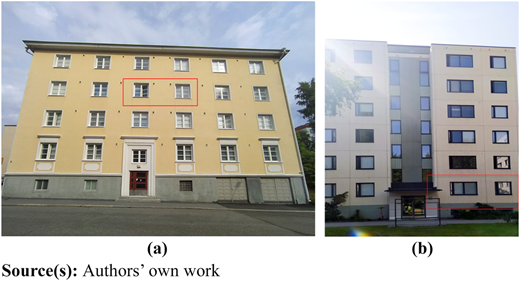
Case studies were pseudonymised from A to E. All case studies were located in the region of Pirkanmaa, the western part of Finland, i.e. in climate zone D [1] (subarctic climate (Dfc) according to Köppen’s classification). Dfc climate is characterised by long, cold winters and short, warm to cool summers (Köppen, 1980). All the apartments were located in separate blocks of flats in the city of Tampere, which is the second-largest urban area and third most-populous individual municipality in Finland. See Figure 2 for two investigated case studies. Three cases (A, B, and C) were occupied by a single person, reflecting Finland’s characteristic as a country with a high percentage of single-person households, where 42% of all households consist of a single occupant (Hautajärvi and Böök, 2017). On the other hand, two cases (D and E) were occupied by two people each.
According to the Finnish Metrological institute (FMI), the long-term average summer temperature recorded in Tampere was 16.0 °C during the period of (1961–2020), while the highest average summer temperature recorded was 18.2 °C in 2021, and the lowest average was 0.3 °C in 1980. During the period (1961–2020), the long-term average winter temperature was −4.5 °C, with the highest average winter temperature being 5 °C in 2020 and the lowest −8 °C in 1985 (FMI, n.d.). Due to Finland’s geographical location, the days are considerably longer in summer and much shorter in winter than in Central Europe, the southernmost cities of Finland such as Tampere experience less than six hours of daylight in winter and an average of 20 h of daylight during summer months (FMI, n.d.) – also increasing the potential solar exposure in buildings (Sukanen et al., 2023).
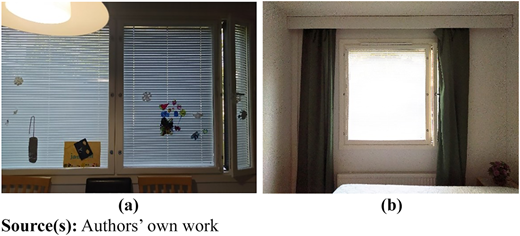
The monitoring campaign took place from June 9th until September 19th, 2022, with four of five cases monitored during warmer summer periods of >25 °C. The average daylight hours for the monitoring period (i.e. June–September 2022) varied from 19 h in June, and 13 h in September (“Tampere, Finland — Sunrise, Sunset and Daylength”, n.d.). Although case studies have different characteristics such as location, layout, area, and floor level, they all had an exhaust extractor fan in the kitchen and the toilet, which has been common in Finnish apartment buildings since the 1980s after the energy crisis (Hautajärvi and Böök, 2017). All participants had the opportunity to naturally “purge” ventilate their apartments by opening the windows. All windows had integrated internal blinds within a double-glazed system, and extra curtains (blackout or transparent curtains) (see Figure 3). None of the five cases had an air conditioning unit during the monitoring period.
Table 1 summarises the basic information for each case study, obtained from the survey, site visits and the online archival system for Finnish buildings (paikkatietoikkuna.fi).
3. Data collection
3.1 Objective data collection
Evaluating the physical performance of an indoor environment is essential for assessing occupant satisfaction, and no POE study would be complete without it (Stevenson, 2019). Given that temperature and RH% data is numerical, various criteria should be considered: (accuracy), the number of missing values (completeness), eliminating duplicate entries (uniqueness), and finally collecting data with the correct timestamp (timeliness). Establishing specifications for the monitoring equipment, including its placement (accuracy), and testing the experimental setup in advance are crucial steps towards obtaining accurate and consistent quality data, as considered in this study (Mavrigiannaki et al., 2021).
3.1.1 Air temperature and relative humidity
Air temperature (°C) and relative humidity (RH%) levels were collected during the monitoring campaign for each case to integrate subjective feedback with objective data, thus clarifying and strengthening considerations on the occupants’ thermal satisfaction, perception and temperature acceptance survey responses. Besides air temperature, humidity levels play a role in determining thermal comfort. In the presence of higher humidity, the heat-loss mechanism of evaporation becomes less effective, while individuals can also experience discomfort when the air is excessively dry (Sterling et al., 1985). Due to the limited number of available data loggers, the time for the setup and occupants’ availability for the site visit, the case studies were monitored consecutively rather than in parallel in a three-month monitoring campaign. HOBO data loggers MX1101 were used to monitor indoor air temperature and RH%. The sensors have a temperature measurement range from −20 to +70 °C, with an accuracy of ±0.21 °C. The range for relative humidity is 1–95%, with an accuracy of ±2.0% (Onset, 2022). The time interval for all sensors was set to one minute to capture potential peak-events in a short period of time such as cooking, showering activities, etc. (Zhang et al., 2022). All the indoor data loggers were placed according to a set of predetermined rules in common for all five cases (e.g. sited away from heat sources and direct sunlight, away from the cooker, away from the showering area and ventilation passageways etc.). Typically, one indoor data logger was placed in each space (i.e. the bedroom, living room, kitchen, and bathroom) at a height of 1.1 m and 1.7 m in order to match with occupants’ abdomen and head level (EN ISO 7730, 2006), and 100–500 mm away from the inner walls so as to reduce the effect of wall surface temperatures, according to recommendations from (ASHRAE, 2017a; Energy Saving Trust, 2008), as well as previous studies (Elsayed et al., 2022).
Due to variations in layout across the examined case studies, the continuous heating source in the bathroom – either from the radiator connected to the domestic hot water circuit (Finnish Energy Industries, 2013), or peaks resulting from showering activities. Additionally, substantial potential for heat accrual during cooking activities (Pereira et al., 2018). For this reason and given the fact of the extended occupancy duration in the living spaces (i.e. living and bedroom spaces) (Pereira et al., 2018), data from the living spaces were averaged for each case for the analysis (see Table 2). While data from the bathroom and kitchen were reported to assess their immediate impact on the indoor air temperature (see Figures 5—9).
3.2 Subjective data collection
While IEQ can be evaluated subjectively through occupants’ feedback (Elsayed et al., 2023), or objectively using measuring instruments that provide values comparable to reference values or those recommended by building regulations and standards (ASHRAE, 2017b), the perception of these values can vary from person to person. Acceptance, perception and satisfaction scales are methods that can be used to subjectively evaluate individual satisfaction with IEQ parameters, including thermal comfort, IAQ, acoustics and visual comfort (Lollini et al., 2020). On a larger scale, these methods can objectively evaluate the satisfaction of a broader population (Heinzerling et al., 2013). In this study, both acceptance and satisfaction scales were used in a standardised way in occupant surveys to maintain consistency in their responses and understanding of the research scope, as well as to identify the parameters that might be most important to occupants (see Section 3.2.1).
3.2.1 Thermal comfort
There are three methods to evaluate thermal comfort among occupants: individual surveys, laboratory experiments, and finally, predictive models such as the predicted mean votes model developed by Fanger (Fabbri, 2015). Due to the subjective nature of thermal comfort and its subjective evaluation, prediction models have low predictive accuracy, making individual surveys (i.e. both perception, satisfaction and acceptance questions responses) more reliable to understand occupant comfort (Cheung et al., 2019). Despite this, models may generate diverse thermal sensation scenarios for comparing various theoretical indoor air parameters (Elsayed et al., 2022).
Perception refers to how occupants interpret the relationship between physical and personal variables and their subjective thermal sensations (Schweiker et al., 2020). Thermal satisfaction level on the other hand refers to the degree to which an individual’s expectations or desires are met by particular thermal conditions (Oliver, 2014). The most commonly used evaluation scales for thermal comfort are the seven-point thermal perception scale (−3 cold, −2 cool, −1 slightly cool, 0 neutral, +1 slightly warm, +2 warm, and +3 hot), and the seven-point satisfaction scale (+3 very satisfied, +2 satisfied, +1 slightly satisfied, 0 neutral, −1 slightly dissatisfied, −2 dissatisfied, and −3 very dissatisfied) (de Dear et al., 2020). Because occupants’ perception and response to sensory questions may not necessarily indicate occupants’ acceptance of the reported perception of sensation or satisfaction level, in this study, the acceptance scale is used in addition to the perception and satisfaction scale to fully understand occupants’ feedback (Zhao and Carter, 2015). The acceptance scale is a measurement tool used to assess the degree to which occupants are willing to accept a particular situation, such as thermal conditions (Fanger, 1970). Additionally, several multiple-choice questions regarding the occupants’ activity levels and clothing levels were recorded, as recommended by (Ashrae Standard, 2017).
3.2.2 Indoor air quality (IAQ)
IAQ refers to the concentration of pollutants, bacteria, viruses, etc., within a building in the air compared to the risk of irritation, allergies, illnesses, etc. (Fabbri, 2015). Often, air quality in residential buildings is assessed by measuring chemical and microbiological parameters such as carbon dioxide (CO2), particulate matter (PM) and volatile organic compounds (VOC) (Kim et al., 2019). However, occupants’ subjective perception of IAQ is influenced mainly by odour perception and thermal comfort, including temperatures, air movement and humidity (Melikov and Kaczmarczyk, 2012). There are two human senses relevant to IAQ: the human nose, which can detect odours and irritation, and the human respiratory tract (Fabbri, 2015). Hence, in this study (and in absence of VOC and CO2 monitoring instruments), occupants were asked in the survey to report their satisfaction and acceptance level regarding air quality using a seven-point (+3 very satisfied, +2 satisfied, +1 slightly satisfied, 0 neutral, −1 slightly dissatisfied, −2 dissatisfied and −3 very dissatisfied), and four-point scale (clearly unacceptable, just unacceptable, just acceptable and clearly acceptable), respectively. In addition, occupants were asked about phenomena associated with poor IAQ, such as mould, draughts, bad smell, etc. (Hostland et al., 2016).
3.2.3 Acoustic and visual comfort
At home, noise impacts human health primarily based on its volume, duration, degree and frequency. Although normal background noise levels can cause a disturbance, the complete absence of sound can be just as disturbing (Stevenson, 2019). Incorporating additional insulation and installing well-insulated windows provide occupants with reduced outdoor noise. Conversely, they can heighten occupants’ awareness of internal noise generated by home appliances and within the building (Harvie-Clark et al., 2019). Hence, as part of this study, occupants were asked to report any potential unpleasant noise sources (i.e. indoor noise from home appliances or mechanical ventilation systems, or noise from outdoor) as well as their satisfaction (+3 very satisfied, +2 satisfied, +1 slightly satisfied, 0 neutral, −1 slightly dissatisfied, −2 dissatisfied and −3 very dissatisfied) and acceptance level with noise (clearly unacceptable, just unacceptable, just acceptable and clearly acceptable).
On the other hand, the concept of indoor visual comfort is concerned with the correct lighting and vision of the surrounding environment (Fabbri, 2015). Daylight is essential for human health in two ways: it regulates the production of the hormone melatonin, which regulates sleep patterns, as well as stimulates the production of serotonin, which can reduce depressive symptoms (Lewis, 2015). Retrofit solutions, which involve window upgrades, typically include the installation of differently sized windows to higher thermal specification, along with integrated shading systems (De Grussa et al., 2022). However, integrating these solutions in buildings may alter occupants’ visual comfort perception and satisfaction (Tabadkani et al., 2021). Hence, as part of the visual comfort assessment, occupants were asked to report their satisfaction on the seven-point satisfaction scale, preferences with natural lighting (less light, no change and more light), and acceptance of natural lighting conditions on the four-point acceptance scale, and the source of discomfort, if it exists (e.g. artificial light is not enough, light is too bright, flickering issues, reflection issues, glare issues, etc.).
4. Findings and discussion
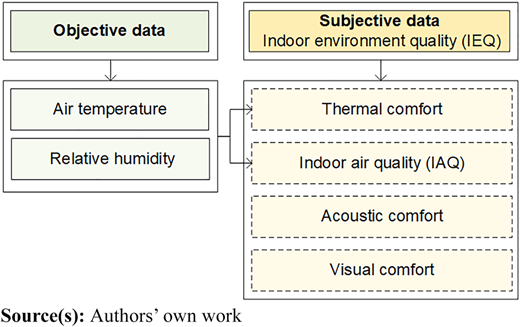
This section presents the findings and discussion of the objective and subjective data collected regarding air temperature and relative humidity, and some aspects of IEQ satisfaction (Figure 4). In addition, results are investigated qualitatively and quantitively (i.e. occupants’ reflections and feedback through the open-ended discussions were used to interpret the monitored data and data from the satisfaction survey, especially when low satisfaction level was reported).
4.1 Objective data collection results
4.1.1 Air temperature and relative humidity
Throughout the monitoring duration for each case and as expected during free-running mode, it was observed that outdoor air temperature influenced indoor air temperature in the living spaces. For most of the monitoring time, the indoor air temperature in the living spaces when averaged over the monitored time met the average recommended indoor summer temperature values set out in the Finnish guidelines (i.e. 22–24 °C) in three out of five cases (A, C, and E). However, two cases (B, and D) had average monitored indoor temperatures above the recommended temperature (26 °C), while the average outdoor air temperatures for these two cases were 18 and 19 °C, respectively. The average air temperature in the bathroom space was the highest in all cases (i.e. 25–28 °C) due to continuous internal heat gain as mentioned earlier. In the kitchen spaces, the average temperature varied between (23 and 24 °C) Table 2.
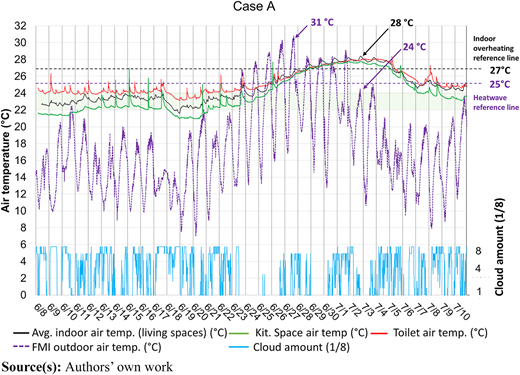
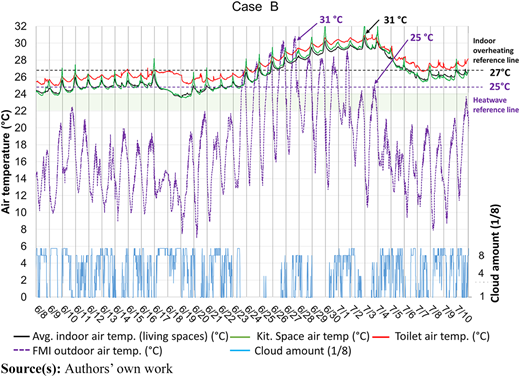
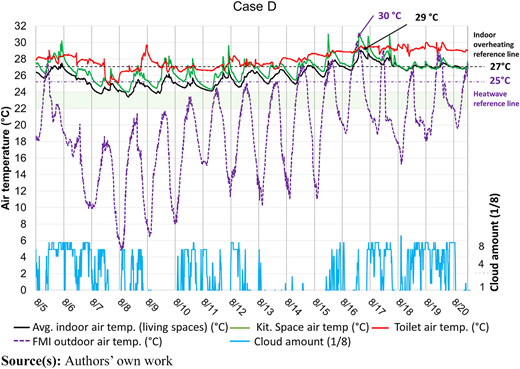
According to the FMI, heatwaves occur in Finland when the maximum daily outdoor air temperature exceeds 25 °C on an average of 10–15 days during summer-time inland in southern and central Finland, and 5–10 days in northern Finland and on the coast (FMI, n.d.). The outdoor air temperature exceeded 25 °C for about 9 days in cases A and B (see Figures 5 and 6) and about 7 days in case D (Figure 7). Indoor summer overheating on the other hand occurs when the indoor air temperatures exceed 27 °C for at least 150 h (6 days and 6 h) during summer-time (Ministry of the Environment, 2017). The indoor air temperature exceeded the value of 27 °C for about 5 days in case A, about 9 days in case B and about 2 days in case D over a monitoring period of 43, 32 and 15 days respectively for the three cases. All three cases (A, B and D) were monitored during hot periods just falling short of heatwaves.
The rapid increase of the indoor air temperature occurred relatively faster than the cooling down period, especially when the maximum outdoor air temperature exceeded 25 °C. Consequently, the indoor air temperature exceeded the maximum comfort level (24 °C) for 17 days out of 43 monitoring days in case A. – see Figure 5.
In case B, the indoor air temperature exceeded the recommended comfort temperature of 24 °C for 32 days (see Figure 6). Little cloud cover led to an increased exposure to solar radiation, which can be a primary source of overheating during the warm season due to longer consecutive days and exposure to solar radiation (Taylor et al., 2023). The accumulated heat would persist indoors even when the outdoor air temperature decreased, as observed in case A, where the maximum indoor air temperature reached 28 °C while the outdoor air temperature was 24 °C at the same time (Figure 5). Similarly, in case B, the maximum indoor air temperature reached 31 °C at the time when the outdoor air temperature was 25 °C (Figure 6).
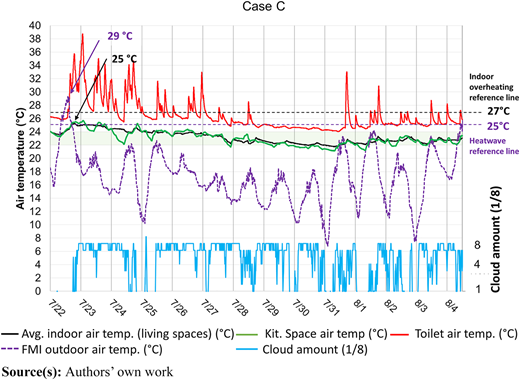
However, there are different possible causes for the high indoor air temperature (above 27 °C), such as a well-insulated envelope and/or thermal mass retaining heat, occupant behaviour and the inability to purge ventilate. There were two common outdoor environmental factors in these cases: the presence of consecutive days with little cloud cover and warmer outdoor temperatures (Figure 7). This summer overheating phenomenon is common in highly insulated buildings and has been reported in previous studies conducted in Finland, especially when buildings lack proper shading devices or passive/mechanical cooling systems (Leivo and Haverinen-Shaughnessy, 2022; Sukanen et al., 2023).
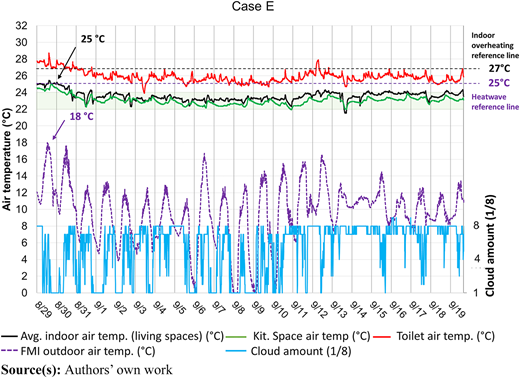
On the other hand, with cases C and E, except one day with case C, the average monitored outdoor air temperature was below 25 °C, with more cloud cover for most of the monitoring time (see-Figures 8 and 9). Consequently, the average indoor air temperature in both cases was within the average recommended comfort range (22–24 °C) (Woo, 2017).
In Case E, the outdoor air temperature experienced a decline, with no recorded maximum outdoor air temperature exceeding 25 °C. Throughout the monitoring period, the indoor air temperature consistently conformed to the recommended range of 22–24 °C (see Figure 9).
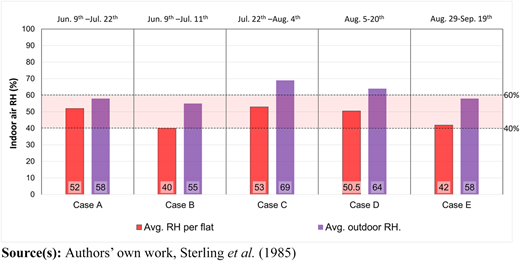
As for the RH levels, all RH levels within the living spaces were within acceptable limits (i.e. 40–60%). The highest average indoor RH level, 54 ± 2.0%, was monitored in case A, followed by 51% ± 2.0% in case C–both meeting the comfort range (Sterling et al., 1985). Despite Case A reporting through the site visit and the open-ended discussions, drying of the laundry in the living room, the average RH level in case A was within the recommended values (40–60%) (Figure 10). Drying clothes indoors is one of the most common reported habits highlighted by previous research that could cause elevated levels of indoor RH% (Wood et al., 2019) and could cause indoor environment problems and moisture issues when exceeding the recommended values (Wierzbicka et al., 2018).
4.2 Subjective IEQ data collection results
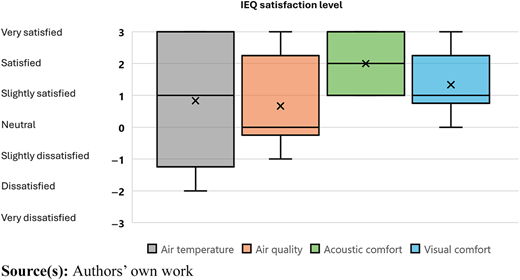
Both satisfaction and acceptance scales were used to determine overall occupants’ satisfaction with the IEQ parameters. Figure 11 presents participants’ satisfaction levels with investigated IEQ parameters. The satisfaction levels are depicted using box plots, which show the distribution of responses among the participants. The data show considerable variability, with air temperature and air quality having the largest ranges. Acoustic comfort had the highest positive median satisfaction level (+2), indicating that participants were generally more satisfied with the acoustic environment, followed by visual comfort and air temperature with a median value of (+1), then finally air quality with a median value of (0). The high satisfaction with acoustics might have different reasons, one of which could be recent regulations in Finland on sound insulation, noise, and vibration abatement, which set standards for acoustic conditions in new construction, repairs, alterations and changes in building use (Kylliäinen and Saarinen, 2019).
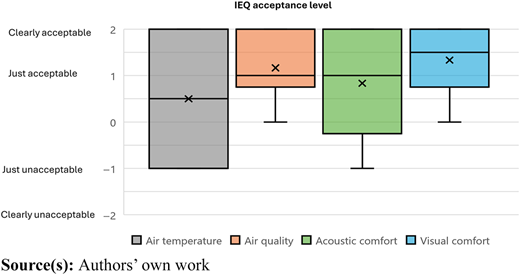
The IEQ acceptance levels of participants also showed variability, with median acceptance levels for all parameters around +1 (just acceptable), indicating generally positive acceptance (see Figure 12). However, acoustic comfort exhibited the most variation. Visual comfort had the highest median acceptance level (+1.5), followed by air quality and acoustic comfort with a median average value of (+1), and finally air temperature (+0.5).
4.2.1 Air temperature satisfaction
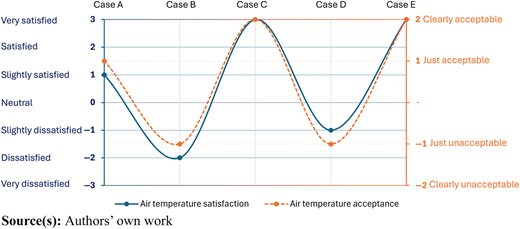
Occupants in all cases reported high levels of satisfaction with the indoor air temperature except for cases B and D who reported being “dissatisfied” and “slightly dissatisfied”, respectively (see Figure 13). This is slightly surprising, given that case A, that experienced summer overheating for extended periods as described earlier, reported being slightly satisfied. It was observed, however, that for the rest of the monitoring period, the average recorded temperature was within the average comfort zone (22–24 °C). On the other hand, cases B and D, who reported lower satisfaction levels, had average recorded indoor air temperatures for the whole monitoring period that exceeded the average comfort zone (22–24 °C). However, summer overheating occurred for about 9 days in case B and only about 2 days in case D over the monitored periods (32 and 15 days, respectively). It is worth noting that the occupants of cases B and D had been living in their apartments for less than 1 year at the time of the monitoring campaign. However, the occupants of cases A, C and E had been living in their apartments for 4, 3.5, and 1.5 years, respectively. This suggests that the longer occupants stay in their apartments, the more they may become accepting and adaptable to thermal conditions (Brager and De Dear, 1998; Rupp et al., 2015).
The level of occupants’ satisfaction with air temperature was correspondingly manifested in their degree of acceptance. Specifically, occupants expressing low levels of satisfaction, denoted as B and D, likewise indicated low levels of acceptance (“just unacceptable” – see Figure 13). When occupants were asked to provide both a numerical value and a description of their preferred feeling, they reported a lower preferred temperature value than the average monitored one. On the other hand, as can be seen in Table 3, the feeling preferences varied between “colder,” as would be expected for the cases with high internal air temperatures above the recommended range (22–24 °C), and “no change” for those where internal temperatures were within the recommended range (22–24 °C).
Table 3 summarises the satisfaction, perception, acceptance, and preferences of indoor air temperature on a 7, 7, 4 and 3 points scale, respectively, in addition to occupants’ clothes, levels as described in (ASHRAE, 2017b), and preferred temperature set points as reported by occupants.
4.2.2 Indoor air quality (IAQ)
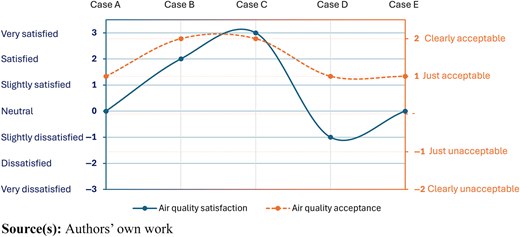
Occupants were asked to subjectively report their general satisfaction and acceptance with IAQ, including issues such as drafts, mould, enough fresh air flow, and unpleasant smell since they moved to their apartments. Despite the general positive level of satisfaction with IAQ in two cases (B and C), neutral in two cases (A and E), and only negative in case (D) (see Figure 14), there are some reported IAQ issues similar to previous studies (e.g. Elsayed et al., 2022; Harvie-Clark et al., 2019) For example, feeling air draughts from windows were reported in two cases (A, and D) that are south facing. Air as being stuffy was reported in case A. Not enough airflow while cooking was reported in case D, regardless of the installation of a kitchen extract hood in case D. Mould in small quantities in toilet and kitchen spaces was reported in case A. Previous research, however, highlights that mould found in small quantities on bathtub rims or windows, such as the one reported in case A, are regular moisture issues and are not problematic and can be easily eliminated (Hostland et al., 2016).
On the IAQ acceptance level on the other hand, all cases reported positive acceptance scores despite the negative satisfaction response for case D and the neutral responses for cases E and A (see Figure 14). This could be explained by results from previous research, which highlights that long-term experience can influence acceptance levels despite short-term dissatisfaction. In this study, during the site visits and the open-ended discussions, occupants seemed to link satisfaction question with short-term issues and acceptance with long-term ones. This aligns with findings in environmental psychology, where long-term exposure and adaptation to conditions can lead to higher acceptance levels despite occasional dissatisfaction (Bluyssen, 2013; Frontczak and Wargocki, 2011). The discrepancies between qualitative satisfaction and acceptance measures highlight the challenges of relying solely on qualitative metrics to gather information about occupants’ IAQ satisfaction and suggest incorporating quantitative measurements. In this way, qualitative data helps explain the point of view from occupants (Elsayed et al., 2023; Frontczak and Wargocki, 2011).
4.2.3 Acoustic and visual comfort
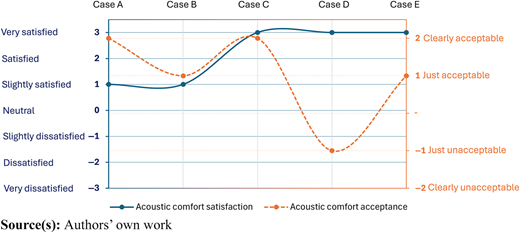
As for acoustics, all participants reported had a positive satisfaction level with acoustic conditions in their apartments. The acceptance level, on the other hand, was also positive except for case (D) – (see Figure 15). There are, however, some issues highlighted by occupants, for example, noise from neighbours and the ventilation system in case (B); from the water heating panels in case (E). Noise originating from the ventilation system or neighbours appears to become more common and more frequently occurs in the residential sector and has been reported in previous research (Wagner et al., 2010). Finally, noise from outdoor sources was reported in case (A). However, one aspect of acoustic comfort is the absence of noise (Fabbri, 2015). In the absence of objective acoustic measurements, the open-ended discussion provided insight into the reason of Case D’s dissatisfaction, attributed to the perception of excessively quiet acoustic conditions. This emphasizes the significance of directing future research attention towards acoustic considerations, as highlighted by the concerns raised.
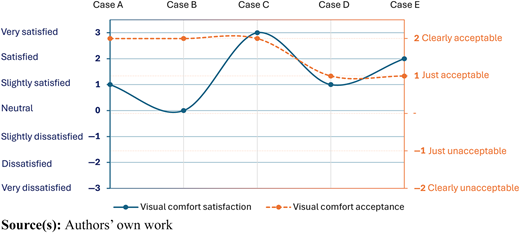
As for the visual comfort, it was evaluated subjectively through the satisfaction survey and the open-ended discussions during the site visit. The acceptance level for natural lighting conditions was positive in all cases, as well as the satisfaction level except for case B which reported neutral satisfaction level (see Figure 16). For case (B), the reason for not being positively satisfied was that all its windows (kitchen, living room and bedroom) face west towards an inner service court with no outdoor view (as clarified from the open-ended discussions). As part of the visual comfort assessment (Kim et al., 2019), the outdoor view is one of the factors that has a large effect on visual comfort (Shafavi et al., 2020), and it was available in all the investigated cases except for case B. However, this did not affect the acceptance level score for the occupant in case B. During the open-ended discussions, it was explained that the apartment served as a temporary home, as a result, factors such as the outdoor view were less important. Instead, the primary reason for choosing the apartment was its convenient location near the city centre, which outweighed concerns about visual conditions (Strandell and Hall, 2015).
5. Conclusion
This paper provides a better understanding of the actual performance of retrofitted residential apartment buildings in Finland, in some aspects of the IEQ and the risk of summer overheating. Through POE, this study assessed occupant satisfaction with thermal comfort, IAQ, acoustics and visual comfort in five apartments in different residential buildings in Tampere city, monitored during the summer-time, for at least 2 weeks at a time. The research used qualitative and quantitative data collection methods to investigate objectively and subjectively some aspects of the IEQ parameters and overall occupant satisfaction. As for the objective data, the research data included in situ measurements of air temperature and relative humidity levels. However, as for the subjective data, a paper-based satisfaction survey was used to evaluate the IEQ parameters, along with the site visits and an open-ended discussion with each participant.
The objective data collected highlights the observable increase in indoor air temperature during summer-time, particularly on consecutive sunny days with minimal cloud cover and when the outdoor air temperature exceeded 25 °C, especially in apartments with limited ways to manage solar radiation and/or purge ventilation to remove the hot air at cooler (night-time) periods. The recorded air temperature for the different cases shows that the indoor air temperature is affected by the outdoor air temperature and cloud cover level during periods in which the building is in free-running mode (i.e. summer-time). Short activities such as cooking and showering have a minimal and short impact on the average indoor air conditions. The average indoor air temperature in the living spaces in three out of five cases (A, C and E) met the average recommended summer temperature values set out in the Finnish guidelines (i.e. 22–24 °C). However, two cases (B and D) exceeded the recommended average indoor air temperature during the monitoring period for each case over the entire monitoring period. Three cases (A, B and D) experienced summer overheating within the monitored periods, with indoor air temperatures exceeding 27 °C for approximately 5, 9 and 2 days during the 43-day, 32-day and 15-day monitoring periods, respectively, for each case. On the other hand, subjective data underscores a general satisfaction with the investigated IEQ parameters.
Occupants’ feedback highlighted mostly the overall general high levels of acoustic environment, visual comfort, followed by air temperature and air quality satisfaction. The survey findings underscore the importance of using both subjective and objective measures to gain a comprehensive understanding of occupants’ needs, given the diverse preferences and perceptions towards indoor environmental conditions. It was noted from participants’ responses and their length of residence in their apartments prior to the monitoring campaign that the participants who have lived in their apartments at least more than one year tend to become more accepting, and adaptable to thermal conditions. However, residency length should be considered in future POE studies, as it may influence occupants’ levels of acceptance and adaptability to various environmental conditions, potentially affecting their overall satisfaction and responses.
In this study, all monitored cases had an RH% level within the recommended levels for health and comfort (40–60%). However, several IEQ discomfort issues were subjectively reported by occupants, including draughts close to windows in two cases: with in single cases reports of: stuffy air; mould growth; low extraction flow rate while cooking; noise from neighbours and ventilation system; noise from heating panels outdoor noise.
There were, however, some limitations, as often occurs with POE campaigns. For example, the number of participants and case studies was relatively small due to the well-known difficulty in gaining access to private homes, so the results do not allow generalisation but do provide interesting insights of these specific cases to be validated with future additional research. Additionally, the short sequential rather than long-term parallel monitoring of the apartments was another limitation making comparison between cases and understanding reasons for differences difficult. Nevertheless, this study still represents one of the few POE studies in Finland and gains some insights in post-retrofit performance and occupant satisfaction during summer-time. From the studied sample, findings highlight the need to maintain the performance of housing in Finland during summer-time. This is hindered by a lack of occupant feedback data and performance monitoring related to existing buildings. The highlighted subjective issues emphasised in this study underscore the necessity for enhanced pre- and post-retrofit quality processes and the prompt resolution of issues as they arise. Furthermore, the integration of POE studies into all residential construction practices becomes pivotal for the advancement of sustainable homes now, but also in the future, especially when subjected to a warming climate.
The research was supported by Venice University (Università Iuav di Venezia–IUAV) and the Faculty of Built Environment at Tampere University. This paper was partially funded by the INPERSO project—Industrialised and Personalised Renovation for Sustainable Societies—under the Horizon Europe programme (project number 101069820). Gratitude is extended to Prof. Piercarlo Romagnoni, Dr Mohamed Ibrahim, and Heikki Vuorinen for their invaluable and supportive discussions. Special thanks are also extended to the “Rakennusvalvonta” service of Tampere City Hall for providing essential technical information related to the investigated case studies, as well as to all participants in this study.
Notes
From over 2100 to 3000 Degree days and heating period between 15 October and 15 April.
Declaration of Competing Interest: The authors declare that they have no known competing financial interests or personal relationships that could have appeared to influence the work reported in this paper.