Skip to article sections
Purpose

The Vietnamese Mekong Delta (VMD) is confronting a fundamental hydrological shift. This study aims to quantify this emerging hydrological normal by distinguishing the effects of upstream regulation from basin-wide climate variability.

Design/methodology/approach

We analyzed daily discharge and rainfall data for 2000–2024 at Tan Chau and at upstream stations (Luang Prabang, Pakse, Mukdahan and Kratie). The analysis combines Mann–Kendall tests, Sen’s slope estimator, the range of variability approach (RVA), the hydrologic alteration factor (HAF) and Mann–Whitney U tests for the 2000–2009 baseline and 2010–2024 regulated period.

Findings

The analysis reveals a profound hydrological homogenization of the annual hydrograph. Key findings include: While upstream rainfall trends were non-significant or decreasing (Z < 0), dry-season discharge increased significantly across upstream and mid-basin stations (e.g. + 110.0 m³/s/year at Luang Prabang), whereas Tan Chau showed no statistically significant trend, indicating downstream attenuation of the regulated signal; RVA analysis shows high alteration levels for discharge (HAF∼−0.87 to −1.00), whereas rainfall RVA/HAF includes some high-magnitude monthly values but is mostly not statistically significant in Mann–Whitney tests, supporting discharge-rainfall decoupling; The flood pulse has been severely dampened. Notably, the strong La Niña year of 2021 produced flood peaks 41.3% below the 2000–2008 baseline at Pakse and 25.5% below the baseline at Kratie, confirming that reservoirs are systematically overriding natural climate signals.

Originality/value

The revised analysis shows that upstream regulation has reshaped the basin hydrograph most clearly in the upper and middle Mekong, while the delta gateway response is buffered by tributary inflows, Tonle Sap storage and channel-scale attenuation. This distinction provides a more defensible basis for adaptation planning in the VMD.

River deltas represent some of the most dynamic, biologically diverse and economically vital landscapes on Earth (Giosan et al., 2014; Syvitski et al., 2009). Acting as the critical interface between terrestrial and marine environments, these systems support dense human populations and serve as global agricultural powerhouses (Bui and Dang, 2025; Rogozhina, 2022). However, their sustainability relies heavily on a delicate equilibrium between sediment deposition, which counters subsidence, and the erosive forces of the ocean (Xue et al., 2012; Zoccarato et al., 2018; Minderhoud et al., 2019). This balance is increasingly threatened by anthropogenic interventions, particularly the construction of mega-dams that fundamentally alter riverine hydrology and sediment transport (Kondolf et al., 2014; Schmitt et al., 2017).

The Vietnamese Mekong Delta (VMD), often described as the “rice bowl” of Southeast Asia, exemplifies this precarious existence (Syvitski et al., 2009; Giosan et al., 2014). Home to nearly 20 million people and accounting for a significant portion of Vietnam’s rice exports and aquaculture, the VMD’s ecological health has evolved over millennia in sync with the Mekong River’s natural flood pulse (Bui and Dang, 2025; Kummu and Varis, 2007). This unique hydrological rhythm – characterized by a distinct monsoon-driven flood season and a dry season – is the engine of the delta’s productivity (Bui and Dang, 2025; MRC, 2019). The annual floods deliver essential nutrient-rich sediments to the floodplains, replenish groundwater aquifers and, critically, provide the hydraulic pressure necessary to flush saline water out of the intricate canal network (Chau et al., 2026; Quang et al., 2026; Wang et al., 2011). Consequently, the livelihoods, culture and biodiversity of the region are intrinsically linked to the predictability and variability of this natural flow regime (Bui and Dang, 2025; MRC, 2019).

Over the past three decades, however, the Mekong River Basin has undergone a radical transformation, becoming a focal point for one of the world’s most intensive hydropower development campaigns (Lu et al., 2021; Ly et al., 2023; Grumbine and Xu, 2011). The construction of a cascade of large-scale dams on the Upper Mekong (Lancang) in China, followed by mainstream and tributary dams in the Lower Mekong Basin (Laos PDR, Cambodia), has created a massive active storage capacity capable of reshaping the river’s hydrology (Lauri et al., 2012; Hecht et al., 2019). The operational logic of these reservoirs is consistent: store water during the wet season to mitigate floods and generate power, and release water during the dry season to maintain electricity production. While this regulation offers theoretical benefits such as flood control and dry-season irrigation, it inadvertently disrupts the natural flood pulse that the VMD ecosystem depends upon (Richter et al., 1996; Li et al., 2017).

Despite the growing body of literature documenting flow alterations in the Mekong (Binh et al., 2020; Räsänen et al., 2017), a scientific debate persists regarding the primary driver of these changes. Is the observed hydrological shift predominantly a consequence of upstream reservoir operations, or is it merely a reflection of basin-wide climate variability, such as changing precipitation patterns driven by El-Niño-Southern Oscillation (ENSO)? Critics of the “dam-driven” hypothesis argue that analyzing discharge solely at the delta’s gateway (e.g. Tan Chau and Chau Doc stations) is insufficient to rule out climatic drivers, as local rainfall anomalies could skew the interpretation. Furthermore, existing studies often lack a rigorous, basin-wide attribution framework that quantitatively disentangles the effects of rainfall variability from flow regulation.

This ambiguity presents a significant challenge for policymakers in the VMD. Without a definitive attribution of causes, developing effective adaptation strategies is fraught with uncertainty (Binh et al., 2020). If the changes are climate-driven, they might be cyclical or random; if they are dam-driven, they represent a structural, permanent shift – a “new normal” that requires a fundamental overhaul of water management paradigms. The lack of a clear, quantified baseline for this regulated era hampers the ability to model salinity intrusion accurately, plan agricultural calendars and negotiate transboundary water release protocols.

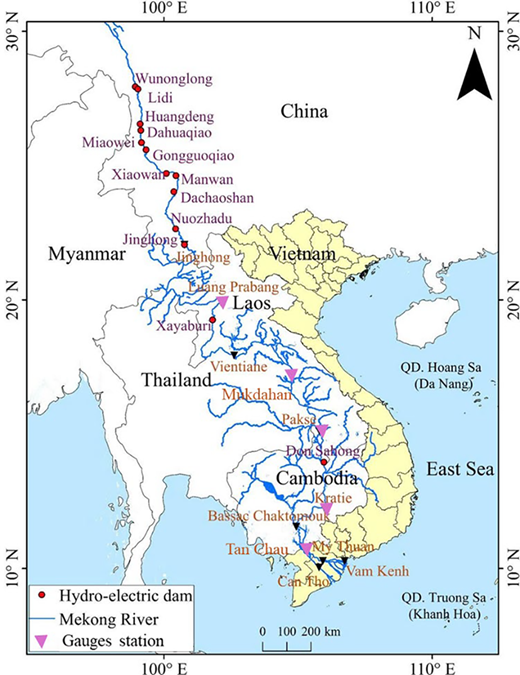
The study encompasses the Mekong River Basin, stretching from the Upper Mekong cascade down to the VMD. The VMD is a vast, low-lying coastal plain highly susceptible to the interplay between river discharge and marine tides (Nguyen et al., 2025b; Zoccarato et al., 2018). To ensure spatial representativeness and capture the downstream propagation of hydrological signals, we utilized daily discharge and rainfall data from five key stations along the mainstream: Luang Prabang (Laos, immediately downstream of the Lancang cascade), Mukdahan (Thailand), Pakse (Laos), Kratie (Cambodia – the primary control station before the delta) and Tan Chau (Vietnam – the primary gateway to the VMD). Figure 1 illustrates the study area and the geographical distribution of these hydrological and meteorological stations. The basin’s morphology plays a crucial role, with the mean slope decreasing significantly from the mountainous upper reaches to the flat deltaic plains, facilitating sediment deposition and flow attenuation (Bussi et al., 2021; Wolman and Miller, 1960).

Data were collected for the 25-year period from 2000 to 2024, sourced from the Mekong River Commission and the Vietnam National Center for Hydro-Meteorological Forecasting. Table 1 summarizes the specific characteristics and data duration for these stations. The data set was divided into two periods based on the timeline of major dam commissioning (e.g. Xiaowan in 2010, Nuozhadu in 2014):

  1. Growth-dam period (2000–2009): This 10-year period represents the initial phase of major dam construction. While some regulation effects were emerging from dams, the river’s flow regime retained significant natural variability, making it a suitable baseline for a “pre-mega-dam” state.

  2. Mega-dam period (2010–2024): This 15-year period covers the full operational phase of the Lancang cascade’s largest reservoirs and subsequent downstream developments, representing the current, highly regulated state of the river.

2.2.1 Trend analysis.

We employed the Mann–Kendall test and Sen’s slope estimator to detect monotonic trends in both discharge and rainfall time series (Lee and Dang, 2019; Nguyen et al., 2025a). This non-parametric approach is widely accepted in hydro-climatic studies as it is robust against outliers and non-normally distributed data (Lee and Dang, 2019; Huy et al., 2025). A trend is considered statistically significant if the p -value is less than 0.05 (Kendall, 1975; Mann, 1945).

2.2.2 Range of variability approach and hydrologic alteration factor.

To move beyond simple trend detection and quantify hydrological alteration, we applied the Range of Variability Approach (RVA) of Richter et al. (1996). The target range was defined as the 25th–75th percentile of the baseline period (2000–2009) and post-regulation observations (2010–2024) were assessed against this range. The HAF was interpreted as a magnitude metric, whereas the Mann–Whitney U test was used as a statistical test of distributional differences.

Hydromorphometric descriptors such as basin centre of gravity, drainage density and catchment form were not included as inputs to the RVA/HAF calculation because RVA/HAF is a time-series alteration framework based on observed flow and rainfall regimes. These relatively static basin descriptors are instead used conceptually to interpret spatial attenuation and lag-time effects along the river continuum:

(1)

where observed frequency is the percentage of post-regulation years falling within the RVA target range, and expected frequency is 50% because the target range is defined by the 25th–75th percentiles of the baseline period. |HAF| < 0.33: low alteration 0.33 ≤ |HAF| < 0.67: moderate alteration; |HAF| ≥ 0.67: high alteration. Attribution was based on the combined evidence from discharge HAF, rainfall HAF, Mann–Whitney U tests and spatial consistency across stations, rather than on HAF magnitude alone.

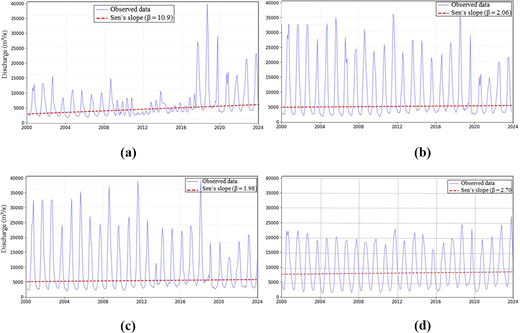
The Mann–Kendall analysis reveals a clear decoupling between discharge and rainfall, but the strength of this signal varies by station (Figure 2 and Table 2). Dry-season discharge increased significantly at Luang Prabang (Sen’s slope = +110.0 m3/s/year, p = 0.002), Pakse (+36.8 m3/s/year, p = 0.038) and Mukdahan (+393.4 m3/s/year, p  < 0.001). Kratie showed a non-significant dry-season trend (p = 0.072) but a significant flood-season decrease, while Tan Chau showed no significant trend in annual, dry-season or flood-season discharge. These results support a regulated-flow signal that is strongest upstream and becomes attenuated toward the delta gateway.

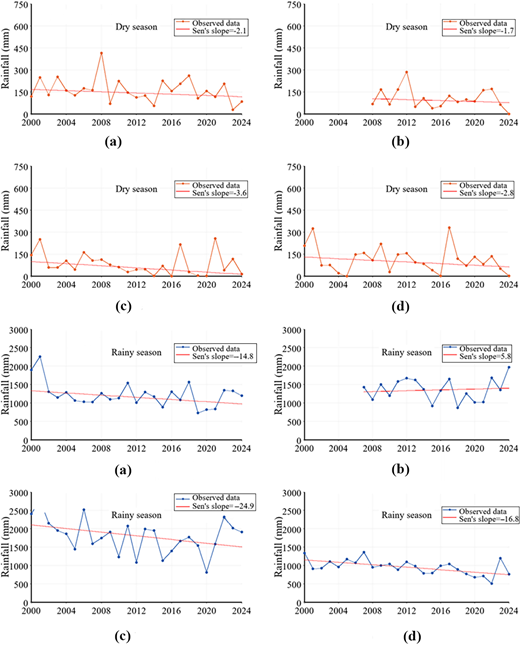
Rainfall patterns do not show a corresponding basin-wide increase (Figure 3 and Table 3). Recomputed Mann–Kendall tests indicate no significant increasing trend in dry-season rainfall at Luang Prabang, Kratie, Pakse or Tan Chau (Figure 3(A)). Annual and rainy-season rainfall decreased significantly only at Tan Chau, while the remaining rainfall series were statistically non-significant (Figure 3(B)). Thus, the observed dry-season discharge increases in the upstream and mid-basin stations cannot be explained by a general wetting of the basin.

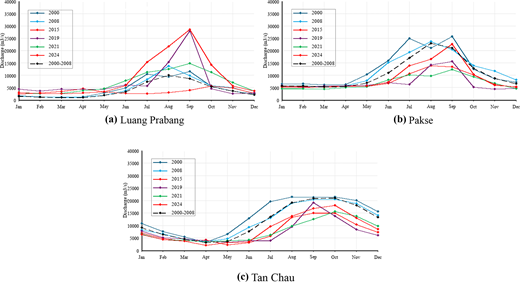
To further isolate the anthropogenic footprint from natural climate variability, we analyzed flood-pulse dynamics during selected ENSO years, noting that ENSO-monsoon interactions can substantially modulate Southeast Asian rainfall (Webster and Yang, 1992). Table 4 has been regenerated to reconcile station identities and percentage changes. In the La Niña year 2021, the flood peak at Pakse was 21,993 m3/s, 41.3% below the 2000–2008 baseline, while the Kratie flood peak was 32,655 m3/s, 25.5% below the baseline. The previously reported value of 14,617 m3/s was therefore removed because it did not correspond consistently to Kratie in the verified discharge table. Mukdahan was excluded from the ENSO-year comparison in Table 4 because rechecking showed physically implausible event-year values in the available source series, suggesting a source, unit or station-labelling problem that should not be used as evidence.

Dry-season dynamics also indicate regulation, but the magnitude is station-specific. For example, Pakse dry-season discharge was 37.5% above the baseline in 2019 and 4.4% above the baseline in 2024, whereas Kratie was 26.5% above the baseline in 2019 and 0.9% above it in 2024. These revised values support elevated dry-season baseflow in parts of the mainstream, but they do not justify a blanket statement that all stations increased strongly in all recent years.

Although Kratie is not displayed as a separate panel in Figure 4 to maintain figure readability, it is retained in the inferential scope and is fully analysed in Tables 2, 4 and 5.

The RVA analysis provides a statistical quantification of this regime shift (Table 5). At Luang Prabang, discharge during February, March and April exhibits high alteration (HAF = −0.87 to −1.00) with significant Mann–Whitney U results. Pakse, Mukdahan and Kratie also show high dry-season discharge alteration in several months, whereas Tan Chau shows mainly low-to-moderate alteration, with only April significant. This spatial pattern is consistent with strong upstream regulation and downstream attenuation.

Applying the same RVA framework to rainfall (Table 6) requires a distinction between HAF magnitude and statistical significance. Several rainfall months have high-magnitude HAF values, but most Mann–Whitney U tests are not significant; the main significant rainfall change occurs at Pakse in March. The defensible contrast is therefore not that rainfall has no high HAF values, but that rainfall alterations are generally less statistically consistent than discharge alterations. Physically, this means that month-to-month rainfall redistribution can occasionally fall outside the baseline interquartile range, yet it does not reproduce the coherent, multi-station dry-season discharge increase created by reservoir storage and release operations. This contrast supports, rather than proves on its own, the interpretation that the observed discharge alteration is not primarily explained by rainfall variability.

Our findings directly address the attribution question raised in previous studies. Rainfall does not show a basin-wide increase capable of explaining the dry-season flow rise at Luang Prabang, Pakse and Mukdahan, whereas discharge exhibits a coherent regulation signal in the upper and middle basin. At Tan Chau, the absence of a significant trend indicates attenuation rather than absence of upstream influence, because tributary inflows, Tonle Sap storage and delta-channel hydraulics can buffer the upstream signal before it reaches the VMD gateway.

The analysis of stations from upstream to downstream (Luang Prabang, Mukdahan, Pakse, Kratie and Tan Chau) confirms that the regulated signal is strongest in the upper and middle Mekong and becomes less statistically distinct toward the VMD gateway. This revision avoids overstating Tan Chau: the delta gateway does not show a significant monotonic trend in Table 2, but it remains exposed to a regulated upstream hydrograph whose effects are moderated by intervening storage, tributary inflows and travel time.

It is crucial to note the phenomenon of lag time in this propagation. Water released from upstream reservoirs takes days to weeks to reach the VMD, depending on season, flow velocity and intervening storage. The weaker statistical signal at Tan Chau should therefore be interpreted as downstream buffering rather than a contradiction of the upstream-regulation finding. This lag time has practical value because transboundary reservoir-operation information could improve early warning and adaptive water management in the delta.

The results define a “new normal” characterized by: Elimination of the natural flood pulse: The “beautiful floods” that historically brought sediment and fisheries wealth to the VMD are disappearing (Table 4), threatening the delta’s geomorphic stability and aquaculture productivity (Anthony et al., 2015; Uy et al., 2025).

Artificial dry-season flows: While beneficial for salinity repulsion in the short term, permanently elevated low flows disrupt ecosystems adapted to seasonal drought cues (Arias et al., 2014) and may encourage unsustainable agricultural expansion.

Unpredictability: Flash floods in 2019 and 2024 (Table 4) suggest that while average floods are lower, sudden releases from dams can cause unexpected surges, creating a “hybrid” hazard profile that is difficult to predict with traditional statistical methods.

This study provides a revised quantitative baseline for the Mekong mainstream entering the regulated era. By distinguishing discharge and rainfall responses across multiple stations, we conclude that upstream reservoir regulation is the dominant driver of the altered hydrograph in the upper and middle basin, while the signal at Tan Chau is attenuated and not statistically significant as a monotonic trend. The VMD should therefore be managed under a new hydrological normal defined by dampened flood pulses, altered dry-season baseflows and greater dependence on upstream operational decisions.

This reality demands a strategic pivot in management: from relying on historical statistical probabilities to operating within a regulated, albeit less predictable, framework. Future adaptation must prioritize sediment management, transboundary data sharing on dam operations, and flexible agricultural models that do not rely on the predictable flood pulses of the past.
Anthony
,
E.J.
,
Brunier
,
G.
,
Besset
,
M.
,
Goichot
,
M.
,
Dussouillez
,
P.
and
Nguyen
,
V.L.
(
2015
), “
Linking rapid erosion of the mekong river Delta to human activities
”,
Scientific Reports
, Vol.
5
No.
1
, p.
14745
.
Arias
,
M.E.
,
Piman
,
T.
,
Lauri
,
H.
,
Cochrane
,
T.A.
and
Kummu
,
M.
(
2014
), “
Dams on mekong tributaries as significant contributors of hydrological alterations to the tonle sap floodplain in Cambodia
”,
Hydrology and Earth System Sciences
, Vol.
18
No.
12
, pp.
5303
-
5315
.
Binh
,
D.V.
,
Kantoush
,
S.A.
,
Saber
,
M.
,
Mai
,
N.P.
,
Maskey
,
S.
,
Phong
,
D.T.
and
Sumi
,
T.
(
2020
), “
Long-term alterations of flow regimes of the mekong river and adaptation strategies for the vietnamese mekong Delta
”,
Journal of Hydrology: Regional Studies
, Vol.
32
, p.
100742
.
Bui
,
M.T.
and
Dang
,
T.A.
(
2025
), “
Shifting in rainy season features in the mekong Delta under the background of global climate change
”,
Indian Journal Of Agricultural Research
, Vol.
59
pp.
827
-
832
.
Bussi
,
G.
,
Darby
,
S.E.
,
Whitehead
,
P.G.
,
Jin
,
L.
,
Dadson
,
S.J.
,
Voepel
,
H.E.
,
Vasilopoulos
,
G.
,
Hackney
,
C.R.
,
Hutton
,
C.
,
Berchoux
,
T.
,
Parsons
,
D.R.
and
Nicholas
,
A.
(
2021
), “
Impact of dams and climate change on suspended sediment flux to the mekong Delta
”,
Science of The Total Environment
, Vol.
755
, p.
142468
, doi: .
Chau
,
Q.N.X.
,
Ngo
,
G.N.H.
,
Nguyen
,
C.T.
,
Dang
,
A.T.
and
Nguyen
,
V.D.
(
2026
), “
Hydrodynamic impacts of tributary sluice gate operations on salinity intrusion in the tien river, vietnamese mekong Delta
”,
Journal of Water Management Modeling
, Vol.
34
No.
C575
, doi: .
Giosan
,
L.
,
Syvitski
,
J.
,
Constantinescu
,
S.
and
Day
,
J.
(
2014
), “
Climate change: protect the world’s deltas
”,
Nature
, Vol.
516
No.
7529
, pp.
31
-
33
.
Grumbine
,
R.E.
and
Xu
,
J.
(
2011
), “
Mekong hydropower development
”,
Science
, Vol.
332
No.
6026
, pp.
178
-
179
.
Hecht
,
J.S.
,
Lacombe
,
G.
,
Arias
,
M.E.
,
Dang
,
T.A.
and
Piman
,
T.
(
2019
), “
Hydropower dams of the mekong river basin: a review of their hydrological impacts
”,
Journal of Hydrology
, Vol.
568
, pp.
285
-
300
.
Huy
,
N.D.Q.
,
Kim
,
T.T.
and
Truong An
,
D.
(
2025
), “
Hydrological regime variability between the tien and hau Rivers under the impact of anthropogenic activities and climate change
”,
Journal of Environmental and Earth Sciences
, Vol.
7
No.
5
, pp.
96
-
107
.
Kendall
,
M.G.
(
1975
),
Rank Correlation Methods
,
Charles Griffin
,
London
.
Kondolf
,
G.M.
,
Rubin
,
Z.K.
and
Minear
,
J.T.
(
2014
), “
Dams on the mekong: cumulative sediment starvation
”,
Water Resources Research
, Vol.
50
No.
6
, pp.
5158
-
5169
.
Kummu
,
M.
and
Varis
,
O.
(
2007
), “
Sediment-related impacts due to upstream reservoir trapping, the lower mekong river
”,
Geomorphology
, Vol.
85
Nos.
3-4
, pp.
275
-
293
.
Lauri
,
H.
,
de Moel
,
H.
,
Ward
,
P.J.
,
Räsänen
,
T.A.
,
Keskinen
,
M.
and
Kummu
,
M.
(
2012
), “
Future changes in mekong river hydrology: impact of climate change and reservoir operation on discharge
”,
Hydrology and Earth System Sciences
, Vol.
16
No.
12
, pp.
4603
-
4619
.
Lee
,
S.K.
and
Dang
,
T.A.
(
2019
), “
Spatio-temporal variations in meteorology drought over the mekong river Delta of Vietnam in the recent decades
”,
Paddy and Water Environment
, Vol.
17
No.
1
, pp.
35
-
44
.
Li
,
D.
,
Long
,
D.
,
Zhao
,
J.
,
Lu
,
H.
and
Hong
,
Y.
(
2017
), “
Observed changes in flow regimes in the mekong river basin
”,
Journal of Hydrology
, Vol.
551
, pp.
217
-
232
.
Lu
,
X.X.
,
Chua
,
S.D.X.
and
Li
,
X.X.
(
2021
), “
River discharge and water level changes in the mekong river: droughts in an era of mega-dams
”,
Water
, Vol.
13
No.
22
, p.
3254
.
Ly
,
S.
,
Sayama
,
T.
and
Try
,
S.
(
2023
), “
Integrated impact assessment of climate change and hydropower operation on streamflow and inundation in the lower mekong basin
”,
Progress in Earth and Planetary Science
, Vol.
10
No.
1
, p.
55
.
Mann
,
H.B.
(
1945
), “
Nonparametric tests against trend
”,
Econometrica
, Vol.
13
No.
3
, pp.
245
-
259
.
Minderhoud
,
P.S.
,
Coumou
,
L.
,
Erban
,
L.E.
,
Middelkoop
,
H.
,
Stouthamer
,
E.
and
Addink
,
E.A.
(
2019
), “
The relation between land use and subsidence in the vietnamese mekong Delta
”,
Science of The Total Environment
, Vol.
634
, pp.
715
-
726
.
MRC
(
2019
),
State of the Basin Report 2018
,
Mekong River Commission
,
Vientiane
.
Nguyen
,
C.T.
,
Nguyen
,
X.K.
,
Nguyen
,
N.H.
and
Dang
,
T.A.
(
2025a
), “
Impacts of anthropogenic stressors and climate change on hydrology regime in the vietnamese mekong Delta
”,
International Journal of Climate Change Strategies and Management
, doi: .
Nguyen
,
C.T.
,
Xuan Tran
,
V.
,
Nguyen
,
N.H.
and
Dang
,
T.A.
(
2025b
), “
Recent acceleration of tidal amplification in the vietnamese mekong Delta: drivers and environmental change implications
”,
Ocean Science Journal
, Vol.
60
No.
4
, p.
46
, doi: .
Quang
,
N.X.C.
,
Hoa
,
V.H.
,
Giang
,
N.H.N.
,
Sabo
,
J.L.
,
Nguyen
,
T.T.
,
Quoc
,
B.P.
and
Truong
,
A.D.
(
2026
), “
Mitigating salinity intrusion in the vietnamese mekong Delta: a hydrodynamic modelling study of temporary flow regulation scenarios
”,
Environmental Research Communications
, Vol.
8
No.
1
, p.
015009
, doi: .
Räsänen
,
T.A.
,
Someth
,
P.
,
Lauri
,
H.
,
Koponen
,
J.
,
Sarkkula
,
J.
and
Kummu
,
M.
(
2017
), “
Observed river discharge changes due to hydropower operations in the upper mekong basin
”,
Journal of Hydrology
, Vol.
545
, pp.
28
-
41
.
Richter
,
B.D.
,
Baumgartner
,
J.V.
,
Powell
,
J.
and
Braun
,
D.P.
(
1996
), “
A method for assessing hydrologic alteration within ecosystems
”,
Conservation Biology
, Vol.
10
No.
4
, pp.
1163
-
1174
.
Rogozhina
,
N.G.
(
2022
), “
Socio-environmental problems of the mekong Delta in Vietnam
”,
The Russian Journal of Vietnamese Studies
, Vol.
6
No.
2
, pp.
37
-
45
.
Schmitt
,
R.J.
,
Rubin
,
Z.
and
Kondolf
,
G.M.
(
2017
), “
Losing ground—scenarios for subsidence and sea-level rise in the mekong Delta
”,
Science of the Total Environment
, Vol.
596
, pp.
70
-
79
.
Syvitski
,
J.P.M.
,
Kettner
,
A.J.
,
Overeem
,
I.
,
Hutton
,
E.W.
,
Hannon
,
M.T.
,
Brakenridge
,
G.R.
,
Day
,
J.
,
Vörösmarty
,
C.
,
Saito
,
Y.
,
Giosan
,
L.
and
Nicholls
,
R.J.
(
2009
), “
Sinking deltas due to human activities
”,
Nature Geoscience
, Vol.
2
No.
10
, pp.
681
-
686
.
Uy
,
S.
,
Hogan
,
Z.S.
,
Grenouillet
,
G.
,
Lek
,
S.
,
Chandra
,
S.
and
Ngor
,
P.B.
(
2025
), “
Declining fish sizes across the lower mekong basin highlights urgent conservation needs
”,
Biological Conservation
, Vol.
310
, p.
111384
, doi: .
Wang
,
J.J.
,
Lu
,
X.X.
and
Kummu
,
M.
(
2011
), “
Sediment load estimates and variations in the lower mekong river
”,
River Research and Applications
, Vol.
27
No.
1
, pp.
33
-
46
.
Webster
,
P.J.
and
Yang
,
S.
(
1992
), “
Monsoon and ENSO: selectively interactive systems
”,
Quarterly Journal of the Royal Meteorological Society
, Vol.
118
No.
507
, pp.
877
-
926
, doi: .
Wolman
,
M.G.
and
Miller
,
J.P.
(
1960
), “
Magnitude and frequency of forces in geomorphic processes
”,
The Journal of Geology
, Vol.
68
No.
1
, pp.
54
-
74
.
Xue
,
Z.
,
He
,
R.
,
Liu
,
J.P.
and
Warner
,
J.C.
(
2012
), “
Modeling transport and deposition of the mekong river sediment
”,
Continental Shelf Research
, Vol.
37
No.
12
, pp.
66
-
78
.
Zoccarato
,
C.
,
Minderhoud
,
P.S.
and
Teatini
,
P.
(
2018
), “
The role of sedimentation and natural compaction in a prograding Delta: the case of the mega mekong Delta
”,
Scientific Reports
, Vol.
8
No.
1
, pp.
1
-
13
.
Published by Emerald Publishing Limited. This article is published under the Creative Commons Attribution (CC BY 4.0) licence. Anyone may reproduce, distribute, translate and create derivative works of this article (for both commercial and non-commercial purposes), subject to full attribution to the original publication and authors. The full terms of this licence maybe seen at Link to the terms of the CC BY 4.0 licenceLink to the terms of the CC BY 4.0 licence.

Data & Figures

Figure 1.
A map locates the Mekong River, hydroelectric dams, and gauge stations across China, Myanmar, Laos, Thailand, Cambodia, and Vietnam.The map covers the Mekong River basin across China, Myanmar, Laos, Thailand, Cambodia, and Vietnam. The Mekong River and its tributaries extend from northern China to the East Sea. Red circles mark hydroelectric dams, concentrated along the upper Mekong in China, including Wunonglong, Lidi, Huangdeng, Dahuqiao, Gongguoqiao, Xiaowan, Manwan, Dachaoshan, Nuozhadu, Jinghong, and Xayaburi, with Don Sahong in Cambodia. Purple inverted triangles mark gauge stations at Luang Prabang, Vientiane, Mukdahan, Pakse, Kratie, Chaktomuk, My Thuan, and Can Tho. Major place names include Miaowei, Linghong, Bassac, Tan Chau, and Vam Kenh. Latitude and longitude are labelled, a north arrow is provided, and a scale bar ranges from 0 to 200 kilometres.

Map of the study area with gauge locations shown in pink triangles

Figure 1.
A map locates the Mekong River, hydroelectric dams, and gauge stations across China, Myanmar, Laos, Thailand, Cambodia, and Vietnam.The map covers the Mekong River basin across China, Myanmar, Laos, Thailand, Cambodia, and Vietnam. The Mekong River and its tributaries extend from northern China to the East Sea. Red circles mark hydroelectric dams, concentrated along the upper Mekong in China, including Wunonglong, Lidi, Huangdeng, Dahuqiao, Gongguoqiao, Xiaowan, Manwan, Dachaoshan, Nuozhadu, Jinghong, and Xayaburi, with Don Sahong in Cambodia. Purple inverted triangles mark gauge stations at Luang Prabang, Vientiane, Mukdahan, Pakse, Kratie, Chaktomuk, My Thuan, and Can Tho. Major place names include Miaowei, Linghong, Bassac, Tan Chau, and Vam Kenh. Latitude and longitude are labelled, a north arrow is provided, and a scale bar ranges from 0 to 200 kilometres.

Map of the study area with gauge locations shown in pink triangles

Close modal
Figure 2.
Four time-series plots compare observed river discharge from 2000 to 2024, with recurring peaks and positive Sen slope trends in every panel.Panels a to d plot discharge against time from 2000 to 2024. The vertical axis ranges from 0 to 40,000 cubic metres per second. Panel a contains variable seasonal peaks, including the highest peak near 2019, and a rising Sen slope with beta equal to 10.9. Panel b contains frequent annual peaks, generally between about 20,000 and 36,000 cubic metres per second, with beta equal to 2.06. Panel c contains repeated peaks reaching nearly 40,000 cubic metres per second, followed by lower peaks after 2019, with beta equal to 1.98. Panel d contains regular fluctuations, mostly below 25,000 cubic metres per second, and increases towards 2024, with beta equal to 2.70.

Discharge trends at (a) Luang Prabang, (b) Pakse, (c) Mukdahan and (d) Tan Chau during 2000–2024

Figure 2.
Four time-series plots compare observed river discharge from 2000 to 2024, with recurring peaks and positive Sen slope trends in every panel.Panels a to d plot discharge against time from 2000 to 2024. The vertical axis ranges from 0 to 40,000 cubic metres per second. Panel a contains variable seasonal peaks, including the highest peak near 2019, and a rising Sen slope with beta equal to 10.9. Panel b contains frequent annual peaks, generally between about 20,000 and 36,000 cubic metres per second, with beta equal to 2.06. Panel c contains repeated peaks reaching nearly 40,000 cubic metres per second, followed by lower peaks after 2019, with beta equal to 1.98. Panel d contains regular fluctuations, mostly below 25,000 cubic metres per second, and increases towards 2024, with beta equal to 2.70.

Discharge trends at (a) Luang Prabang, (b) Pakse, (c) Mukdahan and (d) Tan Chau during 2000–2024

Close modal
Figure 3.
Eight time-series plots compare dry and rainy season rainfall trends at four stations, with mostly decreasing Sen slope trends except one increasing trend.The figure contains eight time-series plots arranged in two groups. The upper four plots show dry season rainfall at Luang Prabang, Kratie, Pakse, and Tan Chau from 2000 to 2024. The vertical axis ranges from 0 to 750 millimetres. All four stations show fluctuating observed rainfall with decreasing Sen slope trends. The Sen slopes are minus 2.1 at Luang Prabang, minus 1.7 at Kratie, minus 3.6 at Pakse, and minus 2.8 at Tan Chau. The lower four plots show rainy season rainfall at the same stations. The vertical axis ranges from 0 to 3000 millimetres. Luang Prabang, Pakse, and Tan Chau show decreasing Sen slope trends of minus 14.8, minus 24.9, and minus 16.8, respectively. Kratie shows an increasing Sen slope trend of 5.8. Observed rainfall varies from year to year at all stations.

Rainfall trends at (a) Luang Prabang, (b) Kratie, (c) Pakse and (d) Tan Chau in the dry season (upper) and the rainy season (below) during 2000–2024

Figure 3.
Eight time-series plots compare dry and rainy season rainfall trends at four stations, with mostly decreasing Sen slope trends except one increasing trend.The figure contains eight time-series plots arranged in two groups. The upper four plots show dry season rainfall at Luang Prabang, Kratie, Pakse, and Tan Chau from 2000 to 2024. The vertical axis ranges from 0 to 750 millimetres. All four stations show fluctuating observed rainfall with decreasing Sen slope trends. The Sen slopes are minus 2.1 at Luang Prabang, minus 1.7 at Kratie, minus 3.6 at Pakse, and minus 2.8 at Tan Chau. The lower four plots show rainy season rainfall at the same stations. The vertical axis ranges from 0 to 3000 millimetres. Luang Prabang, Pakse, and Tan Chau show decreasing Sen slope trends of minus 14.8, minus 24.9, and minus 16.8, respectively. Kratie shows an increasing Sen slope trend of 5.8. Observed rainfall varies from year to year at all stations.

Rainfall trends at (a) Luang Prabang, (b) Kratie, (c) Pakse and (d) Tan Chau in the dry season (upper) and the rainy season (below) during 2000–2024

Close modal
Figure 4.
Three line graphs compare monthly river discharge at Luang Prabang, Pakse, and Tan Chau across selected years, showing seasonal peaks during mid to late year.Panels a to c compare monthly discharge from January to December at Luang Prabang, Pakse, and Tan Chau. The vertical axis ranges from 0 to 40,000 cubic metres per second. Each panel includes observed data for 2000, 2008, 2015, 2019, 2021, 2024, and a dashed line for 2000 to 2008. Panel a shows low discharge from January to May, followed by a sharp rise from June and a pronounced peak in September before declining towards December. Panel b shows a gradual increase from May, with discharge generally peaking during July to September before decreasing through the remaining months. Panel c shows declining discharge from January to April, increasing from May to a broad peak during September and October, and then decreasing towards December.

Relationship between discharge and special weather events (ENSO) at selected Mekong monitoring stations shown in the figure; Table 4 provides the corresponding ENSO-year comparison for Luang Prabang, Pakse, Kratie and Tan Chau

Figure 4.
Three line graphs compare monthly river discharge at Luang Prabang, Pakse, and Tan Chau across selected years, showing seasonal peaks during mid to late year.Panels a to c compare monthly discharge from January to December at Luang Prabang, Pakse, and Tan Chau. The vertical axis ranges from 0 to 40,000 cubic metres per second. Each panel includes observed data for 2000, 2008, 2015, 2019, 2021, 2024, and a dashed line for 2000 to 2008. Panel a shows low discharge from January to May, followed by a sharp rise from June and a pronounced peak in September before declining towards December. Panel b shows a gradual increase from May, with discharge generally peaking during July to September before decreasing through the remaining months. Panel c shows declining discharge from January to April, increasing from May to a broad peak during September and October, and then decreasing towards December.

Relationship between discharge and special weather events (ENSO) at selected Mekong monitoring stations shown in the figure; Table 4 provides the corresponding ENSO-year comparison for Luang Prabang, Pakse, Kratie and Tan Chau

Close modal
Table 1.

Basic information on precipitation gauges and water level observation stations

StationLongLatRainfall (mm)Discharge (m3/s)Duration (year)
Luang Prabang102.1319.88xx2000–2024
Kratie106.0112.48xx2000–2024
Pakse105.8115.09xx2000–2024
Mukdahan104.7316.58x2000–2024
Tan Chau105.2410.80xx2000–2024
Note(s):

X in Table 1 only means that the stations Luang Prabang, Kratie, Pakse and Tan Chau have both rainfall and discharge while Mukdahan only has discharge data

Table 2.

Trend analysis results for discharge at stations along the Mekong River (2000–2024)

TypeTrendp-valueβSignificantτDuration
Luang Prabang
AnnualIncreasing0.011206.6Yes0.3672000–2024
Dry seasonIncreasing0.002110.0Yes0.4532000–2024
Flood seasonNo trend0.118287.8No0.2272000–2024
Pakse
AnnualDecreasing0.007−152.9Yes−0.3872000–2024
Dry seasonIncreasing0.03836.8Yes0.3002000–2024
Flood seasonDecreasing0.003−351.3Yes−0.4272000–2024
Mukdahan
AnnualDecreasing0.038−107.6Yes−0.3002000–2024
Dry seasonIncreasing<0.001393.4Yes0.5472000–2024
Flood seasonDecreasing<0.001−645.7Yes−0.6472000–2024
Kratie
AnnualDecreasing0.034−137.5Yes−0.3072000–2024
Dry seasonNo trend0.07234.1No0.2602000–2024
Flood seasonDecreasing0.012−299.4Yes−0.3602000–2024
Tan Chau
AnnualNo trend0.69121.6No0.0602000–2024
Dry seasonNo trend0.44121.9No0.1132000–2024
Flood seasonNo trend0.944−15.4No−0.0132000–2024
Note(s):

β: Sen’s slope

Table 3.

Trend analysis results for rainfall characteristics along the Mekong River (2000–2024)

SeasonTrendp-valueβSignificant
Luang Prabang
AnnualNo trend0.129−16.2No
Dry seasonNo trend0.053−7.1No
Rainy seasonNo trend0.168−9.3No
Kratie
AnnualNo trend0.8804.4No
Dry seasonNo trend0.5443.8No
Rainy seasonNo trend0.762−2.3No
Pakse
AnnualNo trend0.088−21.9No
Dry seasonNo trend0.053−10.2No
Rainy seasonNo trend0.338−11.6No
Tan Chau
AnnualDecreasing0.011−20.1Yes
Dry seasonNo trend0.216−4.1No
Rainy seasonDecreasing0.021−12.9Yes
Note(s):

β: Sen’s slope

Table 4.

Comparison of flood peak and dry season discharge between El-Niño/La-Niña years and the 2000–2008 baseline

MetricBaseline (2000–2008)La Nina 2000 (%)La Nina 2008 (%)La Nina 2021 (%)El Nino 2015 (%)El Nino 2019 (%)El Nino 2024 (%)
Luang Prabang
Flood peak (m3/s)15,80917,714 + 12.021,841 + 38.221,993 + 39.18,747 −44.748,262 + 205.337,306 + 136.0
Dry season (m3/s)1,4701,814 + 23.41,593 + 8.43,412 + 132.13,278 + 123.04,043 + 175.03,042 + 106.9
Pakse
Flood peak (m3/s)37,49645,149 + 20.434,099 −9.121,993 −41.329,222 −22.148,262 + 28.737,306 −0.5
Dry season (m3/s)2,9343578 + 22.03,520 + 20.03,430 + 16.93,578 + 22.04,034 + 37.53,062 + 4.4
Kratie
Flood peak (m3/s)43,85448,461 + 10.539,374 −10.232,655 −25.531,558 −28.049,793 + 13.545,067 + 2.8
Dry season (m3/s)3,7804356 + 15.24,257 + 12.64,225 + 11.84,021 + 6.44,782 + 26.53,815 + 0.9
Tan Chau
Flood peak (m3/s)22,40626,000 + 16.019,762 −11.823,100 + 3.117,633 −21.325,012 + 11.626,700 + 19.2
Dry season (m3/s)4,9285,491 + 11.45,475 + 11.15,253 + 6.64,270 −13.44,942 + 0.34,993 + 1.3
Table 5.

Discharge analysis results using RVA and HAF indices for Mekong stations

MonthTarget range (m3/s)Observed frequency (%)HAF factorAlteration levelMWUp-value
Luang Prabang
Feb976.7–1372.76.7−0.87High<0.001
Mar935.9–1174.50.0−1.00High<0.001
Apr928.5–1170.20.0−1.00High<0.001
Aug8,024.2–11,412.70.0−1.00High0.846
Sep6,690.9–9,839.00.0−1.00High0.560
Oct4,725.6–5,980.413.3−0.73High0.028
Pakse
Feb2,227.6–2,645.76.7−0.87High0.003
Mar1,989.5–2,318.40.0−1.00High<0.001
Apr1,956.6–2,409.46.7−0.87High<0.001
Aug24,501.0–33,415.420.0−0.60Moderate0.028
Sep24,385.5–32,285.440.0−0.20Low0.127
Oct15,203.1–17,523.020.0−0.60Moderate0.255
Mukdahan
Feb2,125.9–2574.70.0−1.00High<0.001
Mar1,994.8–2261.30.0−1.00High<0.001
Apr2,024.6–2354.06.7−0.87High<0.001
Aug19,940.2–29,441.113.3−0.73High0.001
Sep19,933.3–24,854.26.7−0.87High0.001
Oct10,350.0–14,138.76.7−0.87High0.001
Kratie
Feb2,763.2–3,075.30.0−1.00High0.033
Mar2,468.8–2,796.46.7−0.87High0.010
Apr2,666.3–2,879.30.0−1.00High<0.001
Aug32,411.0–39,384.220.0−0.60Moderate0.018
Sep29,689.9–39,948.246.7−0.07Low0.157
Oct22,283.6–26,796.835.7−0.29Low0.188
Tan Chau
Feb3,775.6–4,846.646.7−0.07Low0.560
Mar2,532.0–3,151.526.7−0.47Moderate0.174
Apr2,109.1–2,673.320.0−0.60Moderate0.004
Aug18,574.7–20,117.420.0−0.60Moderate0.454
Sep18,908.1–21,442.026.7−0.47Moderate1.000
Oct18,520.7–19,793.620.0−0.60Moderate0.598
Note(s):

MWU is Mann–Whitney U test

Table 6.

Rainfall analysis results using RVA and HAF indices for Mekong stations

MonthTarget range (mm)Observed frequency (%)HAF factorAlteration levelMWUp -valueSignificance
Luang Prabang
Feb0.0–20.088.9+0.78High0.513Not sig.
Mar24.0–89.077.8+0.56Moderate0.288Not sig.
Apr51.0–140.066.7+0.33Moderate0.567Not sig.
Aug259.0–322.011.1−0.78High0.806Not sig.
Sep161.0–256.033.3−0.33Moderate0.567Not sig.
Oct50.0–166.077.8+0.56Moderate0.934Not sig.
Kratie
Apr90.8–140.312.5−0.75High0.292Not sig.
May100.0–194.037.5−0.25Low0.866Not sig.
Aug273.0–375.012.5−0.75High0.131Not sig.
Sep283.5–385.537.5−0.25Low0.737Not sig.
Oct154.0–195.520.0−0.6Moderate0.635Not sig.
Pakse
Feb0.0–2.088.9+0.78High0.369Not sig.
Mar10.0–71.011.1−0.78High0.001Significant
Apr23.0–67.055.6+0.11Low0.806Not sig.
Aug385.0–691.044.4−0.11Low0.165Not sig.
Sep236.0–388.011.1−0.78High0.414Not sig.
Oct51.0–206.055.6+0.11Low0.462Not sig.
Tan Chau
Feb0.0–5.066.7+0.33Moderate0.183Not sig.
Mar0.0–37.086.7+0.73High0.405Not sig.
Apr40.0–120.046.7−0.07Low0.579Not sig.
Aug118.0–200.040.0−0.20Low0.267Not sig.
Sep150.0–240.060.0+0.20Low0.541Not sig.
Oct251.0–318.033.3−0.33Moderate0.244Not sig.

Supplements

References

Anthony
,
E.J.
,
Brunier
,
G.
,
Besset
,
M.
,
Goichot
,
M.
,
Dussouillez
,
P.
and
Nguyen
,
V.L.
(
2015
), “
Linking rapid erosion of the mekong river Delta to human activities
”,
Scientific Reports
, Vol.
5
No.
1
, p.
14745
.
Arias
,
M.E.
,
Piman
,
T.
,
Lauri
,
H.
,
Cochrane
,
T.A.
and
Kummu
,
M.
(
2014
), “
Dams on mekong tributaries as significant contributors of hydrological alterations to the tonle sap floodplain in Cambodia
”,
Hydrology and Earth System Sciences
, Vol.
18
No.
12
, pp.
5303
-
5315
.
Binh
,
D.V.
,
Kantoush
,
S.A.
,
Saber
,
M.
,
Mai
,
N.P.
,
Maskey
,
S.
,
Phong
,
D.T.
and
Sumi
,
T.
(
2020
), “
Long-term alterations of flow regimes of the mekong river and adaptation strategies for the vietnamese mekong Delta
”,
Journal of Hydrology: Regional Studies
, Vol.
32
, p.
100742
.
Bui
,
M.T.
and
Dang
,
T.A.
(
2025
), “
Shifting in rainy season features in the mekong Delta under the background of global climate change
”,
Indian Journal Of Agricultural Research
, Vol.
59
pp.
827
-
832
.
Bussi
,
G.
,
Darby
,
S.E.
,
Whitehead
,
P.G.
,
Jin
,
L.
,
Dadson
,
S.J.
,
Voepel
,
H.E.
,
Vasilopoulos
,
G.
,
Hackney
,
C.R.
,
Hutton
,
C.
,
Berchoux
,
T.
,
Parsons
,
D.R.
and
Nicholas
,
A.
(
2021
), “
Impact of dams and climate change on suspended sediment flux to the mekong Delta
”,
Science of The Total Environment
, Vol.
755
, p.
142468
, doi: .
Chau
,
Q.N.X.
,
Ngo
,
G.N.H.
,
Nguyen
,
C.T.
,
Dang
,
A.T.
and
Nguyen
,
V.D.
(
2026
), “
Hydrodynamic impacts of tributary sluice gate operations on salinity intrusion in the tien river, vietnamese mekong Delta
”,
Journal of Water Management Modeling
, Vol.
34
No.
C575
, doi: .
Giosan
,
L.
,
Syvitski
,
J.
,
Constantinescu
,
S.
and
Day
,
J.
(
2014
), “
Climate change: protect the world’s deltas
”,
Nature
, Vol.
516
No.
7529
, pp.
31
-
33
.
Grumbine
,
R.E.
and
Xu
,
J.
(
2011
), “
Mekong hydropower development
”,
Science
, Vol.
332
No.
6026
, pp.
178
-
179
.
Hecht
,
J.S.
,
Lacombe
,
G.
,
Arias
,
M.E.
,
Dang
,
T.A.
and
Piman
,
T.
(
2019
), “
Hydropower dams of the mekong river basin: a review of their hydrological impacts
”,
Journal of Hydrology
, Vol.
568
, pp.
285
-
300
.
Huy
,
N.D.Q.
,
Kim
,
T.T.
and
Truong An
,
D.
(
2025
), “
Hydrological regime variability between the tien and hau Rivers under the impact of anthropogenic activities and climate change
”,
Journal of Environmental and Earth Sciences
, Vol.
7
No.
5
, pp.
96
-
107
.
Kendall
,
M.G.
(
1975
),
Rank Correlation Methods
,
Charles Griffin
,
London
.
Kondolf
,
G.M.
,
Rubin
,
Z.K.
and
Minear
,
J.T.
(
2014
), “
Dams on the mekong: cumulative sediment starvation
”,
Water Resources Research
, Vol.
50
No.
6
, pp.
5158
-
5169
.
Kummu
,
M.
and
Varis
,
O.
(
2007
), “
Sediment-related impacts due to upstream reservoir trapping, the lower mekong river
”,
Geomorphology
, Vol.
85
Nos.
3-4
, pp.
275
-
293
.
Lauri
,
H.
,
de Moel
,
H.
,
Ward
,
P.J.
,
Räsänen
,
T.A.
,
Keskinen
,
M.
and
Kummu
,
M.
(
2012
), “
Future changes in mekong river hydrology: impact of climate change and reservoir operation on discharge
”,
Hydrology and Earth System Sciences
, Vol.
16
No.
12
, pp.
4603
-
4619
.
Lee
,
S.K.
and
Dang
,
T.A.
(
2019
), “
Spatio-temporal variations in meteorology drought over the mekong river Delta of Vietnam in the recent decades
”,
Paddy and Water Environment
, Vol.
17
No.
1
, pp.
35
-
44
.
Li
,
D.
,
Long
,
D.
,
Zhao
,
J.
,
Lu
,
H.
and
Hong
,
Y.
(
2017
), “
Observed changes in flow regimes in the mekong river basin
”,
Journal of Hydrology
, Vol.
551
, pp.
217
-
232
.
Lu
,
X.X.
,
Chua
,
S.D.X.
and
Li
,
X.X.
(
2021
), “
River discharge and water level changes in the mekong river: droughts in an era of mega-dams
”,
Water
, Vol.
13
No.
22
, p.
3254
.
Ly
,
S.
,
Sayama
,
T.
and
Try
,
S.
(
2023
), “
Integrated impact assessment of climate change and hydropower operation on streamflow and inundation in the lower mekong basin
”,
Progress in Earth and Planetary Science
, Vol.
10
No.
1
, p.
55
.
Mann
,
H.B.
(
1945
), “
Nonparametric tests against trend
”,
Econometrica
, Vol.
13
No.
3
, pp.
245
-
259
.
Minderhoud
,
P.S.
,
Coumou
,
L.
,
Erban
,
L.E.
,
Middelkoop
,
H.
,
Stouthamer
,
E.
and
Addink
,
E.A.
(
2019
), “
The relation between land use and subsidence in the vietnamese mekong Delta
”,
Science of The Total Environment
, Vol.
634
, pp.
715
-
726
.
MRC
(
2019
),
State of the Basin Report 2018
,
Mekong River Commission
,
Vientiane
.
Nguyen
,
C.T.
,
Nguyen
,
X.K.
,
Nguyen
,
N.H.
and
Dang
,
T.A.
(
2025a
), “
Impacts of anthropogenic stressors and climate change on hydrology regime in the vietnamese mekong Delta
”,
International Journal of Climate Change Strategies and Management
, doi: .
Nguyen
,
C.T.
,
Xuan Tran
,
V.
,
Nguyen
,
N.H.
and
Dang
,
T.A.
(
2025b
), “
Recent acceleration of tidal amplification in the vietnamese mekong Delta: drivers and environmental change implications
”,
Ocean Science Journal
, Vol.
60
No.
4
, p.
46
, doi: .
Quang
,
N.X.C.
,
Hoa
,
V.H.
,
Giang
,
N.H.N.
,
Sabo
,
J.L.
,
Nguyen
,
T.T.
,
Quoc
,
B.P.
and
Truong
,
A.D.
(
2026
), “
Mitigating salinity intrusion in the vietnamese mekong Delta: a hydrodynamic modelling study of temporary flow regulation scenarios
”,
Environmental Research Communications
, Vol.
8
No.
1
, p.
015009
, doi: .
Räsänen
,
T.A.
,
Someth
,
P.
,
Lauri
,
H.
,
Koponen
,
J.
,
Sarkkula
,
J.
and
Kummu
,
M.
(
2017
), “
Observed river discharge changes due to hydropower operations in the upper mekong basin
”,
Journal of Hydrology
, Vol.
545
, pp.
28
-
41
.
Richter
,
B.D.
,
Baumgartner
,
J.V.
,
Powell
,
J.
and
Braun
,
D.P.
(
1996
), “
A method for assessing hydrologic alteration within ecosystems
”,
Conservation Biology
, Vol.
10
No.
4
, pp.
1163
-
1174
.
Rogozhina
,
N.G.
(
2022
), “
Socio-environmental problems of the mekong Delta in Vietnam
”,
The Russian Journal of Vietnamese Studies
, Vol.
6
No.
2
, pp.
37
-
45
.
Schmitt
,
R.J.
,
Rubin
,
Z.
and
Kondolf
,
G.M.
(
2017
), “
Losing ground—scenarios for subsidence and sea-level rise in the mekong Delta
”,
Science of the Total Environment
, Vol.
596
, pp.
70
-
79
.
Syvitski
,
J.P.M.
,
Kettner
,
A.J.
,
Overeem
,
I.
,
Hutton
,
E.W.
,
Hannon
,
M.T.
,
Brakenridge
,
G.R.
,
Day
,
J.
,
Vörösmarty
,
C.
,
Saito
,
Y.
,
Giosan
,
L.
and
Nicholls
,
R.J.
(
2009
), “
Sinking deltas due to human activities
”,
Nature Geoscience
, Vol.
2
No.
10
, pp.
681
-
686
.
Uy
,
S.
,
Hogan
,
Z.S.
,
Grenouillet
,
G.
,
Lek
,
S.
,
Chandra
,
S.
and
Ngor
,
P.B.
(
2025
), “
Declining fish sizes across the lower mekong basin highlights urgent conservation needs
”,
Biological Conservation
, Vol.
310
, p.
111384
, doi: .
Wang
,
J.J.
,
Lu
,
X.X.
and
Kummu
,
M.
(
2011
), “
Sediment load estimates and variations in the lower mekong river
”,
River Research and Applications
, Vol.
27
No.
1
, pp.
33
-
46
.
Webster
,
P.J.
and
Yang
,
S.
(
1992
), “
Monsoon and ENSO: selectively interactive systems
”,
Quarterly Journal of the Royal Meteorological Society
, Vol.
118
No.
507
, pp.
877
-
926
, doi: .
Wolman
,
M.G.
and
Miller
,
J.P.
(
1960
), “
Magnitude and frequency of forces in geomorphic processes
”,
The Journal of Geology
, Vol.
68
No.
1
, pp.
54
-
74
.
Xue
,
Z.
,
He
,
R.
,
Liu
,
J.P.
and
Warner
,
J.C.
(
2012
), “
Modeling transport and deposition of the mekong river sediment
”,
Continental Shelf Research
, Vol.
37
No.
12
, pp.
66
-
78
.
Zoccarato
,
C.
,
Minderhoud
,
P.S.
and
Teatini
,
P.
(
2018
), “
The role of sedimentation and natural compaction in a prograding Delta: the case of the mega mekong Delta
”,
Scientific Reports
, Vol.
8
No.
1
, pp.
1
-
13
.

Languages

or Create an Account

Close Modal
Close Modal