The findings and recommendations of this study are important for policymakers, advocates and development practitioners who require the information for reassessment, evaluation and integration into their development and humanitarian programs and operational strategies. Most importantly, this study aims to provide a useful evaluation of the severity of climate change impacts and offers insight on effective, contextualized adaptation strategies.
This study was conducted to evaluate climate change, climate variability and drought with their impacts on pastoral livelihoods in Borana. A total of 280 pastoralist households were sampled using multistage sampling techniques. Quantitative data were analysed using descriptive statistics and a chi-square test was employed to assess the significance of climate change impacts on pastoral livelihoods between the Dirree and Golboo production systems. Mann–Kendall and Sen’s slope tests were used to determine climate trends and magnitudes of change, respectively. Rainfall variability was assessed using the coefficient of variation and standardized precipitation index.
The results revealed significant inter-annual rainfall variability, with coefficients of variation of 18.5% in Dubuluk (medium variability) and 31.2% in Dilloo (high variability). Negative standardized precipitation index indicated an increased frequency of drought, with 50% and 56.25% of years experiencing negative indices in Dubuluk and Dilloo respectively. Eight drought events (three severe, five moderate) were identified, 1991, 1999 and 2022 being extreme drought years. These droughts resulted in livestock losses, reduced income, water scarcity, food shortages, weakened social support systems, human migration and increased suicide rates.
The study investigated impacts of drought due to climate change and variability on pastoralist livelihood within the pastoralist production systems and highlighted local and context specific adaptation and coping strategies in the area.
1. Introduction
Climate change is a global environmental phenomenon, occurring as a change of overall long-term patterns of temperature and precipitation, as well as other factors like atmospheric pressure and humidity levels in the environment (Bati, 2013; Murshed, 2020; Michel et al., 2021).
Climate has been changing at alarming rate since the beginning of industrial revolution the 1850 s (New et al., 2006), primarily due to anthropogenic drivers which increased atmospheric greenhouse gas concentrations such as CO2, CH4, N2O, and H2O (Amuzu et al., 2018; Murshed et al., 2020; Hussain et al., 2020; Sovacool et al., 2021; Murshed, 2022). Current climate change manifests worldwide as rising temperatures, altered precipitation patterns and more frequent and severe weather events like hurricanes and droughts, disruptions to ecosystems and biodiversity (Jiang et al., 2023; Heldmyer et al., 2023). However, these changes are not uniform across the globe with much more negative effects in developing world due to lower adaptive capacity (Ng’ang’a et al., 2020; Theodros, 2020; Godson-ibeji et al., 2022).
Moreover, the impacts of climate change have been observed on the interconnected social, economic and environmental sectors, and thereby, associated consequences, such as forced human migration, conflict, livestock mortality and crop failure and environmental degradation in developing countries (Simane et al., 2016; Firew and Cheru, 2021; Haidari et al., 2025). Climate change is now recognized as a global challenge with implications for economic growth, poverty reduction and food security (Leal Filho et al., 2021; Feliciano et al. 2022). Ethiopia is particularly vulnerable to climate change, frequently experiencing hazards, primarily drought and flood episodes (Burnett, 2013; Theodros, 2020). For instance, the cumulative effects of the recent drought is characterized as the most severe episode in terms of the loss of the livestock asset since the second half the nineteenth Century, triggered by the build-up of the failed rainfall over six consecutive seasons in the arid pastoral areas of Ethiopia, Borana in particular. Simultaneously, in contrast, flooding has damaged infrastructure and disrupted livelihoods in other parts of the country (World Bank Group (WBG), 2024).
Above all, climate change induced rainfall unpredictability and associated drought vagaries mark a feature of pastoral areas of Ethiopia (Solomon and Firew, 2018; Girma and Zelalem, 2022). Drought frequency has increased, occurring every one to two 2 years in recent periods, from the previous occurrence with 6–8 years interval (Reid et al., 2013; Wako, 2022).
The recurrent drought is linked to the decline in livestock population and production in these areas (Berhe et al., 2017; Cheng et al., 2022). This has led to significant transformations in pastoral way of life, increasing their vulnerability, eroding solidarity mechanisms for coping with droughts and driving destitution (Matiwos et al., 2022). In addition to this effect, encroachment by invasive species is significantly reducing livestock feed availability (Woldeamlak et al., 2015). Subsequently, in Southern Ethiopia, livestock and livestock-related production are highly sensitive to climate change and variability (Berhanu and Beyene, 2015; Shetie and Nura, 2024).
For instance, land degradation is increasing, and livestock numbers have been declining dramatically, and people are becoming more vulnerable to drought and resource-based conflicts (Eyasu and Feyera, 2010; Habte et al., 2022). Besides, climate-change-driven water-borne diseases (like diarrhoea and malaria) are recurrent (Tiruneh and Tegene, 2018). Communities perceive climate change primarily as a decrease in rainfall and a rise in temperatures. This situation contributes to drought, which in turn causes livestock losses, food insecurity, and conflicts stemming from competition for scarce resources (Tolera and Fayera, 2020; Muluken and Desta, 2021; Abrham and Mekuyie, 2022; Habte et al., 2022; Girma et al., 2025).
According to research conducted in the Borana, Afar, Somali and Southern regions of Ethiopia and elsewhere in the Horn of Africa (Muluken and Desta, 2021; Lelamo et al., 2022; Muse et al., 2023; Girma, 2025; Girma et al., 2025), pastoralists used various strategies to adapt to climate change. These include mixed crop-livestock production, diversifying livestock types, altering herd structures, splitting households, increasing mobility, engaging in off-farm activities, reducing consumption, migrating to urban areas, selling charcoal and firewood, receiving remittances and selling grazers to buy browser species of animals.
However, the absence of agricultural extension services with orientation to pastoralism and climate information has constrained pastoralists’ adaptation strategies tailored to the present-day complexities facing them. Access to climate information likely motivates households to prepare for both positive and negative weather conditions. Additionally, lack of market information, the widespread occurrence of animal diseases, insufficient veterinary services, falling livestock prices during drought periods and competition over limited resources, all contribute to these challenges (Tolera and Fayera, 2020; Gelgelo et al., 2021; Kemal et al., 2022; Lelamo et al., 2022; Muse et al., 2023).
Recent research on climate change in Borana and other pastoral regions of the country has concentrated on pastoralists’ perceptions of climate change, their adaptation strategies and the factors influencing these strategies (Gelgelo et al., 2021; Muluken and Desta, 2021; Kemal et al., 2022; Lelamo et al., 2022; Muse et al., 2023; Girma, 2025; Mulugeta et al., 2025). There exists a lacuna in the literature in addressing local level climate change trend analysis and its socioeconomic impacts in the Borana Zone. This paper, therefore, seeks to bridge this gap by investigating climate change and variability, drought and their impacts on pastoral livelihoods in the Zone.
2. Methodology
2.1 Study area
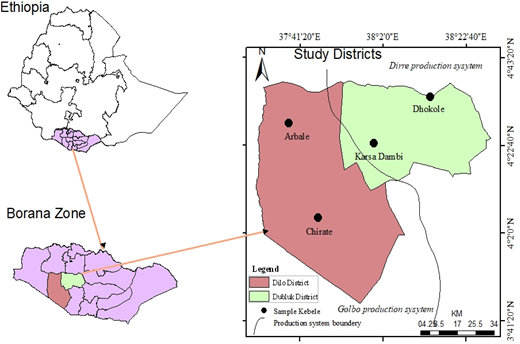
The study was conducted in Borana Zone, which comprises two agroecological zones – the high-altitude lands to the north and semi-arid lowlands to the south (Tache and Irwin, 2003). Specifically, Dubuluk and Dilloo sample districts, are located in central and south-western lowlands (Figure 1). The Borana section of the Oromo nation are the most populous inhabitants of the Zone (estimated over one million), among their Gabra and Guji kins. In major town centres (such as Yaballo, Mega and Moyale), other non-Oromo migrant groups of other Cushitic and Omotic backgrounds dwell with the indigenous inhabitants. Pastoralism remains the main source of livelihood for the majority of Borana households (Dalle et al., 2005), keeping cattle, sheep, goats, camels and equines (Tache and Sjaastad, 2008). The Zone receives bi-modal rainfall with an average range of 400–900 mm (Aklilu and Alebachew, 2009). But recent investigation shows significant reduction in the amount of the rainfall, now ranging between 285 and 741 mm (Worku et al., 2022). Crop cultivation is also practised (cultivating maize, teff and haricot beans) (Tache and Oba, 2010; Tilahun et al., 2017), and farm enclosures is expanding, the major triggering factor being the recent deadly drought.
Four seasons are defined locally, comprising two rainy seasons (long rains – bokkaha ganna, and short rains – bokkaha hagayyaa) and two dry seasons (long dry season – bona hagayyaa and the short dry season – adoolessa). In normal years, the long rains are received between March and May, and the short rains between September and October. During the two rainy seasons, the onset and cessation of the rains are often irregular, but the ganna rains are generally more reliable than the hagayyaa rains in their amount, temporal and spatial considerations (Tache, 2008; Tesfaye et al., 2024). The mean annual temperature ranges between 16.31°C and 29.66°C (Worku et al., 2022).
2.2 Study design
This study used both probability (random) and non-probability (purposive) sampling techniques. Dubuluk and Dilloo districts were purposively selected due to demographic dominance of pastoralist population and their vulnerability to climate change or drought. On the next stage, the districts were then stratified into two groups (Dirree and Golboo) based on their micro-climatic characteristics in which the communities practised their indigenous production systems. This stratification aimed to investigate potential differential climate change impacts on these distinct production systems. Subsequently, two localities (known as kebele in Ethiopia) were randomly selected from each, using the lottery method. Dhoqqolle and Qarsaa Dambii kebeles were sampled from the Dirree sub production system, while Arbale and Cirrate kebeles were sampled from the Golboo sub system. Finally, approximately 280 sample households were selected using Yemane’s (1967) statistical technique. The formula is presented as follows:
where:
n = sample size;
N = is population size;
e = is the level of precision (5%, 7% and 10%), but 5% precision was used; and
e = Margin of error or degree of accuracy (acceptable error term) (0.05).
2.3 Data collection and analysis
The study used a mixed method to collect quantitative and qualitative data from both primary and secondary sources (Creswell and Plano Clark, 2018). The primary data were collected through household survey (HHS); key informant interviews (KIIs) and focus group discussions (FGDs). Prior to data collection, a semi structured interview schedule was developed and administered to test the questionnaire, and pretesting contributed to the refinement of the questions and verification of the content’s feasibility for temporal planning. The questionnaire incorporated household information and their perceived impacts of climate change on pastoralists’ livelihoods.
HHS was undertaken between March and May 2023 by eight enumerators with two assigned to each kebele. KIIs were carried out with knowledgeable community members and relevant professionals, including development agents and teachers. In the FGDs, elderly and women and youth groups took part in separate sessions in each kebele, each group, consisting of 8–12 participants to gather comprehensive and diverse climatic knowledge and associated effects. The discussion took place in native Afaan Oromo and later translated into English during the analysis stage.
Secondary data were collected from books, journals and unpublished sources obtained from regional and district offices such as the agriculture, disaster risk management (Buusaa Gonofaa) and pastoralist and irrigation development offices. Furthermore, climate data (rainfall and temperature) for the period 1991–2022, were obtained from National Meteorological Agency (NMA). However, there is a missing of historical data for monthly rainfall, maximum temperature and minimum temperature at two stations (Dilloo and Dubuluk). To ensure reliability and usefulness of the research findings for policymakers, we used a multi-technique approach. This included using data from nearby stations in the Zone (Meggaa and Yaballo) for estimations (Edwards and McKee, 1997). Additionally, we used a global data set (Link to the cited article.) to fill in the missing values for the stations.
Quantitative data were analysed using Statistical Package for Social Sciences (SPSS) version 22 software. Descriptive statistics such as frequency, percentage and mean were employed to determine and assess respondents’ socioeconomic characteristics and perceived impacts of climate change. Independent sample t-test and chi-square test were also used to test the significant difference between two study districts with respect to perceived level of climate change impacts on livelihoods. The qualitative data that were obtained through KIIs and FGDs were organized, categorized and narrated.
To analyse the seasonal and annual rainfall and temperature trend and magnitude, the nonparametric Mann–Kendall (MK) test and Sen’s slope estimator were used. MK test evaluates the null hypothesis of no trend against the alternative hypothesis that there is either an increasing or decreasing trend (Collins, 2009). The tests do not assume a specific distribution and are robust against outliers in the data (Mann, 1945). The formulae for computing the Mann–Kendall statistics (S) and the standardized test statistics (Z) are presented in equations (2) and (3):
where S is the MK’s test statistics; xi and xj are the sequential data values of the time series in the years i and j (j >i) and N is the length of the time series:
Sign (xj - xi) = 8 + 1, if (xj - xi) > 0 0, if (xj - xi) = 0 −1 if (xj - xi) < 0 >
Where the variance of S, for the situation where there may be ties (that is equal values) in the x values, is given by equation (4):
Here, m represents the number of tied groups within the data set, while ti denotes the number of data points in the ith tied group. When n exceeds 10, ZMK approximates a standard normal distribution (Viste et al., 2012) and is calculated as given in equation (5):
The existence of a statistically significant trend is assessed through the ZMK value. In a two-sided trend test, the null hypothesis (Ho) should be accepted at a specified significance level. The critical value of ZMK, denoted as Z1-α/2, can be found in the standard normal distribution table. For instance, at a 5% significance level, Z1-α/2 is 1.96.
Consequently, Sen’s slope estimator was developed by Sen in 1968 to evaluate the slope or magnitude of trend in a sample of N pairs, as shown in equation (6):
where xj and xk are the data values at times J and k (j > k), correspondingly. If there is only one datum in each period, then N = n(n − 1)/2, where n is the number of times, if there are several observations in one or more periods, the N < n(n − 1)/2 N < (n(n − 1)/2 where N is the total number of observations. The N values of Qi are categorized from minimum to maximum and the median of slope or Sen’s slope estimator is calculated using equation (7):
In this context, Qmed represents the median of the slope, while N denotes the number of calculated slopes. A positive Q value indicates an increasing trend, whereas a negative value signifies a decreasing trend in the time series (Güner, 2017; Bhuyan et al., 2018). To determine if the median slope is statistically different from zero, it is necessary to obtain the confidence interval for Qmed at a specified probability level. The use of odd or even formulas in the Sen slope estimator accounts for the number of study periods. When multiple observations are present, the N values of Q are arranged in ascending order, and the median slope or Sen’s estimator is then calculated. The confidence interval for the time slope can be computed as illustrated in equation (8):
where var (S) is specified in equation (7), and Z1 – α/2Z1 - 2α is derived from the standard normal distribution table. In this research, the confidence interval was calculated at two significance levels (α = 0.01 and α = 0.05). Sen’s slope estimator has been extensively used in hydro-meteorological time series data sets (Gocic et al., 2013).
The Coefficient of Variation (CV) was computed as the ratio of standard deviation to mean [equation (9) and equation (10)], following Hare (1983), to evaluate the temporal variability of rainfall throughout the observation period. CV is used to categorize rainfall variability into three levels: low (CV < 20), moderate (20 < CV < 30) and high variability (CV > 30) (Ayalew et al., 2012; Hadgu et al., 2013; Belay, 2014; Eshetu et al., 2016):
Additionally, the Standardized Precipitation Index (SPI) was used to illustrate the intensity and frequency of drought across different time scales, providing insights into drought characteristics as given equation (11) (Ayalew et al., 2012; Martha and Negeswara, 2016).
The World Metrology Organization (WMO) (2012) noted that the features of SPI have enhanced its popularity for drought monitoring, allowing for the identification of dry and wet years in historical records. The SPI values were classified based on the criteria established by McKee et al. (1993) (Table 1):
In this context, SD refers to the standard deviation, x represents the long-term mean, N denotes the total number of years, Xi indicates the rainfall for each month or season, and the SPI pertains to each year’s data.
3. Results and discussion
Results show that 84% of the household survey respondents were male, while 16% were female; 78% were married. In terms of educational background, approximately 87% were unable to read or write (Table 2). This low level of education among households affects their likelihoods in terms of adopting technologies to cope with climate change. This finding aligns with the studies conducted by Arragaw and Woldeamlak (2017) and Abrham and Mekuyie (2022) in other parts of Ethiopia, which highlighted that lower educational attainment in households affects adoption of strategies for coping with and adapting to climate variability and change.
Among the respondents, 52% engaged in non-farm activities such as small-scale trading, firewood collection, charcoal burning, mining, wage labor (cash-for-work), livestock brokering and transportation services (motor bicycle), while the remaining 48% were pastoralists reliant on livestock production (Table 2). The research carried out in different regions inhabited by pastoralists also verifies that climate change has led to the emergence of alternative livelihoods strategies. These include reducing consumption, migrating to urban areas in search of employment, selling charcoal and firewood, receiving remittances, petty trade and small businesses and selling livestock (Muluken and Desta, 2021; Lelamo et al., 2022; Muse et al., 2023).
The result of independent t-test (t-test; t = 4.7 and p < 0.05) indicates that there was a statistically significant difference in livelihoods between the Dirree (Dubuluk) and Golboo (Dilloo) production systems. The average family size was 5.9 ± 1.9 (Table 3), which exceeds Ethiopia’s national average of 5.1 (Table 3). Additionally, the average age of household members was 44.30 ± 10, suggesting that the respondents were predominantly within the active working age group and possessed considerable experience in pastoralism, enabling them to observe environmental changes effectively (Table 3).
3.1 Climate variability and change
3.1.1 Rainfall variability.
The results for seasonal (ganna and hagayya) and annual rainfall variability for both stations (Dubuluk and Dilloo) are presented in Table 4. Accordingly, the rainfall in the main rainy season (ganna) contributes 96.88% and 95.56% to mean annual rainfall, respectively, whereas rainfall in the short rainy season (hagayya) contributes 81.87% and 92.76% to the stations’ annual rainfall, respectively. This result is consistent with the findings of Eshetu et al. (2016) and Wako (2022), which reported that ganna rainfall contribution was higher than the annual rainfall amount.
The CV results show that the annual rainfall variability at Dubuluk station was 18.5%, while in Dilloo, it was 31.2%. This confirms that the areas have received moderate and high annual rainfall variability, respectively. Besides, the ganna rains varied by 19.7% at Dubuluk station while 15.4% at Dilloo, implying that the rainfall during the main season less varied over the past years (1991–2022) (Table 4). This finding corresponds with the results of the research conducted in the same Borana Zone by other scholars (Berhanu and Beyene, 2014), which showed long-term seasonal variability. The region experienced substantial rainfall decline during the ganna season and an increase in hagayya season, and this contributes to annual rainfall variability.
CV result for hagayya at Dubuluk and Dilloo stations was 34.4% and 44.2%, respectively. Over the course of the study period, rainfall during the short rainy season exhibited high variability at both stations. This aligns with other research findings (e.g., Hadgu et al., 2013; Belay, 2014; Eshetu et al., 2016), which reported that the short rainy season’s rainfall performance showed highest variation in distribution with the highest CV, followed by the main rainy season and annual rainfall. To sum up, the study stations experienced moderate to extremely high inter-annual rainfall variability over the past years.
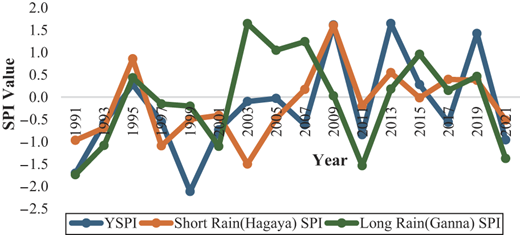
3.1.2 Standard precipitation index (SPI).
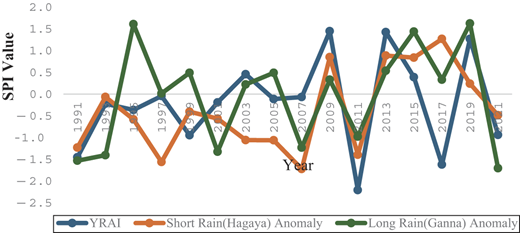
The results from the analysis of SPI for Dilloo and Dubuluk Dilloo stations are presented in Figure 2 and Figure 3, respectively. SPI was used to identify frequency of drought and intensity and inter-annual variation. The negative SPI values at Dubuluk station were 50% during the period of 1991–2022 while in Dilloo, negative SPI values revealed 56.3% over the period of 1991–2022. The inter-stations difference between the frequencies of the dry and wet years range were small. Negative SPI values were observed in 1991–1993, 1997–1999, 2001, 2005, 2007, 2011, 2016–2017 and 2020–2022 in both stations. The rainfall pattern in the stations exhibits certain characteristics that a drought year is followed by another two or three drought years. In agreement with these are the findings from the studies undertaken in Borana by several authors such as Viste et al. (2012); Eshetu et al. (2016); Wako (2022) and Worku (2024). These studies further identified that both in Borana and at the national level, data indicated that droughts periodically affect the lowland regions of the country in a cyclical manner.
The present study found out that three different years (1991, 1999 and 2022), were the years of severe drought occurrences with −1.7, −2.1 and −1.7 respective SPI scores in Dubuluk station, while severe to extreme drought year in Dilloo station was registered in 1991, 2010, 2011, 2017 and 2022. Their SPI values were −1.5, −1.4, −2.2, −1.6 and −1.6, respectively. On the other hand, in Dubuluk station extreme wet (SPI value of more than 2) period occurred only in 2004, with SPI value of 2.2, while in Dilloo station, no extreme wet year was registered. This finding is in line with those results obtained by Eshetu et al. (2016); Wako (2022) and Worku (2024).
The annual rainfall series results indicate irregular trend at both stations, implying periodic incidences of drought. The year 1999 was a very severe drought for Dubuluk as 2011 was for Dilloo relatively. The result for the long rainfall season (ganna) revealed negative rainfall indices or frequent droughts observed in the 1990s and 2000s, 2010s and 2020s in both Dubuluk and Dilloo stations. The main rainfall season trend shows fluctuation in both Dubuluk and Dilloo stations. Rainfall in the short rainy season shows a declining trend, which indicates escalating occurrences of droughts from time to time across the study area. The frequent and 3–5 years period drought was observed in 32 years’ time in both stations. This result is consistent with findings from national and regional level rainfall trend analysis results, which reported both increasing and decreasing trends (Jain et al., 2012; Belay, 2014; Worku, 2024).
3.1.3 Temperature variability.
The seasonal minimum and maximum temperatures showed less variation in both Dirree (Dubuluk) and Golboo (Dilloo) production systems (see Table 5). On an annual basis, temperatures in Dirree exhibited high variability with a CV of 38.78, whereas the Golboo (Dilloo) production system displayed less variability with a CV of 10.62. The annual temperature variability between the two production systems is attributable to the difference in their respective altitudes.
3.1.4 Rainfall trend and magnitude of change.
Rainfall trends and magnitude of change (1991–2022) in the study area have been analysed in the seasonal and annual period by using MK test and Sen’s slope estimator. The MK trend test shows decreasing changes in Dubuluk and Dilloo stations, which implies an increase in the tendency of drought incidences in the main rainy season (Table 6). On the other hand, during the short rainy season, it shows decreasing changes at both stations; similar increasing trend of drought were also observed annually in both stations. The analysis shows t in the short rainy season in Dubuluk station there was a statistical significance (p > 0.05) of any positive or negative trend of drought severity and frequency for both stations.
The trend of rainfall during the main rainy season shows a decline, and the change was statistically significant at both stations (p > 0.05), This season contributes the highest amount of annual rainfall (Table 6). However, the short rains at Dubuluk station revealed an insignificant increase, but it compensates for the average decline that occurred during the main season. This feature aligns with the findings by Berhanu and Beyene (2014), which stated that the average increase in hagayya rainfall has been particularly considerable to compensate for the average declines during the main season at Dubuluk station (also see Eshetu et al., 2016).
Generally, the study reveals rainfall fluctuation both annually and inter-annually. Such an inter-annual variability would negatively affect the ability of the pastoralists to cope with any change and variability (Ayalew et al., 2012). As Eshetu et al. (2016) stated, drought phenomenon would create a more vulnerable environment for the subsistence pastoral sector. For the Borana pastoralists as for other pastoralist communities who practice rain-dependent animal husbandry, livelihoods prospects will likely continue to face more serious decline.
3.1.5 Minimum and maximum temperature trends and the magnitude of change.
The descriptive statistics presented in Table 7 shows that in both districts the ganna season was warmer than the hagayya season. The MK trend test indicates a significant upward trend in minimum temperatures during both seasons, with 0.05°C rate of increase at Dubuluk and 0.06°C at Dilloo stations respectively (Table 6). In Dubuluk, during the ganna two rainy seasons (in ganna and hagayya order), both minimum and maximum temperatures exhibited a notable rising trend, at rates of 0.04°C and 0.03°C per season, respectively.
In Dilloo, maximum temperature during the hagayya season also showed a significant increase by 0.05°C (Table 8). And this rise in temperature poses potential challenges for the community’s livelihoods, especially as the region is susceptible to recurring droughts that can negatively impact pasture and water availability. These findings stand in tandem with the World Bank Group (WBG), 2024 reports from Ethiopia, which noted a nationwide increase in temperatures. Additionally, Hirons et al. (2018) found that the median temperature across Africa has risen between 3°C and 4°C in all seasons, approximately 1.5 times the global average. The escalating temperatures have led to increased evaporation from water bodies and soil moisture, severely affecting the seasonal availability of pasture and water for livestock, thereby compromising the resilience of pastoralists in the Afar Region of Ethiopia for instance (Fenta, 2017).
Furthermore, in terms of annual time steps, in Dubuluk, the average annual minimum and maximum temperatures from 1991 to 2022 were recorded at 14.35°C (±0.37) and 25.8°C (±0.92), respectively, resulting in an overall average of 20.08°C. In contrast, Dilloo experienced mean annual minimum and maximum temperatures of 21.02°C (±1.98) and 32.55°C (±2.35), respectively, during the same period, yielding an average of 26.87°C (Table 10). The results of the MK trend test revealed that Dubuluk did not exhibit a significant upward trend in annual mean, minimum, or maximum temperatures (Table 9).
3.1.6 Climate change impacts on pastoral livelihoods.
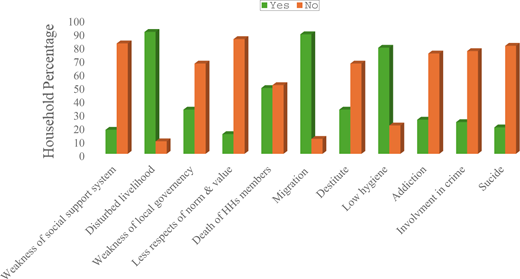
The study dissects the impacts of climate change into three distinct categories, focusing on its effects on various sectors within the community: social (cultural), economic and environmental. This classification aimed to provide a refined understanding of how climate change affects these sectors of the Borana population differently. By analysing study participants’ responses in this manner, the research sought to uncover the specific economic and environmental challenges faced (Figure 4).
Regarding how climate change manifests and affects their livelihoods, the FGDs participants consistently shared their insights. Response highlights a wide array of changes and challenges, including shifts in weather patterns, prolonged dry seasons, a decline in agricultural production and productivity, alterations in the physical landscape of their rangeland, fluctuations in temperature, increased migration, higher incidences of disease, intensified hunger and escalating conflicts over resources. These assessments align with others’ works which concluded that livestock numbers in pastoralist and agro-pastoralist communities of southern Ethiopia (Borana) and Karrayyu were declining dramatically; land degradation worsening; people becoming more vulnerable to drought and famine and resource-based conflicts becoming rampant (Tache, 2008; Eyasu and Feyera, 2010; Daniel et al., 2023). For instance, oolaa bubbee was the name given to the drought of 1997–1998 to remember its severity, during which a unique occurrence of chilly whir wind blowing over the Borana triggered massive loss of the livestock asset. The reach of livestock death was so vast that it affected even the drought resistant species such as camels, equines and goats. In addition, direct human dimension of the impacts were remarkable (Dida, 2020).
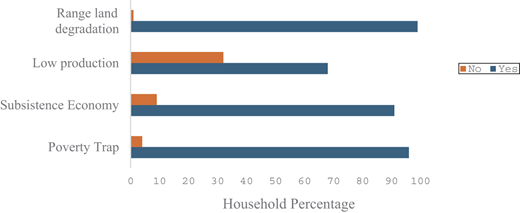
Our findings reveal that climate change has broadly affected the livelihoods of the entire community. 80% of the respondents state poverty rampancy as a significant impact, exacerbated by the adverse effects of climate change on economic stability and resource availability (Figure 5). Additionally, impoverished pastoralists migrated in mass to towns, often leaving behind traditional ways of life (Dida, 2020; Daniel et al., 2022). The impacts of drought are not new phenomena as drought hit the area over different Borana Gadaa chronological times, such as the drought of biirtee, which occurred during Boru Guyo Gadaa period (1984–1992) due to poor performance of three consecutive rainy seasons in 1991–1992. The period was known by Oolaa biirtee because there was an outbreak of livestock and human epidemics (biirtee, i.e bovine babesiosis) that was associated with drought and killed a large number of animals. What is trendy is, however, is a rise drought frequency and resultant herd decline both at an aggregate and per capita levels (Tache, 2008).
The key informant interviews (KIIs) also revealed decline in people’s living standard as another common impact, reflecting an increasing difficulty of maintaining the quality of life in the face of environmental challenges. This deprivation extends to various aspects of daily life, including inadequacy accessing clean water and food, contributing to a cycle of poverty and hardship. Furthermore, the FGD noted a decline in hygiene practices, attributed to water scarcity and disruption of traditional systems of community support and education. Woldeamlak et al. (2015) and Daniel et al (2022), indicate that Borana pastoralists face a critical water shortage due to climate change, and as ponds do not fill to their capacity and dry out fast; streams and rivers disappeared, and boreholes dried out.
The FGD also confirms an emergent breakdown in societal norms and values leading to fragmented social cohesion while focus on survival of individuals is gradually taking shape (Figure 5). This disruption of social fabric is further compounded by an increase in alcoholism and erosion in moral standard, which participants suggested might be a stress coping mechanism. Breakdown of traditional resource management systems, increased deforestation and overgrazing have also been reported as stressors (Reid et al., 2013). Destitute pastoralists resorted selling local beer, water, firewood and twigs for construction of makeshift hamlets in or near towns (Dida, 2020; Matiwos et al., 2022).
3.1.7 Impacts of climate change on livestock productivity.
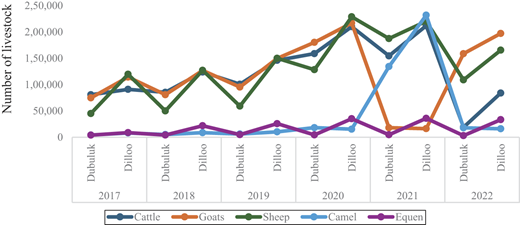
The trend analysis of livestock performance in relation to drought severity from 2017 to 2022 is captured in Figure 6. The data indicate that livestock numbers were greater during favourable rainy seasons as compared to the drought periods. In both production systems, the cattle population in the non-drought years of 2018 and 2019 was recorded at 209,109 and 114,748, respectively. Although rainfall in 2020 was below average, the cattle population increased due to the better rainfall in 2019 and availability of fodder. However, by 2022, drought conditions led to a significant decline in cattle numbers, dropping to 18,872 in the Dirree production system and 8,395 in Golboo. In both, the number of sheep between 2017 and 2021 increased from 164,620 to 357,141. However, during the drought of 2022, it dropped to 274,362 whereas the relative impact on goat and camel populations was less (Table 11), indicating comparative ecological favouritism for browsers over grazers.
Overall, this study demonstrate a detrimental drought impacts primarily on grazers; it strongly correlates with coefficient values of 0.12 and −0.33 respectively (Table 12). Mengistu (2017) also confirms the impact of drought on cattle in terms of size and composition. Various authors report declines in livestock numbers and revenue during drought events, attributable to reduced rangeland productivity, decreased reproductive capacity of livestock and stress due to frequent morbidity among animals (Oba, 2001; Lelamo et al., 2022; Sintayehu et al., 2023; Worku, 2024).
Contrary to grazers, goats and camels showed resilience and their death weakly correlates with drought, with −0.47 and −0.60 coefficient, respectively, while equines were not affected as such (−0.015). These findings concur with Mengistu (2017) who reported post-drought rise in population of goats. However, regarding goats’ population rise, one must consider the post-drought restocking programs implemented by NGOs, which often purchased and transported goats from the neighbouring highlands, besides their relative advantage to survive drought.
4. Conclusion and recommendations
This study has attempted to assess the relationship between climate change and its impact on pastoral livelihoods in Borana. Analyses show that rainfall has been erratic, and declining from time to time, exposing rain-dependent conventional pastoralists to various impacts. These are observed in annual and individual growing seasons (ganna and hagayya) and all of them are statistically significant. The annual SPI shows that the area had experienced eight moderate and five severe droughts of different extent the three decades (1991–2022) under consideration. These changes in climatic variables caused climate-change-induced epidemics, drought, livestock losses and hunger. Therefore, the meteorological impacts could be associated with the increased recurrent droughts, irregular distribution of rainfall within a season and between years and high rainfall variability among seasons and years. The results indicate that the perceived impacts of climate change and variability include reduced livestock assets, water scarcity, food shortage, weakened indigenous social support systems, increased displacement, suicide and loss of household income. Due to the combined impacts of climate change, pastoralists’ resilience has become weaker from time to time.
Climate change being a global phenomenon whose multidimensional impacts are affecting humanity, although the degree of the impact varies depending on technological, economic and policy contexts of countries, production systems that directly depend on rainfall, such as conventional pastoralism in Borana and elsewhere, are severely affected. This is attributable to lack of complementary sources of livelihoods, weak livestock extension services, weak early warning and lack of preparedness at institutional and household levels. This requires a thorough understanding of the climate trend and its ramifications on livelihoods in the lowlands; improving extension services (such as support to promotion of drought and disease resistant species); formulation of a comprehensive pastoral development roadmap and enhancing pastoral communities’ resilience to climate change. These in turn require policy support that takes cognizance of the present needs and prospects of pastoralist communities.