The purpose of the paper is to present a scenario‐based approach to river basin planning, and demonstrate how land‐use planning can be utilised as a strong measure in meeting the climate change challenges with new precipitation patterns during the current century.
The current research takes a scenario‐based approach to river basin planning. A modelling framework is defined to assess the effects of active spatial planning to mitigate the negative consequences of climate change in river basin management. In total, three models are included in the framework: a land‐use model, a runoff model, and a flooding screening model.
The research has demonstrated the advantages of using models and scenarios to assess the effects of climate change in river basin management, and how active spatial planning – in the current example afforestation – can mitigate negative consequences of climate change.
The current research demonstrates how to combine models from different fields into one integrated model for impact assessment.
The developed methodology will assist river basin managers to assess the effects of river basin management plans.
The consequences of climate change are mainstream topics discussed by most citizens and results from the models can facilitate a qualified debate.
The paper analyses the feasibility of using active spatial planning to mitigate the negative consequences of climate change, such as flooding along rivers. This work is original, as no such analysis has been carried out before.
1 Introduction
During the last decennium climate change has received much attention and especially various mitigation and adaptation strategies have gained political awareness. Particularly the water management will be affected by derived consequences like sea level rise, changed precipitation patterns, increasing ground water level, and flooding (Middelkoop et al., 2001). In order to mitigate the most severe consequences for the society it is important that regional planners and water managers address the climate change issue in their planning efforts. Using modelling and simulation, our understanding of the future land‐use system under influence of a changing climate can be increased and accordingly reduce uncertainty concerning decisions.
Since hydrological processes depend directly on climatic conditions, important consequences for regional water resources are expected under a changed climate. Thus, influences of climatic changes on the regional water cycle may result from spatial and temporal precipitation shifts, changes of actual evapotranspiration, and an increase of extreme events like flooding, droughts, and high intensity precipitation. The main climate change consequences related to river basin management are increases in temperature, shifts in patterns of precipitation and snow cover, and increasing frequencies of flooding and droughts (IPCC, 2007).
The European Water Framework Directive is perhaps the most important water directive of recent years. It requires Member States to manage their basins as a whole and reach what is called a good water status for all their waters by 2015. The backbone of the Water Framework Directive is the River Basin Management Plans to be accomplished for each river basin district. Other European legislation like the Floods Directive (European Commission, 2007) and the Climate Change Adaptation White Paper (European Commission, 2009) give support to the climate change dimension of the implementation of the Water Framework Directive. Several studies have analysed the impacts of climate change on runoff – for example the study carried out by Barontini et al. (2009) in the Southern Alps, and much research have been done in the field of assessing the effect of land‐use changes and runoff (Van der Ploeg and Machulla, 2002). However, limited research have been done until yet on how to manage the combined effect of climate change and land‐use change on the runoff in river basin planning. The research carried out by Liu et al. (2000) on using land‐use as a mitigation strategy for water quality impacts of global warming is one example.
The current research is part of the WaterPraxis project (www.waterpraxis.net), which is partly funded by the Baltic Sea Region Programme (http://eu.baltic.net). The objectives of WaterPraxis are to improve the status of the Baltic Sea by assisting the implementation of river basin management plans. The aim of the current research project has been to develop a scenario and model‐based methodology to meet the challenges of reducing flooding along watercourses due to climate change through proactive and targeted river basin management and planning. The paper describes how to combine land‐use simulations with regional climate change scenarios and perform impact assessments of future regional development on the management of water. Furthermore, it is described how the definition of adaptation strategies can facilitate spatial planning measures to counteract the consequences of potential climate changes.
The following paragraphs first give a short description and analysis of climate change challenges in river basin management and the associated EU legislation. Second, the modelling framework – including the land‐use model and the flood risk model is described. Third, the results of the various modelling efforts are presented and followed by a discussion their implication for practical river basin management in a climate change perspective. Finally, the paper ends up with some concluding remarks.
2 The climate change challenge in river basin management
Since year 2000 the European Member States have been busy with implementing the Water Framework Directive (European Commission, 2000), which is the main EU instrument regarding water protection. Climatic variables are the basic parameters that influence water resources, and therefore it is important to consider climate change when aiming to achieve the objectives of the Water Framework Directive. Climate change impacts will affect and interact with the Water Framework Directive implementation activities at different stages in the process. According to the Danish Meteorological Institute (Danish Government, 2008) the precipitation pattern will change dramatically in Denmark towards the end of this century. Particularly the A2 scenario, where the winter precipitation is expected to increase with 43 per cent by the end of this century, and the summer precipitation will decrease with 15 per cent within the same period. Besides the frequency of extreme precipitation events will increase, and accordingly the maximum daily precipitation is expected to grow with 21 per cent. This development will inevitably create significant challenges for river basin managers. The Water Framework Directive mainly focuses on water quality – biologically and chemically, whereas climate change and associated consequences like flooding have received less attention in the directive. Although, climate change impacts may not be noticeable during the first cycles of water management planning, measures and investments may be made that have a long‐term outreach into the future. Therefore, it is important that likely or possible future changes in climate conditions are taken into account when planning and implementing measures today. The European Commission has launched two legal and policy instruments, which can support the inclusion of the climate change dimension in river basin planning.
The Floods Directive (European Commission, 2007) aims at reducing the risks that floods impose on the human society, the environment and the cultural heritage. According to the Floods Directive, which applies to inland waters as well as coastal waters, the Member States are obliged to carry out a preliminary assessment by December 2011 in order to identify river basins and associated coastal areas at risk of flooding. Based on this assessment the next steps are to prepare flood risk maps and finally flood risk management plans by December 2015.
April 2009 the European Commission (2009) launched the White Paper – “Adapting to climate change: towards a European framework for action”. The objective of the EU's Climate Change Adaptation Framework is to improve the EU's resilience to deal with impact of climate change, while respecting the principle of subsidiarity. The adaptation framework is based on a step‐by‐step approach operating with four phases. Phase one focus on building a knowledge base concerning the impact and consequences of climate change. One way of doing this could be to establish a so‐called Clearing House Mechanism as a system and database on climate change impact, vulnerability and best practises on adaptation. Phase two aims at integrating climate change adaptation into EU key policy areas. This part is not easy to implement, but requires solid scientific and economic analysis for each policy area. Phase 3 deals with various approaches in the implementation process – from market based instruments to public‐private partnerships. Phase 4 deals with the external and international dimension of climate change adaptation through international bodies – mainly under the United Nations umbrella.
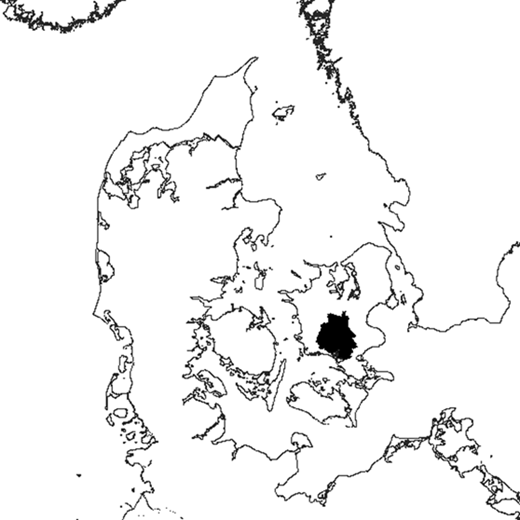
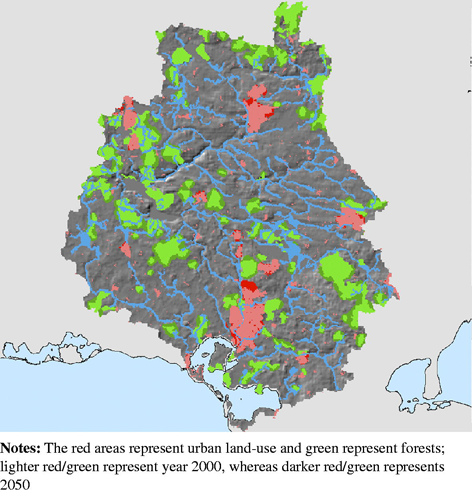
The WaterPraxis project focuses on four pilot areas, from which Susaa has been chosen. Susaa is Denmark's, fifth largest river basin district occupying 815 km2. Figure 1 shows the location of the Susaa catchment. This corresponds to about 12 per cent of the Zealand area. The length of main Susaa is 87 km. Agriculture is the dominating land‐use covering 70 per cent of the catchment area in 2006 according to the CORINE land‐cover data from the European Environment Agency. Forest and urban land‐uses cover 13 and 8 per cent, respectively, of the catchment. The terrain is generally lowland with hilly patches reaching about 100 m above sea level. The geology of the Susaa catchment is dominated by moraine and glaciofluvial deposits, and the soil is dominated by clay (from sandy clay to heavy clay). Sandy soils can be found in the river valleys and in some hilly areas.
3 The modelling framework
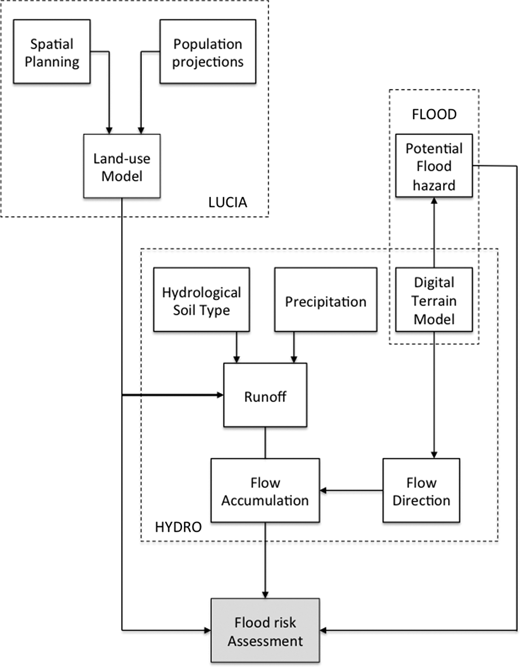
The current research takes outset in a model and scenario‐based approach to river basin planning. The modelling framework used incorporates several models – including a land‐use model, a runoff model, and a screening model for flood hazards along rivers. The drivers for the models are climate change scenarios for the runoff modelling and population projections for the land‐use modelling. The overall structure of the modelling framework is shown on Figure 2, and a deeper description of the individual modelling components follows below.
3.1 Land‐use modelling
Within the current research, the LUCIA land‐use model is used (Hansen, 2007, 2008, 2011). LUCIA is a traditional multi‐criteria evaluation system with factors and constraints, where the spatial dynamics are modelled through constrained cellular automata (CA). CA is an obvious way to take spatial interaction into account and CA based models have been a very popular way of implementing dynamic land‐use models. Basically, CA models determine the number of cells to be changed in the next time step endogenously based on the transition rules defined. However, the pure CA approach is not appropriate for land‐use simulation, and like other recent CA models (Engelen et al., 1995; Barredo et al., 2003) LUCIA is based on constraint CA being driven by external forces. LUCIA has a multi‐level structure, where the upper regional level represents the drivers, whereas the detailed lower level represents the land‐use.
The amount of land is in practice fixed, and accordingly, a competition for land between the different land‐use classes takes place everyday, and land is devoted to the use that generates the highest potential profitability, although this principle is modified by legal constraints like designating protected areas. These principles lead to a land‐use competition hierarchy where protected areas take the primary position, followed by urban land‐use, cropland, grassland, and forest (Rounsevell et al., 2006).
The cells are divided into three main categories: the active land‐use types, which are forced by demands generated externally; the passive land‐use types, which enter into the calculations by being transformed into an active land‐use, and finally the static land‐uses types, which cannot be transformed, but may affect the land‐use simulation by attracting or repelling land‐use transformation in their vicinity. Thus, the cells needed for urban development are first allocated from the passive or the secondary/tertiary active land‐use classes. Next, the secondary active land‐use class takes it share, from the passive or tertiary classes, etc. The passive land‐use classes are mainly represented by different kinds of natural vegetation, but most often crop and grassland serves as a passive class for urban expansion. The static classes remain unchanged during the simulation.
Policy making at national and local level have a strong influence on land‐use – particularly policies that have a spatial manifestation like creation of conservation areas or designation of areas for subsidised development (Verburg et al., 2004). However, more general legislation like the EU Common Agricultural Policy has a strong indirect influence on the spatial development in the rural areas. However, the current version of the model does only involve policies and legislation with an explicit spatial aim under the headline zoning.
The driving forces for the quantity of rural‐urban change are population growth and economic growth. These drivers represent what is called macro‐level drivers, and they are modelled externally to our model in various sector models, and basically define the demand for land from each active land‐use type. Statistics Denmark makes every year national level projections for population, and these national figures are afterwards distributed to the local level (municipalities).
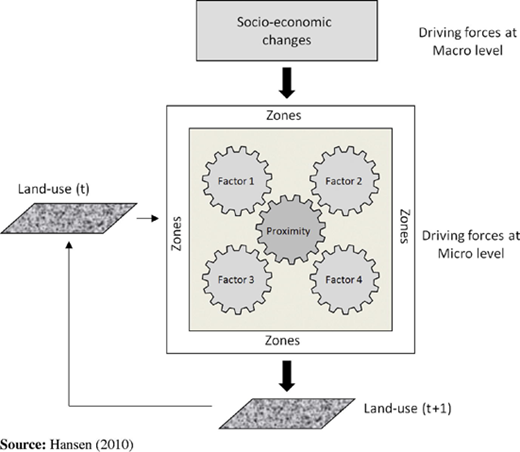
The micro level includes the factors often used in land‐use modelling. The first factor involved in the model is the proximity effect, which represents the attractive or repulsive effects of various land‐uses within the neighbourhood. It is well known that some land‐use types tend to cluster, whereas others tend to repel each other. This is often referred to as the first law of geography (Tobler, 1979). However, cells, which are more remote, will have a smaller effect. The proximity effect has been estimated by analysing the historical urban dynamics during a 15 years period from 1990 to 2005 (Hansen, 2011). Besides proximity, LUCIA can handle up to five additional factors, like suitability –, i.e. how the specific characteristics of each cell can support a given land‐use, and accessibility –, i.e. access to the transportation network. Some activities like shopping require better accessibility than for example recreational activities. These three headline factors – proximity, suitability, and accessibility define the basic preconditions for the cells ability to support a given urban land‐use. Finally, a random raster is added to support spontaneous growth. By combining the factors and constraints for each active land‐use type (L), the transition potential (P) for changing the land‐use from one type to another can be estimated for each cell. The overall modelling concept is shown in Figure 3.
The number of cell values to be changed during the iterations is determined by the external drivers. Once the transition potential has been calculated for all active land‐uses the cell transformation process can start. The cell changes starts with the cell having the highest transition potential and this process proceeds downwards until the predetermined number of cell changes for each active land‐use category has been reached.
Land‐use simulation involves a wide range of data, and providing the data needed as well as the pre‐processing is a rather time consuming effort. The data set used in the current project is land‐use data, soil type data, road network, land values, spatial planning regulations, afforestation subsidy map, population development, and regional economic growth index. The basic source for land‐use information in the model is CORINE land‐cover (www.eea.europa.eu) for the years 1990, 2000, and 2006. Unfortunately, the level of thematic detail in CORINE land‐cover does not satisfy our requirements for the built‐up areas and protected nature. Therefore, the CORINE land‐cover was improved with two auxiliary data sets: the Danish Building and Housing register (Hansen, 2001), and the Danish National database on protected nature. Thus, 16 new land‐use grids for each of the years 1990‐2006 were produced.
3.2 Flood hazard mapping
Flooding due to changed precipitation patterns is one of the major challenges for river basin planners in a climate change perspective. Flood hazard assessment involves two components – topography and water. Due to the regional scope of the current research it was decided to apply rather crude methods with not so demanding data requirements.
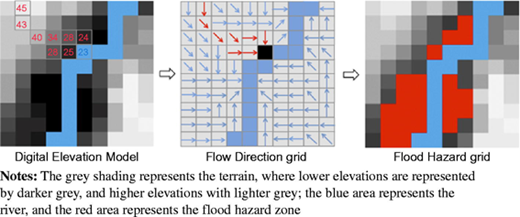
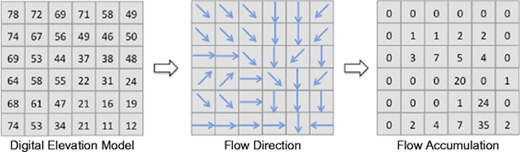
For the topographic component, a rather simple approach originally developed at the EU Joint Research Centre in Ispra was chosen (De Roo et al., 2007). The algorithm is a stepwise procedure (Figure 4):
The first step is to derive the flow direction grid from the digital elevation model. The flow direction is defined as the direction from each cell to its steepest downslope neighbour.
The rivers are represented as raster cells, where each cell is defined as a “pit” serving as outlet of individual small local catchments. The river cell is assigned the elevation from the digital elevation model. For each of those pits, the local catchment draining into this cell is determined. The elevation of the river cell is assigned to this entire sub‐basin – all other cells are assigned a zero elevation.
The difference between the original DEM and the DEM with the local river altitude is calculated for each cell in the mini catchment. If this difference is less than a selected water level, the cells belong to the flood hazard group.
The black cell in the flow direction grid of Figure 4 shows such an individual “pit” outlet, and the red arrows represent its local catchment. The black cell is assigned the value 23 from the digital terrain model. Using a water level of 2 m only two of the cells in the local catchment will be flooded. The described procedure does not consider the important effect of artificial structures like river banks, dikes, and dams, which may have significant effect on the runoff and impact of flooding in a river basin district.
This procedure is repeated for all river cells, and hereby creating a flood hazard map for the selected water level. To obtain a full flood hazard map, the procedure should be carried out for several water levels. The calculations are carried out using the most recent Danish digital elevation model resampled to a raster data set with 10‐m cell size. Five topographic flood hazard maps were produced with 50, 100, 150, 200, and 250 cm water level – corresponding the hazard classes 5, 4, 3, 2, and 1. The corresponding flood risk areas were estimated to be 4,438, 5,607, 7,168, 7,643, and 8,939 hectares, respectively.
3.3 Runoff estimation
Estimating runoff can be a very complicated matter, but in the current research project a rather simple water‐balance model was applied. The runoff calculation utilises the so‐called curve number (CN) method from the US Soil Conservation Service (US Department of Agriculture and Soil Conservation Service, 1986). The CN method is an empirically derived formula aiming at estimating the runoff from a rainfall event, and the approach has been used in may hydrological models like SWAT (Laurent and Ruelland, 2011) and L‐THIA (Bhaduri et al., 2000), and applied successfully in several studies –, e.g. Liu et al. (2000) and Perry and Nawaz (2008). The CN is a function of the hydrological soil group, the land‐use, and the antecedent soil moisture condition, which accounts for the recent rainfall history. The CN operates with four hydrological soil groups (US Department of Agriculture, 2007): group A soils contain more than 90 per cent sand/gravel, and less than 10 per cent clay (low runoff potential); group B soils have 50‐90 per cent sand and 10‐20 per cent clay (moderate runoff potential); group C soils have less than 50 per cent sand and 20‐40 per cent clay (moderately high runoff); group D soils have less that 50 per cent sand and higher than 40 per cent clay (high runoff potential).
According to the CN method the daily runoff Q (mm) can be determined by Q=((P – 0.3S)2)/(P+0.7S), where P is the effective daily precipitation in millimetre, and S is the maximum recharge capacity of watershed after five days antecedent rainfall. S can be estimated by the following empirical formula S=(24,500/CN) – 254. The CN ranges between 0 and 100, where the lower values correspond to forests on group A soils with more than 90 per cent sand and gravel, whereas the higher values correspond to impervious urban areas and due to effective soil sealing mostly independent on the soil type. The CN value is also dependant on the soil moisture condition before a precipitation‐runoff event occurs. The CN method distinguishes between three different so‐called antecedent moisture conditions: AMC‐1, where the soils are dry or nearly dry; AMC‐2, which represent “average” conditions; and AMC‐3, where the soils are saturated or nearly saturated due to antecedent rainfall. The soil moisture conditions within the model are estimated from the accumulated total during a running five days period before the runoff event.
The coefficients of the CN method generally requires to be calibrated to local conditions (Lim et al., 2006), but within the current study it was not required to obtain precise magnitudes of runoff, but rather wants estimate the relative effects on runoff of various land‐use and climate scenarios, and in this respect an exact calibration is of less importance.
While the hydrological soil type is a static factor derived from the geological history, land‐use is strongly affected managed by people and societies. Thus, land‐use becomes a key factor in estimating the runoff response to a rainfall event.
Projections of the future climate is characterised by uncertainties, which is clearly reflected in the output from various climate models (Dessai and Hulme, 2007). The climate data applied in the study is output from the PRUDECE project, which aimed to advance the uncertainty analysis of regional climate change by producing an ensemble of regional climate model simulations for Europe (Räisänen et al., 2004; Christensen and Christensen, 2007). The PRUDECE data are provided through a series of downscaling efforts of global scenarios. The data for the Danish area are produced using the regional HIRHAM climate model (Christensen et al., 1996) with driving global data from HadAM3H general circulation model, which is a high resolution atmosphere‐only GCM derived from the Hadley Centre's state of the art model (Johns et al., 2001). Precipitation data are available at a daily basis for the period 2071‐2100. The PRUDENCE project provides data in various resolutions, but in the current project, it was chosen to use data at the standard resolution – 50 km grid cells. The large cell size implies little variation across the catchment area but an obvious west‐east gradient is visible in the precipitation map. This reflects the overall pattern with a declining precipitation moving from west towards east. The runoff modelling is run on a daily basis for the years 2071 and 2072. The runoff estimated from the maximum five‐day precipitation is used in the flooding calculations. The results of the land‐use scenarios and the climate data are used as input to our runoff model, producing three runoff maps corresponding to the three different land‐use configurations. These runoff data are used as input to the flow accumulation calculations resulting in three flow accumulation maps.
Finally, a so‐called flow accumulation operation was applied. The flow accumulation operation performs a cumulative count of the number of cells that – based on the terrain model – naturally drain into streams and rivers (Burrough and McDonnell, 1998). A flow direction map determining the drainage direction for every cell is needed for the flow accumulation operation (Burrough and McDonnell, 1998). Each cell in the flow accumulation calculation is weighted with the calculated runoff using the method described above. The two steps procedure is shown in Figure 5. ArcGIS Spatial Analyst is used for the flow direction and flow accumulation calculations.
4 Results and discussion
Based on the model complex described above several scenarios for the land‐use development in Susaa river catchment were calculated, and analysed the impact of future climate change on flood risk on the expected future urban land.
4.1 Scenario descriptions
Four land‐use scenarios describing different possible futures for the land‐use pattern in the Susaa river catchment were produced. In all scenarios only the two expanding land‐use classes: urban and forests were considered, and they both have significant influence for the runoff. For the urban development land values and accessibility to motorway junctions were added as optional factors. Accessibility does not enter the projection of the Danish afforestation programme, but the projection of the future forest cover is supported by an afforestation subsidy map.
The urban development is simulated as presumed in story lines A2. Although it is never a trivial task to make detailed projections on future land‐use, at least the future urban development can be simulated by a simple linear projection based on past trends. It is much more complicated to transform the SRES storylines for the future societal development into expectations about future urban development. Solecki and Oliveri (2004) analysed the SRES scenarios to identify “spatial” elements, which can be used in urban land‐use modelling. Regarding scenario A2 they conclude that there will be a growth in per capita land‐use conversion combined with urban development along road corridors and new sub‐urban, peri‐urban employment centres as important drivers. Currently, the Danish Government (2010) has launched a new strategy Green Growth, which tries to combine economic growth and environmental protection. The simulated urban development is considered common for all scenarios, and according to the model the urban area is expected to increase slightly from 6,901 hectares in 2000 to 7,734 hectares in 2050 (Table I).
Currently about 11 per cent of the Danish surface are covered with forest, but since 1989 the official Danish policy has been to double the Danish forest area before the end of the twenty‐first century (Danish Forest and Nature Agency, 2004). While this objective was originally triggered by agricultural over production, the focus is now on nature values and opportunities for outdoor recreation. The experiences have shown that economic incentives are a prerequisite for afforestation on privately owned land. Possible financial sources may include CO2 – sequestration, groundwater protection measures, air quality improvement and achieving recreational values. Therefore, the subsidised afforestation will prioritise size, continuity to existing forests, landscape considerations, drinking water interests, and proximity to urban areas. According to these principles, the Danish area is subdivided into three major groups:
- 1.
positive areas with enhanced subsidies for private afforestation;
- 2.
negative areas where afforestation is prohibited; and
- 3.
other areas where afforestation is allowed but without public subsidies.
The subsidisation is reflected in the model by assigning a factor grid with the value 10 for the positive areas, the value 4 for the areas without subsidisation, and the value 0 for the negative areas.
Currently there are difficulties reaching this ambitious goal. Due to the important effect of afforestation on surface runoff, four alternative scenarios were carried out. One scenario where the afforestation project is dropped (scenario 1), and one where the afforestation ambitions is reduced with 50 per cent (scenario 2), and a scenario, where the afforestation project is implemented according to the original plan (scenario 3). Finally, a scenario 4, where the afforestation is speeded up in order to really obtain the positive effect of extended forest cover was carried out. Thus, scenario 4 represents an afforestation enhanced with 50 per cent compared with the original plan. Table I summarises the forest areas obtained from the four scenarios.
4.2 Impact analysis
The land‐use maps for 2000 and 2050 were overlaid by the five flood hazard zone maps in order to identify the flood risk for urban areas based on the estimated flood hazards. The total urban area for the case area is expected to increase from 6,901 hectares in 2000 to 7,734 hectares in 2050 – corresponding to a 12 per cent expansion during this period. Residential areas grow with 618 hectares, and thus make up three‐fourths of the expected urban development.
Considering the urban development in a climate change perspective, minor parts of the urban areas are located within the flood hazard zones (Figure 6). This applies to as well the urban area of year 2000 as the simulated urban area for year 2050. According to Table II the existing area within the flood hazard zones are limited stretching from 65 hectares for the flood hazard class 5 to 171 hectares for class 1 when considering the baseline year 2000. These figures correspond to just 1 and 2.5 per cent, respectively. Regarding year 2050 the shares of urban areas located within the flood hazard zones are nearly the same. Although these figures are rather small, the number of affected people and the values of the affected properties should not be ignored. Overlying the affected residential cells for year 2000 with the Danish population density map for the same year, 996 people are living within the class 5 flood hazard zone and 2,884 within the class 1 flood hazard zone. Besides several jobs in the industry and service, businesses are threated by being located in the flood hazard zones. Therefore, efforts must be taken by the responsible authorities to reduce the negative consequences.
4.3 Adaptation measures
The adaptation measures can be divided into two groups: one concerning the existing urban areas, and one concerning the future urban development. Regarding the latter, the most obvious solution is to impede further urban development in the flood hazard zone through spatial planning. Protecting existing settlements against flooding is more complicated, and the straightforward – but costly – method is to build dikes along the critical parts of the rivers. Another approach is to use active land‐use planning to manage surface runoff. This approach is applied in the current research. Soil sealing due to the covering of land with houses, shops, industries and roads leads to impermeable surfaces and enhanced runoff. This means that the continuing urban development inevitably leads to enhanced surface runoff. Contrary, other land‐uses like for example forests enhance the infiltration process, and accordingly reduce surface runoff.
The four land‐use scenarios based on various afforestation schemes represent the effect of afforestation on surface runoff. The four flow accumulation maps were overlaid by the five topographic flood hazard maps, thus representing the combined effect of topography, precipitation and land‐use. By setting the flow accumulation for the no afforestation scenario equal to 100, the relative effect of afforestation on runoff can be estimated. The results are shown in Table III. As expected the overall runoff and the flow accumulation decreases with increasing afforestation.
The lowest level of runoff and flow accumulation is obtained through active and dedicated afforestation. About 77 per cent of the new forests in scenario 3 are located on clay soil types, and regarding land‐use conversion all (100 per cent) afforestation takes place in agricultural land. This clearly demonstrates the importance of considering soil type in afforestation planning (Table IV).
The effects of afforestation on the total surface runoff and flow accumulation within the topographic flood risk zones are obvious, although limited, when only considering the difference between the various scenarios for the whole Susaa catchment, where the accumulated flow is only reduced with 6 per cent between scenarios 1 and 4. However, referring to hydrological properties of the various soil groups, it is important that the afforestation takes place on the heavier clay soils in order to reduce the surface runoff. Although the current study has focussed on preventing flooding along streams and rivers through active land‐use planning, the proposed strategy would also mitigate soil erosion, which is another effect of surface runoff. Referring to the expected enhanced frequency of high intensity rainfall events under the global warming, this is an important side effect of the proposed methodology.
5 Conclusions
The dynamic processes on the Earths surface – both man‐made and natural – are interdependent and complex. Furthermore, the uncertainty regarding climate change, its impacts and adaptive processes is so impressive that very little can be said yet with confidence about adaptive capacity and vulnerability to the long‐term climate changes. It is possible, however, to make statements about the expected outcomes with a reasonable level of certainty. Scenario testing can bring the complexity of coastal interactions into focus and provide a better knowledge base for decisions. Scenarios can also help to incorporate a long‐term view and to illustrate and explain issues to stakeholders and the general public during the planning process.
The aim of the current research has been to develop a scenario and model‐based methodology to meet the challenges of reducing flooding along watercourses due to climate change through proactive and targeted river basin management and planning. The paper has described how to combine land‐use simulations with regional climate change scenarios and simple flooding algorithms to perform impact assessments of future regional development on the management of water. Several scenarios for the land‐use development in Susaa river catchment were carried out, and the impact of future climate change derived flood risk on the expected future urban development was analysed.
It was described how the definition of adaptation strategies can facilitate spatial planning measures to counteract the consequences of potential climate changes. Particular focus has been put on the effect of afforestation on reducing surface runoff, and it was demonstrated that the current efforts of doubling the Danish forest area before the end of this century would reduce surface runoff for the whole Susaa catchment, and with more significant reductions in some minor areas along the Susaa River. Currently, the Danish national afforestation programme was used as an example, but the modelling framework can be utilised for analysing the impact of other mitigation measures through land‐use changes. The input requirements to the modelling complex are rather limited, and accordingly the approach can easily be applied in other catchments.
The current work is carried out as a part the WaterPraxis project (www.waterpraxis.net). This project is co‐financed by the Baltic Sea Region Programme under the Regional Development Fund of the European Union.
References
Further Reading
About the author
Henning Sten Hansen is Professor in Geoinformatics at Aalborg University Copenhagen. He has been working within the fields of geoinformatics and environmental geography for more than 20 years. His main research fields are geospatial modelling, land‐use changes, climate change management, and infrastructure for spatial information. He is a member of the Editorial Board of the International Journal of Climate Change Strategies and Management and member of the Executive Board of the European Umbrella Organisation for Geographic Information in Europe (EUROGI). Henning Sten Hansen can be contacted at: hsh@land.aau.dk