Adjusted net savings (ANS) is a pivotal indicator of sustainable development, combining environmental costs, resource depletion and economic performance. While ANS fosters short-term environmental accountability, its focus on immediate economic gains may undermine long-term climate resilience by discouraging investments in clean energy and ecological innovation (ECI). This study aims to investigate the dynamic relationship between ANS, natural resource (NAR) management, clean energy transition (CLT) and ECI in China, providing actionable insights for achieving climate-resilient growth.
Using an innovative wavelet coherence approach, the authors analyse annual data from 1980 to 2020 in China to uncover time–frequency dependencies among key variables.
The authors’ results indicate that NARs drive short-to-medium-term CLTs and positively influence ECI in the medium term. However, the long-term relationship between NAR and ANS is negative, revealing a conflict between economic priorities and sustainable resource management. In addition, while CLT and ECI exhibit a strong short-to-medium-term synergy, this linkage weakens over time due to barriers in scaling green technologies and policy inertia. Notably, CLT negatively correlates with ANS in the medium term, suggesting that China’s resource-intensive growth model and short-term economic incentives may impede its clean energy shift.
This study highlights the urgent need for integrated policies that reconcile economic development with long-term climate resilience. Key recommendations include enhancing green financing mechanisms, incentivizing ECI and realigning ANS metrics with sustainable development goals to accelerate China’s transition towards a low-carbon, resource-efficient future.
1. Introduction
To establish a greener future, a ground-breaking approach that integrates energy transition, economic growth, climate adaptation and sustainable development is required. As the world struggles with escalating climate concerns like rising temperatures, extreme weather and biodiversity loss, there is a greater need than ever for innovative and inclusive solutions that bring sustainable development (Schleussner et al., 2021). Economic development must adopt low-carbon, resource-efficient strategies that prioritise equity and long-term sustainability. The world must concurrently transition from fossil fuels to renewable energy sources like solar, wind and green hydrogen to lower greenhouse gas emissions and preserve energy security. The foundation is sustainable development, which builds resilient communities that can adapt to the consequences of climate change by striking a balance between ecological health, social advancement and economic growth (Guesmi et al., 2024). By aligning these three pillars – climate-resilient economies, clean energy systems and sustainable practices – we can ensure a habitable planet for future generations and build a future where environmental stewardship and prosperity coexist. The United Nations System of Environmental-Economic Accounting (SEEA) plays a pivotal role in structuring and presenting data pertaining to environmental management and its intricate connections with the economy, all underpinned by universally accepted standard definitions and standards. SEEA encompasses a set of approaches to natural capital accounting that originated from the efforts to create “green” accounts and make lives comfortable and sustainable. These efforts date back to the 1970s (McGrath and Hynes, 2020). The core of SEEA’s basic structure is the thorough examination of three essential areas: environmental processes, environmental resource inventories and economic activities that have a major impact on the environment (Managi et al., 2023). All these areas fall under the notion of sustainable development, which represents the synergy between preservation of the environment and prosperity of the economy. However, it has been observed that indicators proposed through the system of national accounting do not suitably express the economic (Stiglitz et al., 2009) and ecological welfare (Ahmad et al., 1989; Dasgupta, 2009). However, the capital and economic basis of sustainable development has emerged due to the constricted relationship between accounting, income, wealth and sustainable development. Under the capital scenario, sustainability is a route or plan for ensuring that a society’s or community’s well-being does not decline over time – and, ideally, keeps improving – is known as sustainable development. The capital concept of sustainability refers to a variety of resources, such as financial, human and natural resources (NARs), all of which are necessary for preserving or improving quality of life (Javed et al., 2024). To provide a consistently good or even superior standard of life for future generations, a sustainable development route is supposed to be created. It underlines the significance of avoiding resource depletion or environmental damage that could jeopardize human well-being (McGrath and Hynes, 2020). In addition, a useful framework for assessing sustainability is the relationship between people’s long-term well-being and the productive capacity of an economy to produce commodities and services. In this vein, the genuine savings concept can be explained in the context of economics and sustainability.
The mechanism of extensive industrialism proliferates economic growth, and in support of these industrial developments, inevitable role played by the energy sector (Sulich and Sołoducho-Pelc, 2022). Generally, due to highly responsive characteristics involved in energy items, every type of business requires different means of energy to raise its productivity, whether it is related to trading, transportation, infrastructure, agriculture, technology-based industries and whatsoever commerce; every single one consumes energy-related sources to flourish its manoeuvres. Meanwhile, the detrimental effects of these energy-based evolutions are uncontrollable, and tons of ecological problems arise that depreciate the aura of a green and sustainable environment (Nefedova et al., 2020). For instance, coal, oil, natural gas, carbon and petroleum waste particles pollute the atmospheric air and haunt marine and forest life. Majid (2020) investigated that extreme and reckless consumption of energy resources signified the main cause of sustainability degradation. According to Polasky et al. (2019), core economic issues destabilizing global sustainability are landfills, deforestation, water exsiccation and dilapidation of NARs. Similarly, uncertain consequences are observed in climatic conditions that call for an instant transition to a sustainable economic system.
The vulnerability of energy markets plays a fundamental role in economic expansions but contaminates the green environment equally (Houssam et al., 2024). A realistic approach to meet the energy demand is transitioning from fossil fuels to renewable energy sources (Østergaard et al., 2020). The renewable energy transition is a viable solution to address the aforementioned economic challenges. As discussed in the study of Kuşkaya et al. (2023), renewable energy is acquired from non-depletable sources; thus, minimal levels of greenhouse gas emissions occur. Recognizing this, emerging nations, especially China, the world’s largest energy consumer, have evolved their strategies and policies towards renewable energy mechanisms to attain a sustainable environment. For instance, China invests 122tn to build a power-producing station with the help of renewable energies (Stern and Xie, 2023). Similarly, nations like Australia, European states and Saudi Arabia financed the bulk of green investments in renewable energy sources such as hydropower plants, ocean, solar, wind, geothermal and bio energies to intensify long-term sustainability (Li et al., 2020). According to IPCC, in 2050, energy acquired from renewable energy sources is approximately 70%–80% only if the successful configuration of renewable energy transitions ensues. But unfortunately, it is observed by Wang et al. (2022) that many renewable energy transitioning projects have been decommissioned in emerging nations due to inconsistent environmental measures and a lack of technical, financial and intellectual clarity regarding sustainable development goals (SDGs).
There are several reasons for selecting China for the case study. China expedited its process of eco-innovations by adopting ESER policies (Yang and Yang, 2015). The advancement and widespread use of innovative energy-saving and environmentally friendly technology played a role during the timeframe. There are now 103 top production units in China contributing to the country’s sustainable development. To reduce pollution and high energy consumption in manufacturing, the Chinese government implemented the “Made in China” policy in 2015. Xu (2022) investigated the impact of this policy on green innovation from 2010 to 2020 and discovered that it boosted green innovation and the upgrading of China’s manufacturing industry. As long as economic sustainability matters, China’s economy is the leading economy that adapts and implements the approaches recommended by the UN at the SDG conference because China releases 27% of annual carbon dioxide and is also the third largest greenhouse gas emitter. Thus, China needs to control its dependency on energy sources and industrialize its market through green growth. For instance, from 2011 to 2019, the overall share of renewable energy consumption in China rose (from 11.34% to 14.45%) (Renewable energy China, 2023). Recent policies published by China’s State Council, such as “certain measures for actively and effectively using foreign investment to promote quality economic development,” have placed a greater emphasis on quality foreign direct investment and have aided development in China’s renewable energy industry (Fan and Hao, 2020). That is why following up on the updated regulations in China’s energy mix consumption is essential to sustain sustainability. Similarly, China’s NARs are projected to be worth roughly $23tn, with coal and rare earth metals accounting for the majority (nearly 90%) (Ranking by Country 2021 Statista, 2022). China’s annual use of NARs is relatively significant compared to other nations. Still, according to the literature, it has remained successful regarding resource efficiency (Cheng et al., 2024). China has boosted its primary energy output to more than 3.7 billion tonnes of coal to maintain growth momentum. China’s natural gas output in 2021 was 207.58 billion cubic metres (Statista, 2023). Thus, measures of adjusted net saving (ANS) in China potentially propagate economic instability.
These proclamations motivate the author to study China’s economy when assimilating the nexus between renewable energy transition, NARs, eco-innovation and natural capital accounting towards sustainable development. However, in previous research, none of the papers indicated the relationship between these variables, especially the indicator of sustainability; that is, ANS as an indicator of natural capital accounting is rarely found in research with similar components of the present study. Thus, current research has the following contributions. Firstly, this study measures how alternative dimensions in the contemporary world contribute to overall growth and development. It makes a unique contribution to existing literature in line with the attainment of sustainable development through green innovations, technological advancement and financial inclusion. The second significant contribution to the present research is the methodological approach; unlike previous studies that used traditional methodologies, this work uses the wavelet coherence technique. Wavelet coherence is a unique way to capture localized, time-varying interdependencies between two non-stationary signals, in contrast to linear Fourier approaches. It distinguishes between actual synchronization and ordinary correlation by revealing transitory phase-locked relationships – where oscillations co-move – across particular time–frequency regions. When evaluating signals with changing dynamics, such as financial markets or physiological cycles, where correlations emerge, grow stronger and fade over time, this joint time–frequency pattern is essential. It is essential for real-world, non-stationary data analysis because of its unique capacity to map the changing coherence structure, which provides a dynamic “coherence map” that static spectrum approaches cannot.
The remaining sections of the present work are designed as follows: Section 2 discusses the literature review related to the studied variables and frameworks. Section 3 deals with data, model and methodological avenues. Section 4 entails estimations, findings and discussions. Lastly, Section 5 concludes the paper and suggests policy implications.
2. Literature review
In this section, the review of existing literature has been presented under the umbrella of the theoretical foundation of the study. All studies are reviewed critically to highlight the potential gaps and justify the objectives of the current study in the literature summary.
2.1 Theoretical underpinning
Since the beginning of industrialism, violating the future generation’s ethical, social and environmental rights has been common. This implies that the process involved in economic growth plunders and exploits the stock of NARs, which later contaminates and dilapidates the sustainable environment for the forthcoming generation (Pardi et al., 2015). However, after extended argumentative debates over this ecological concern, the phenomenon of sustainability emerged. The notion of sustainability was initially highlighted in the report of IUCN in 1980, and later, in 1987, the concrete definition of sustainability or sustainable development was inscribed in the Brundtland report. Basically, the agenda supports the idea of balancing the consumption of natural habitats in present operations of economic developments; that’s how the future world fends off the deficit ratio of ecological footprint and has sufficient resources to avail more civilized opportunities (Vogt and Weber, 2019). Furthermore, sustainability depends on the dynamism of the natural environment; for instance, extensive usage of human and natural capital deteriorates global sustainability by enhancing the consumption of energy mix, increasing imports, inventing the high radiated technologies and many other modes of non-environmental friend practices (Estoque, 2020). Such a situation prevails over the idea of saving the welfare of future generations through sustaining or retaining NARs. Ultimately, the step towards balancing wealth from the present generation to the forthcoming generation develops the theory of green growth via green wealth (Pardi et al., 2015).
Although national accounts indicate the consumption patterns of NARs again, the sustainability criteria are absent. Due to this, Turner and Pearce (1992) recommended adding the factors involved in deteriorating the environment because sustainability remains the question; thus, finally, in 1992, the World Bank introduced the paradigm of ANS and explain for elaborating SEEA. This particular method incorporated elements such as gross national saving, wasted capital, expenditures on education, rents from the depletion of NARs, damages from CO2 emissions and gross national income at market prices. However, the calculation of ANS is recognized as the finest method to measure sustainable development because it covers all aspects of environmental degradation (Larissa et al., 2020). Through ANS, green growth emergence is definite because economies opted for strategies that minimize pollution-intensive actions and transition their operation towards resource and energy efficiency. Therefore, transitioning from traditional to renewable energies is the most efficient sustainable technique. Also, the seventh goal of the SDGs indicates the significance of renewable energy for sustainable development (Güney, 2019).
2.2 Empirical studies
Logically, immoderate reliance on energy sources is one of the core reasons for detrimental ecological instabilities, especially NAR abduction, which occurs when extreme dependence on energy-containing items increases. This situation raises the adversities of non-renewable sources and affects long-term sustainability. Energy-intensive advancements exploit natural habitats and increase the consumption of NARs, ultimately affecting green growth. The same viewpoint was discussed by others, that industrialization through non-renewable sources minimizes the resource-based capital and pollutes the organic environment. Regardless of sustainability issues, nations involved in the extraction of non-renewable energy sources for economic growth; thus, due to these previous studies, they enlighten various techniques to mitigate the harmful consequences of fossil-based energies, like the mechanism of renewable energy transition was found to be the direct factor that leads to a sustainable environment.
For instance, aims to investigate the impact of energy transitions, energy consumption and NARs on the economic sustainability of the selected OECD countries from 1990 to 2015. The study uses a comprehensive empirical analysis and applies advanced econometric methodologies. Their long-run results indicate that energy transitions towards renewable energies and NARs are negatively associated with ecological distress and positively associated with economic sustainability. Similarly, according to BRICS countries have experienced rapid economic growth in recent years, resulting in the depletion of NARs and a non-green environment. Thus, he applied the method of moments quantile regression (MMQR) to examine the asymmetric association between the variables from 1990 to 2019. The outcome of MMQR illustrates the negative and significant coefficients of the renewable energy transition with NARs, while human capital and renewable energy resources support sustainable resource management to foster a greener environment.
On the other hand, it is revealed that rent on NARs and renewable energy decreases environmental externalities, implying that they positively contribute to green growth. These results support the notion that economic growth and environmental quality can be reconciled by adopting sustainable green policies. The findings also confirm the existence of the environmental Kuznets curve for BRICS countries when the ecological footprint is used as an indicator of environmental degradation. In addition, examines the impact of NARs and renewable energy transition on environmental sustainability in the context of the pollution haven hypothesis. The findings suggest that NAR rents correlate negatively and positively with environmental pollution and renewable energy transition.
Moreover, renewable energy transitions are considered viable alternatives under the SDG; hence, they have gained widespread acceptance. Furthermore, consumer acceptance is the critical feature that can make it possible to achieve rapid production. The study is founded on the idea that eco-innovation and renewable energy sources may work together to promote sustainability in India. It was noted in the study that all the significant resources of renewable energy (solar, hydro, geothermal, wind and biomass) gained acceptance for use in production. According to a recent study, eco-innovation is a technique that may be used in conjunction with producing renewable energy transitions to provide a synergistic advantage and promote green growth. Furthermore, used a second-generation panel estimate approach to analyse the link between eco-innovations and green growth in the world’s seven major industrialized countries, that is, G-7 nations, from 1995 to 2018. According to the study’s findings, using eco-innovations has a detrimental long-term impact on carbon dioxide emissions, heightening green organizational operations in each sector of G7 states. So, in the investigation, carbon emissions render environmental sustainability the most prominent obstacle to green growth. He analysed this scenario after scrutinizing the E7 countries that are experiencing severe challenges due to global warming. Their study focused on the critical role of the transition towards renewable energy and eco-innovation in seven emerging countries from 1995 to 2018. The paper uses three alternative root tests for analysis: CIPS and CADF and cross-sectional dependence tests. According to the outcomes, the renewable energy transition can overcome excessive non-renewable energy usage when eco-innovative ideas operate.
Similarly, the impact of eco-innovation and NAR exploitation on renewable energy transition in OECD nations from 2004 to 2020. Pearson CD, likelihood ratio test and MMQR were used to analyse the obtained data. As per the estimations, NAR exploitation has a strong favourable influence on renewable energy usage. The influence pattern of eco-innovation was also discovered to be the same; thus, the mechanism of renewable energy transitions is promoted.
2.3 Research gaps
The discussed literature review indicates several shortcomings that will be addressed in the existing body of knowledge through the present study. Firstly, the studies generally focus on NARs in the context of only environmental sustainability; however, the current study will consider the SEEA indicator augmented with other determinants. Secondly, the present study will contribute by presenting the outcomes of the variables with a novel technique of wavelet analysis. Finally, authors of existing studies shed little attention to the clean energy transition (CLT) for China; thus, our study will evaluate the association of natural capital account, NARs, CLT, and ECI for China, ultimately beneficial for policy and decision-making of the emerging country.
3. Data and methodology
The yearly (secondary) data of natural capital accounting, NARs, CLT, and ECI of China has been collected ranging from 1980 to 2020 from various Web sources. This period captures China’s entire transition from industrialization to green policy. The detailed description of the data is depicted in Table 1.
3.1 Wavelet transformation
The wavelet transform technique was developed to extend the capabilities of the Fourier transform. According to Adebayo et al. (2022), the Fourier transform is subject to certain constraints, including the requirement that the time series being analysed must be cyclic and that events must not occur across separate time intervals.
3.2 Continuous wavelet transforms
This study used continuous wavelet transform (CWT) to determine the lead-lag connection among NARs, CLT, ECI and green growth because of its ability to divide the data set into multiple time periods and reveal the real dynamics and co-movements of the relevant variables. One of the primary benefits of CWT is its ability to account for heterogeneity by considering both the time and frequency domain characteristics of the data.
A mother wavelet Ψ is projected onto the investigated time series , yielding the continuous wavelet transform :
In this notation, represents the time domain and the frequency domain.
3.3 Wavelet coherence
Wavelet coherence (WTC) is a statistical model used to examine the connection between two variables. To present a complete picture of the WTC, the time and frequency gap where the examined time frame reveals brief variations but lacks considerable common control must be identified. The wavelet coherence of two time series, and , can be defined in the same way as in:
The operator denoted by S is a smoothing function, whereas the variable s represents a wavelet scale. The refers to the continuous transformation of the time series X, indicates the CWT of the time series Y, is a cross wavelet transform of the two time series X and Y (Chowdhury et al., 2021).
3.4 Partial wavelet coherence
A novel method called PWC is used in a simple framework of correlation. With the use of PWC, this is achievable while using the wavelet technique. After limiting the impact of a third data set, , the approach enables the detection of wavelets coherence for two data sets, and . As a result, the transcription of the coherence between and , and and and is:
Based on the idea of linear associations, suggested that the PWC may be expressed as follows once the effect of x3 has been removed:
The coherency of numerous variables with other control variables may be assessed using the multiple wavelet coherence (MWC) technique. The following equation displays the MWC:
4. Data estimations
This section focusses on the analysis of dynamic relationship between NARs, CLT, ECI and green growth. The dynamic relationship between the proposed variables is checked using various wavelet techniques such as continuous wavelet transforms, Wavelet coherence, PWC and MWC. Before the analysis of time–frequency causality between NARs, CLT, ECI and green growth, we analysed individual series using descriptive statistics. For the data estimations, R-studio, Python and MATLAB were used.
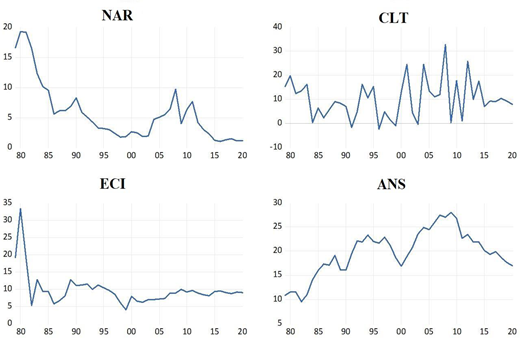
Table 2 shows that ANS has the highest mean value followed by CLT, ECI and NAR. The standard deviation describes how values of a series move around mean; the smallest standard deviation shows more concentrated data. To know the distribution of the data, we applied Jarque–Bera test, which confirms that all the variables NAR, CLT, ECI and ANS are non-normally distributed. The series are not normally distributed, which suggests the application of non-parametric approaches such as wavelet analysis. Figure 1 plots actual series and it can be seen that all the series are non-stationary at level.
4.1 Continuous wavelet transform
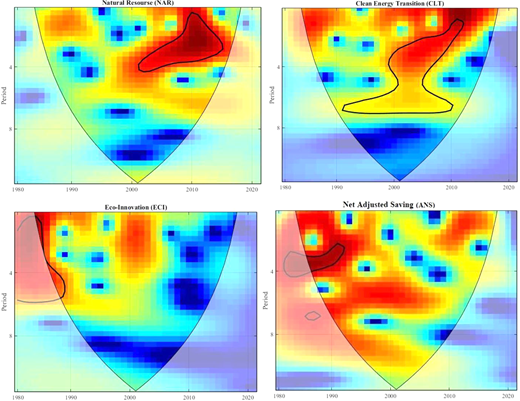
We first applied continuous wavelet transform to capture volatility in NARs, CLT, ECI and green growth. The black ringed area refers to the 5% level of significance. Outside of the black contour, the region surrounded by the cone splits is weakened by edge effects. While red colour denotes the great power and blue denotes the low power. While y-axis having frequency (e.g. 0–4 and 4–8) and x-axis having time scale from 1980 to 2020. The diagram depicts the edge effect as a lighter shade. The CWT outcomes for the above-mentioned variables are presented in Figure 2. The wavelet power spectrum (WPS) of NAR confirms volatility in the period of 2000–2012 at scales of 2–4 yearly. We further found volatility in CLT during 1990–2010 in periods of scales of 2–8 yearly. We found evidence of volatility in ECI in the periods of scales of 2–8 before 1990 only and that for the rest of the sample period ECI has no volatility. Finally, we found that ANS has volatility in the period of short scales 2–4 before 1990 only and after this period the series is stable. The findings confirm that CLT is most volatile among the proposed variables.
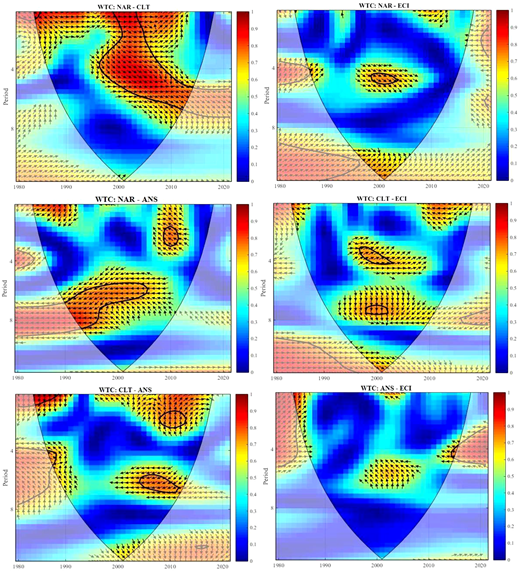
Based on the CWT analysis, we have successfully identified the volatility patterns of the proposed variables. However, we encountered a challenge when attempting to establish the correlation between pairs of these variables using the CWT analysis alone. The results of this enhanced wavelet analysis, specifically the findings pertaining to the correlation between the pair of variables, are presented in Figure 3.
4.2 Wavelet coherence analysis
Figure 3 unveiled wavelet coherence between NARs, CLT, ECI and net adjusted saving. The right-side coloured bar shows the strength of correlation, while the directions of the arrows show in-phase and out-phase relationships of X–Y variables. The right-side-up arrows describe that variables are in phase, it means that the Y variable leads the X variable. While a left-side-up arrow shows out phase, it means that the X variable leads the Y variable. The findings of wavelet coherence between NAR and CLT show that in the period of 0–7 scales, NAR led CLT from 1996 to 2014. This implies that in the short and medium run period, NARs have predictive power over CLT. More precisely, NARs have positive co-movement with CLTs
Similarly, the wavelet coherence for NAR–ECI also shows that in the medium run period, during 1998–2002, NAR leads ECI, which shows that NAR has positive predictive power to ECI; however, in the long run there is no co-movement between NAR and ECI. This implies that the income from NAR and advances in ECI are positively associated in the medium run. Nevertheless, over an extended period, there appears to be no noteworthy mutual interaction between NAR and ECI, suggesting that the impact of NAR rents on ECIs may eventually decline or be impacted by alternative variables. This suggests that long-term ECI may not be sufficiently driven by a reliance on NAR income, which could have ramifications for China’s sustainable development goals.
Furthermore, the findings for NAR–ANS show that in the medium-to-long-run time period, ANSs lead to NAR rents, especially from 1990 to 2005. However, later during 2008–2012, in the short-run era of 1–3 periods, NAR leads to ANS. This implies that both NAR rents and ANS contain predictive power; however, the association between them is evidently negative. This negative correlation between NAR and ANS indicates that there might be a trade-off between short-term NAR extraction and long-term environmental and resource sustainability, highlighting the need for balancing economic gains from NARs with sustainable practices. Furthermore, wavelet coherence between CLT–ECI shows that in the short-to-medium run period, during 1995–2004, ECI leads to CLT positively. However, in the medium-to-long run, a significant correlation exists, but the direction of the lead-lag relationship is inconclusive. More broadly, the findings imply that the move towards greener and more sustainable energy sources is being facilitated by investments in and improvements over eco-friendly practices and technologies, which could result in reduced environmental degradation, increased energy efficiency and an environmentally friendly future for China.
Moreover, the wavelet coherence between CLT–ANS shows that in the short-run scale of 0–4 cycle years, there exists a significant correlation between the variables from 2005 to 2012 with an inconclusive lead-lag association. However, in the medium time scale of four to eight years cycles, the findings of WTC identify the negative co-movement between CLT and ANS during 2002–2012 with net adjusted savings leading the CLT in China.
4.3 Partial wavelet coherence and multiple wavelet coherence
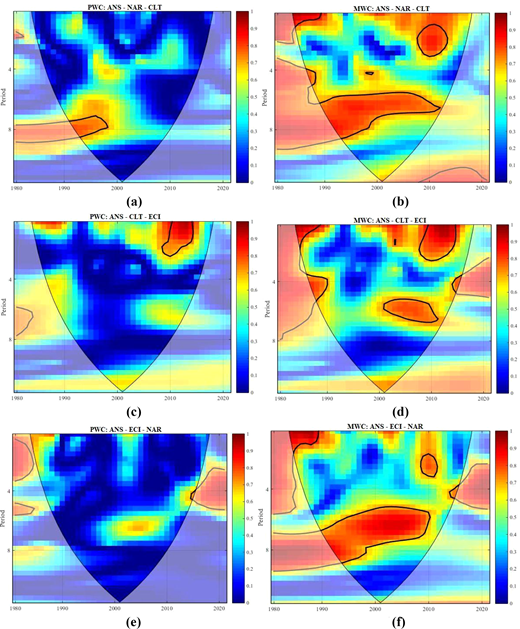
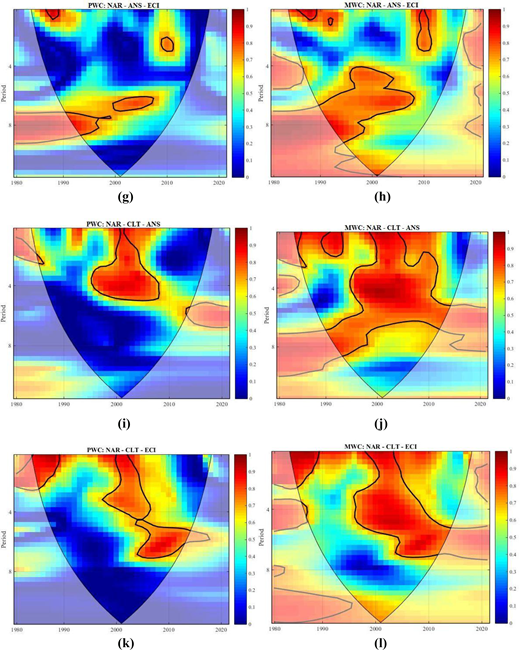
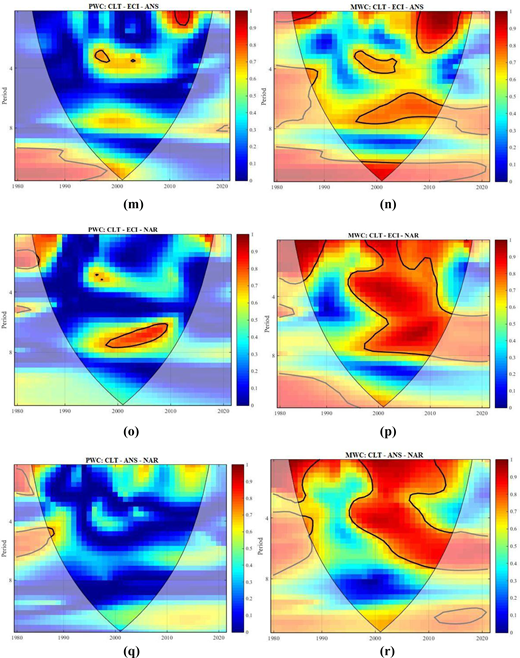
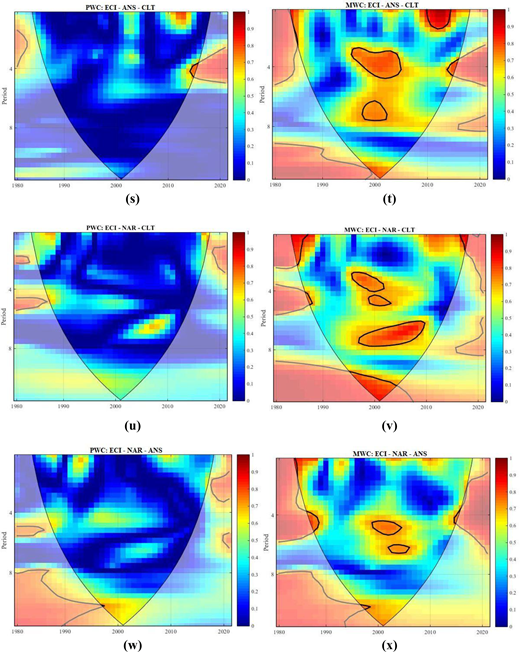
We further enriched our wavelet analysis by using PWC (left panel of Figure 4) and MWC (right panel of Figure 4) between NARs, CLT, ECI and ANS as further exploration into the association among the studied variables. Figure 4(a) shows the result of PWC between ANS and NAR after excluding the CLT effect. The findings indicated that there exists an overall weak correlation between ANS and NAR except the era of 4–8 cycle years during 1991–1998. However, after PWC analysis, when we enriched wavelet estimation by incorporating MWC analysis, to know the impact of on by considering the influence of , the findings exhibited an interesting pattern. More precisely, Figure 4(b) reports MWC between ANS and NAR by including the effect of CLT. Remarkably, we find that the strong correlation between ANS and NAR after the inclusion CLT into the ANS–NAR relationship 2008–2014 in the short run and 1990–2010 in the medium and long run. In simple words, it is observed that the association between ANS and NAR rents is intensified by the consideration of renewable energy transition throughout the sample period. Furthermore, Figure 4(c) reports PWC between ANS–CLT after excluding the influence of ECI. The findings of PWC unveiled that there is a weak correlation between ANS–CLT except in short run at the period scales of 2–4 during 2008–2012 where a brief strong correlation exists. Similar to the previous outcomes, the results of MWC found that the association between ANSs and CLT strengthened after the influence of ECIs on the ANS–CLT relationship. Specifically, Figure 4(d) shows that there is a strong correlation between ANS and CLT at the period of scales 0–2 yearly, during 2010 with the inclusion of ECI effect.
Figure 4(g) shows the outcomes of PWC between NAR–ANS after eliminating ECI effect. The findings find the strong correlation in very small horizon in the scales of 0–4 period during 1990 and in the scales of 7–10 from 1990 to 2009. On the other hand, Figure 4(h) shows the relationship between NAR and ANS after considering the influence of ECI on the association. Interestingly, the outcomes of MWC found the extended association between NAR and ECI at the short-run scales of 0–4 period during 2010, in the medium run from 1990 to 2009 and also in the long run until 1998 after considering the impact of ECI. Similarly, Figure 4(i) reports PWC between NAR–CLT after eliminating the effect of ANS. The outcome of PWC found a strong correlation between the proposed variables at the scales 0–5 period, during 1995–2007. However, after considering the influence of ANSs, the findings of MWC reported the strong NAR–CLT association in the short, medium and long run, throughout the sample period. Similarly, Figure 4(k) shows PWC between NAR–CLT while ignoring the impact of ECI. The results observe the significant connection at scales 0–4 and also from four to eight years during 1980–2010. Furthermore, the results of MWC, after considering the impact of ECIs in the relationship between NARs and renewable energy transitions, exhibited stronger correlation demonstrating intensified association among the variables.
Finally, Figure 4(e) reports PWC between ANS-ECI after cancelling the effect of NAR. The outcomes of PWC found no correlation among the variables. While Figure 4(f) describes the correlation between ANS and ECI by considering the impact of NAR. The outcomes of this MWC showed that the impact of ECI on ANS is formed by the inclusion of NARs in the short run during 1985–1991 and 2009–2011, while also in the medium to long run from 1990 to 2009. These findings suggest that the relationship between ANSs and ECIs is strongly influenced by the changes in NAR rents. In this regard, increased FDI in eco-innovations and sustainable economic growth promote the ANSs.
The results of PWC for the CLT–ECI association are displayed in Figure 4(m). The findings after removing the influence of ANS exhibited almost no association among the variables. However, Figure 4(n) reports the correlation between CLT–ECI by including the impact of ANS. Fascinatingly, the outcomes find a strong association among the variables at the short-run scales of 0–4 period, during 2008–2015 and in the medium-run scales of 6–8 during 1998–2012. Similarly, Figure 4(o) shows the PWC between CLT–ECI after cancelling the effect of NAR, and also found an overall weak correlation between the scales over four to eight years, during 1999–2010. On the other hand, Figure 4(j) reports the impact of NAR on CLT–ECI relationship. The findings show a strong impact of eco-innovation on renewable energy transition after considering the effect of NAR rents, in the short-, medium- and long-time scales, during 1995–2015. Furthermore, Figure 4(q) displays the outcome of PWC for the CLT–ANS relationship without considering the effect of NARs in the association. The findings reported no significant correlation between the two variables. Interestingly, when the influence of NARs are included in the CLT–ANS link, the result of MWC from Figure 4(r) portrayed the high correlation among the variables in the short and medium time scales, during the 1996–2014.
The results of PWC for the ECI–ANS association are displayed in Figure 4(s). The findings after removing the influence of CLT exhibited no relationship among the variables. However, Figure 4(t) reports the correlation between ECI–ANS by including the impact of CLT. Interestingly, the outcomes find the three islands exhibiting the impact of ANSs on ECI, in the short run during 2010–2012, in the short-to-medium run during 1995–2004 and briefly in the medium run during 1999–2001. Likewise, Figure 4(u) reported the results of PWC for the ECI–NAR link without including the impact of CLT in the relationship and found no relationship between ECI and NAR. Nevertheless, Figure 4(v) showed the correlation between ECI–NAR by including the impact of CLT. Similar to previous MWC outcomes, the result found multiple islands in the short run during 1985–1990, in short-to-medium run during 1995–2002, in medium scales during 2000–2002 and 1996–2020 and also in the long run from 1995 to 2004. Finally, the PWC outcomes of the ECI–NAR association without ANS impact also reported no significant relationship among the variables. However, by the inclusion of ANS influence, the result of MWC in Figure 4(x) displayed the significant impact of NAR rents on the ECIs in the medium run during 1999–2006.
5. Conclusion and policy implications
In the face of pressing global challenges like climate change, resource depletion and environmental degradation, the interplay between net adjusted savings, ECI, NAR rents and CLT becomes increasingly vital. Gaining an understanding of these dynamics is essential to controlling NAR rents for both environmental sustainability and economic growth, while also promoting ECI to solve environmental challenges. The necessity of switching to greener energy sources to tackle climate change further emphasizes how important this study is. The process of measuring the environmental impact of economic activities – particularly through net adjusted savings provides us with a useful foundation for making well-informed decisions that aim to balance environmental preservation and economic growth. Essentially, the results of this study will be crucial in developing policies that successfully negotiate the complex terrain of economic advancement, innovation and sustainable development – thus guiding us towards a future that is both robust and sustainable.
In light of the above objectives, a number of significant discoveries can be derived from the current study. The outcomes find that NARs show predictive potential in the short and medium term with respect to CLTs, suggesting a positive co-movement between the two variables. In addition, while a long-term correlation is not obvious, NAR shows positive predictive value for ECI in the medium run. On the other hand, our research reveals a complex link between NAR rents and ANS throughout various time periods. Even while ANS leads NAR over the medium to long term, their association appears to be negative, raising the possibility of conflicts between resource management that is sustainable and economic interests. In the short-to-medium term, there is a positive lead-lag relationship between CLT and ECI, which we also discover to be dynamic. However, over the medium to long term, the relationship’s direction becomes ambiguous due to the difficulties involved in the switch to cleaner energy sources and ECI. In the medium time scale, a noteworthy negative co-movement between CLT and ANS is observed, with net adjusted savings driving the CLT. This emphasizes the possibility that China’s transition to greener energy alternatives will be hampered by short-term economic priorities, economic reliance on resource extraction and political interests supporting conventional energy sources. In addition, there are two other time periods in which an out-of-phase link between ANS and ECI is seen, although these associations are not statistically significant. Nevertheless, they serve as a cautious signal to the Chinese government about the possible adverse effects of net adjusted savings on ECIs. Considering policy implications, balancing ecological sustainability and economic growth is essential for a more sustainable and equitable future in light of these findings.
Technology can be used to improve the efficiency of existing natural capital accounting systems in the economy. For instance, the Chinese government can actively take part in promoting and investing in the implementation of dynamic software capable of estimating natural capital accounting for both commercial and domestic sectors. This initiative will help identify and address the overconsumption of NARs, ultimately mitigating the emergence of an eco-deficit economy. By monetarizing and incentivizing the installation of such software, the government can encourage more sustainable resource management practices across various sectors. Furthermore, to promote CLT, China can explore and implement renewable energy integration methods, such as creating a digital platform for renewable energy trading similar to Australia’s National Electricity Market. This platform can significantly contribute to improving energy efficiency and reducing greenhouse gas emissions. By developing such a system that effectively caters to a large portion of the population’s energy needs, China can incentivize the adoption and deployment of renewable energy sources more effectively. Moreover, prioritizing the electrification of transport as a fundamental component of its sustainable energy transition strategy should also be promoted. This approach will contribute to a significant reduction in air pollution, greenhouse gas emissions and reliance on fossil fuels. In addition, the adoption and integration of smart grid technology, including innovative systems like continuously variable transmission, should also be actively promoted. These technologies can enhance the efficiency of renewable energy generation and distribution, thereby supporting green growth and bolstering the overall environmental sustainability and economic progress in China. NAS are also known as genuine savings and the key indicator for measuring and facilitating sustainable development. NAS incorporate human capital, NARs and ecological well-being. Hence, it is recommended that all economies plan and streamline the NAS effectively and future driven. As suggested by the findings, NAS has a strong positive association with economic and ecological development. In this regard, NAS play the key role in the attainment of SDG-13 (Climate Action), SDG-12 (Responsible Consumption and Production) and SDG-8 (Economic Growth). In addition, economists and environmentalists need to focus more on different aspects of NAS while planning and addressing the highlighted SDGs. Doing so, NAS can be established as a critical component to address economic and environmental issues such as carbon emissions and climate change.
Also, the policies can be directed towards actively endorsing and supporting eco-innovation, which emphasizes responsible and sustainable technological advancements. This includes promoting the development of eco-friendly technologies like smog-free towers and responsibly sourced smartphones, while encouraging the implementation of life cycle assessment methods. The method is a valuable tool for identifying environmental hotspots and guiding eco-innovation initiatives to minimize their impact throughout the life cycle of products and services. In addition, policies should be crafted to encourage the use of eco-labels and eco-design practices, which can stimulate green growth by promoting resource efficiency, waste reduction and enhancing the environmental and social performance of goods and services. These measures should be a focal point for achieving sustainability and advancing towards a circular economy in the country. Policy initiatives should prioritize the adoption of such technologies, which not only mitigate air pollution but also reduce the environmental impact of resource consumption.
In a nutshell, collectively adopting strategic approaches to intensify the process of the renewable energy transition, eco-innovation and advanced technologies with in natural capital accounting systems can improve the efficiency of this process. Also, these implications transit the traditional mechanisms into green growth mechanisms; thus, long-term sustainability in China is patent. Although, the present study covers various aspects of natural capital accounting, NARs, CLT, ECI for China yet, few limitations remain exist and provide future venues. For instance, more emerging nations can also be considered for the identification of dynamic association of natural capital account, NARs, CLT and ECI. Alternate economic theories can also be validated by using up to date data sets. Finally, other economic and financial variables can also be considered in the future.