

This paper aims to retrospectively quantify the contribution of renewable energy consumption (REC) to mitigate the carbon dioxide (CO2) emissions for the belt and road initiative (BRI) region. The reason is that, so far, still few scientists have deeply analyzed this underlying impact, especially from the income levels’ perspective.
The study divides the BRI region into four groups by the income levels (high, HI; upper middle, UM; lower middle, LM; lower, LO) during 1992–2014 and uses the logarithmic mean Divisia index.
The results show the REC of the BRI has an overall decreasing trend but the driving contribution to the CO2 growth except that the HI group’s REC has an obviously mitigating contribution of −2.09%. The number indicates that it is necessary and urgent to exploit and use renewable energy, especially in mid- and low-income countries due to the large potential of carbon mitigation. Besides, during 2010–2014, the energy intensity effects of different groups were negative except for the low income group (positive, 5.47 million tonnes), which showed that some poor countries recently reduced CO2 emissions only by extensively using renewable energy but not enhancing the corresponding efficiency. Conversely, in other rich countries, people paid more attention to improve the energy-use efficiency to lower energy intensity.
This study creatively analyzes this underlying impact of the REC to mitigate the CO2 emissions from the income levels’ perspective and proposes some reasonable countermeasures of reducing CO2 for the BRI region.
1. Introduction
With the population growth and economic development, global energy consumption and related carbon dioxide (CO2) have sharply increased, as the industrial revolution (Armstrong et al., 2016; Barack, 2017). This fact might cause some extreme environmental problems such as climate warming and attracted more and more attention (Martinez-Zarzoso and Maruotti, 2011; Tian et al., 2018; Bilan et al., 2019). Thus, it is important and urgent to study the mechanism of CO2 mitigation and the transition of energy consumption (Menyah and Wolde-Rufael, 2010; Teixido et al., 2019; Aydogan and Vardar, 2019). For example, some scientists noticed that the growth of renewable energy consumption (REC) could, to some extent, achieve the goal of reducing carbon emissions (Timilsina et al., 2011; Bhattacharya et al., 2017; Yao et al., 2019). More representatively-related achievements were listed inTable 1.
Representative articles related to the nexus between the REC and CO2 emission
| Author and year | Region and period | Method | Major findings |
|---|---|---|---|
| Apergis et al. (2015) | 11 South American countries 1980–2010 | PCM | REC CO2 decrease |
| Attiaoui et al. (2017) | 22 African countries 1990–2011 | ARDL | REC CO2 decrease |
| Ben Jebli (2019) | 22 Central and South American countries 1995–2010 | PCM | REC CO2 growth |
| Bhat (2018) | Brazil, Russia, China, India and South Africa 1992–2016 | STIRPAT | REC CO2 decrease |
| Charfeddine and Kahia (2019) | MENA 1980–2015 | PVAR | REC CO2 growth, but weak |
| Chen et al. (2019) | China 1980–2014 | ARDL | REC CO2 decrease |
| Chen et al. (2019) | China 1995–2012 | FMOLS | REC CO2 decrease, only in the eastern and western regions |
| Cherni et al. (2017) | Tunisia 1990–2015 | ARDL | No granger causality |
| de Souza (2018) | Argentina, Brazil, Paraguay, Uruguay and Venezuela 1990–2014 | ARDL | REC CO2 decrease |
| Dogan and Ozturk (2017) | USA 1980–2014 | ARDL, EKC | REC CO2 decrease |
| Dogan et al. (2016a, 2016b) | Top 10 REC countries 1985–2011 | FMOLS | REC CO2 decrease |
| Dong et al. (2020) | 120 countries 1995–2015 | PCM | REC CO2 decrease |
| Dong et al. (2018) | 128 countries 1990–2014 | STIRPAT | REC CO2 decrease |
| Dong et al. (2018) | China 1993–2016 | ARDL | REC CO2 decrease |
| Emir et al. (2019) | Romania 1990–2014 | ARDL | No granger causality |
| Hanif (2018) | 34 emerging countries 1995–2015 | GMM | REC improves air quality by controlling carbon emissions |
| Ito (2016) | 31 developed countries 1996–2011 | PCM | REC CO2 decrease |
| Kahia et al. (2019) | MENA 1980–2012 | PVAR | REC CO2 decrease |
| Leal et al. (2018) | Australia 1965–2015 | ARDL | No granger causality |
| Lee (2019) | European Union 1961–2012 | PCM | REC CO2 decrease |
| Long et al. (2015) | China 1952–2012 | ARDL | No granger causality, but think that REC can decrease CO2 emissions |
| Lu (2017) | Asian 1990–2012 | PCM | REC CO2 growth |
| Mahmood et al. (2019) | Pakistani 1980–2014 | 3SLS, EKC | REC CO2 growth |
| Moutinho and Robaina (2016) | 20 European countries 1991–2010 | PVECM | REC CO2 decrease |
| Naz et al. (2019) | Pakistan 1975–2016 | ARDL | REC CO2 decrease |
| Pata (2018) | Turkey 1974–2014 | ARDL | No granger causality |
| Paweenawat and Plyngam (2017) | Thailand 1986–2012 | ARDL | No granger causality |
| Rahil et al. (2019) | Libya 2015 | SAM | REC CO2 decrease, which has economic benefits |
| Shahzad et al. (2018) | China and India 1970–2013 | ARDL | REC CO2 decrease |
| Toumi and Toumi (2019) | Saudi Arabia 1990–2014 | ARDL | REC CO2 decrease |
| Ummalla and Samal (2019) | China and India 1965–2016 | ARDL | No granger causality |
| Yazdi and Shakouri (2018) | Germany 1975–2014 | VAR | No granger causality |
| Zaghdoudi (2017) | OECD 1990–2015 | PCM | No granger causality |
| Zrelli (2017) | Mediterranean 1980–2011 | PVECM | REC CO2 growth |
| This paper | Most of the countries grouped by their income levels in BRI in 1992–2014 | LMDI | – |
Notes: USA, MENA and OECD are the United States of America, Middle Eastern and Northern Africa, Organization for Economic Cooperation and Development, respectively. PCM, ARDL, PVAR, FMOLS, PVECM and SAM are the methods of panel cointegration model (PCM), auto regressive distributed lag (ARDL), panel vector autoregression (PVAR), fully modified ordinary least square (FMOLS), panel vector error correction model (PVECM), scenario analysis model (SAM), respectively. “A B” means A is the granger reason of B and vice versa.
In Table 1, most studies concluded that the increasing REC could reduce regional carbon emissions (Apergis and Payne, 2015; Long et al., 2015; Hanif, 2018). However, some others thought that the nexus between the REC and CO2 emission was not obvious (Cherni and Jouini, 2017; Zaghdoudi, 2017; Emir et al., 2019). There are even a few studies that found that the REC’s growth could cause the increase of CO2 emission and vice versa (Lu, 2017; Zrelli, 2017; Ben Jebli, 2019). Then, except for Dong et al. (2018a, 2018b, 2020), almost all researchers chose one/some specific countries or regions as cases to study this nexus between the REC and CO2 emissions. For example, Ito (2016), Lu (2017), Pata (2018) and Lee (2019) chose 31 developed countries, Asian, Turkey and European Union as cases, respectively, to study this nexus. However, studies on this issue for the belt and road initiative (BRI) region were relatively quite rare. Third, the studied periods in most cases were short, except for the four articles of Long et al. (2015), Leal et al. (2018), Lee (2019) and Ummalla and Samal (2019). Fourth, the methods were mainly some econometric models. The classical theories of environmental Kuznets curve (EKC) and stochastic impacts by regression on population, affluence and technology (STIRPAT) model were often used. However, some other methods such as the logarithmic mean Divisia index (LMDI) was rarely introduced (Ang, 2004; Pachauri, 2014).
Why do the previous studies on the nexus between REC and CO2 emissions have different, even opposite, findings? This question may be arising from many reasons such as the differences in economic development pattern (Chiu and Chang, 2009; Menyah and Wolde-Rufael, 2010), geographical characteristics and habits of energy use (Shafiei and Salim, 2014; Bilgili et al., 2016; Dogan and Seker, 2016a, 2016b). However, as most studies (Zoundi, 2017; Zhang and Wang, 2019; Ullah et al., 2019), the authors believe that the use of renewable energy is bound to contribute positively to carbon reduction in the long run (Rehman et al., 2019; Kim Hanh and Kakinaka, 2019; Isiksal et al., 2019). Even so, the previously related studies centering on this nexus for the BRI region from the income levels’ perspective were still inadequate. Among them, only one article focused on the differences from the income levels’ perspective but not for the BRI (Dong et al., 2018a, 2018b). Therefore, using the LMDI method, the authors try to do a new work containing most of the countries in the BRI during 1992–2014 to make up for this gap, which is the innovation of this paper. The rest contents are arranged as follows. Data sources and methodology are explained in Section 2. Specific results and related discussion and analysis are listed in Section 3. Conclusions and some policy implications are summarized or proposed in Section 4.
2. Data and methodology
2.1 Data source
The datasets of grouped countries in high income (HI), upper middle income (UM), lower middle income (LM) and low income (LO) levels can be acquired from the world development indicators of the World Bank (WB). There are a total of 55 countries or areas of the BRI region selected for this study by the data availability. Their specific names are shown in Table A1.
Specific countries or areas grouped by their income levels for the BRI region
| HI countries | Israel; Oman; Saudi Arabia; Singapore; Bahrain; Brunei Darussalam; Croatia; Czech Republic; Estonia; Hungary; Kuwait; Latvia; Lithuania Poland; Qatar; Slovak Republic; Slovenia; United Arab Emirates |
| UM countries | Iran, Islamic Rep.; Iraq; Malaysia; Sri Lanka; Thailand; Turkey; China; Albania; Armenia; Azerbaijan; Belarus; Bosnia and Herzegovina; Bulgaria Georgia; Jordan; Kazakhstan; Lebanon; North Macedonia; Romania; Russian Federation |
| LM countries | Egypt, Arab Rep.; India; Indonesia; Myanmar; Pakistan; Philippines; Bangladesh; Cambodia; Kyrgyz Republic; Moldova; Mongolia; Ukraine Uzbekistan; Vietnam |
| LO countries | Nepal; Tajikistan; Yemen, Rep |
2.2 Methodology
The additive LMDI is used, which is considered a preferred method (Ang, 2004; de Freitas and Kaneko, 2012; Mousavi et al., 2017). The main variables and their respective abbreviations and units are shown in Table 2. First, the total CO2 emissions of the studied regions are decomposed into the following equation (1) or equation (2):
Main variables and their respective abbreviations and units
| Abbreviations | Variables | Units |
|---|---|---|
| C | CO2 emissions of the studied region in total | Tonnes |
| Ci | CO2 emissions arising from i type’s energy consumption such as coal, oil, gas and other non-fossil or renewable energy | Tonnes |
| E | Energy-use quantity of the studied in total | Tonnes oil equivalent |
| GDP | GDP of the studied region in constant 2010 dollar in total | Dollar |
| P | The population of the studied region in total | / |
| CE | Integrated carbon coefficient of energy-mix use | Tonnes per tonnes of oil equivalent energy use |
| EG | Energy consumption per unit of GDP | Tonnes per dollar |
| GP | GDP per person | Dollar per capita |
| Ei | Energy consumption amount of i type’s energy | Tonnes oil equivalent |
| CI | Sum of carbon coefficient effect of i type’s energy-use | Tonnes per tonnes of oil equivalent energy use |
| Es | Structure factor of energy use | Percent |
| ΔCtot | Total CO2 emissions’ change from period 0 to T | Tonnes CO2 |
| ΔCE | Integrated carbon coefficient effect of energy-mix use or REC effect | Tonnes CO2 |
| ΔEG | Effect of energy consumption per unit of GDP (energy intensity) | Tonnes CO2 |
| ΔGP | Effect of GDP per person (economic output) | Tonnes CO2 |
| ΔP | Effect of population amount (increase) | Tonnes CO2 |
| ΔCI | Effect of carbon coefficient | Tonnes CO2 |
| ΔES | Effect of energy structure optimization | Tonnes CO2 |
Note:
/ means null
Then, the CO2 emissions’ changes of energy consumption from time period 0 (C0) to period T (CT) can be divided into the following contributions of different factors:
where:
where L is the logarithmic mean given by:
These factors’ contributions can be called population effect (ΔP), economic output effect (ΔGP), energy intensity effect (ΔEG) and the integrated carbon coefficient effect of energy-mix use (ΔCE). It should be noted that the impact of mitigating CO2 emissions from the REC is mainly manifested by the ΔCE index. Thus, this ΔCE index can also be simply called the REC effect. Furthermore, this REC effect can be divided into the following two effects of carbon emissions coefficient of energy use (ΔCI) and energy structure optimization and (ΔES). The reasons are the follows. First, the CO2 emissions produced by the REC are less than that of the equivalent fossil fuels. Thus, with the rise of the REC amount, the carbon coefficient of the energy-mix should be smaller, the corresponding effect of mitigating carbon emissions be more obvious. Second, the more the REC ratio in total energy consumption is, the larger the mitigation effect of carbon emissions from the energy structure optimization is.
3. Results and discussion
3.1 Decomposition results of the growth of the total carbon dioxide emission in the belt and road initiative
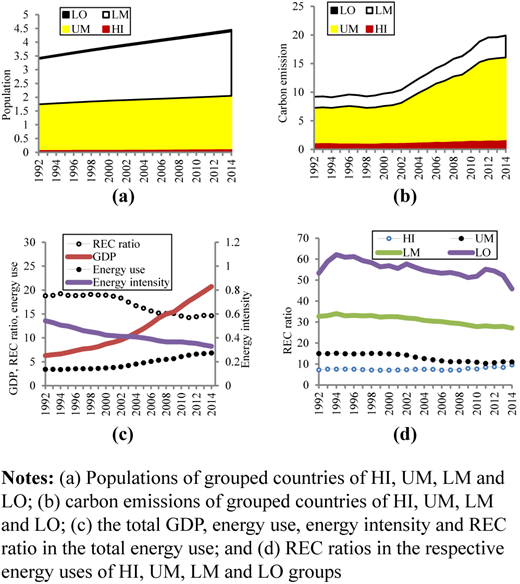
As shown in Figure 1, the population in the BRI was 3.43 billion in 1992 and it stably grew up to 4.45 billion in 2014, with a total increasing amount of 1.02 billion and an annual average increasing amount of 46.4 million and rate of 1.19%, respectively. Similarly, the BRI’s CO2 emission was 9.21 billion tonnes (Bt) in 1992, but it grew up and down to 19.91 Bt in 2014, with the total increasing amount of 10.70 Bt and the annual average increasing amount of 486.3 million tonnes (Mt) and rate of 3.57%. The gross domestic product (GDP) and energy consumptions were 6.29 × 10³ billion dollars and 3.42 Bt of oil equivalent (Btoe) in 1992 and they increased to 20.73 × 10³ billion dollar and 6.83 Btoe in 2014, with the annual average changing amount (rate) of 0.66 × 10³ billion dollars (5.57%) and 155.4 Mt (3.20%), respectively. However, the energy intensity had a decreasing change trend due to the faster increasing rate of GDP than the rate of energy use. It was 0.543 toe/103 dollar in 1992 and decreased to 0.330 toe/103 dollar in 2014, with the annual average change amount of −0.0097 toe/103 dollar and a rate of −2.24%. It should be noted that the REC’s percentages in the total energy uses were also decreasing from 18.80% in 1992 to 14.63% in 2014, with the annual average changing amount (rate) of −0.19% (−1.13%). These results meant that the exploitation and utilization of renewable energy in the BRI were not sufficient.
Population, GDP, carbon emissions, energy use/consumption, energy intensity and REC ratios of the BRI region
Population, GDP, carbon emissions, energy use/consumption, energy intensity and REC ratios of the BRI region
Then, the growth of BRI’s CO2 emissions (ΔCtot) from 1992–2014 (10.70 Bt) was decomposed into the effects of the following four factors: population effect (ΔP), economic output effect (ΔGP), energy intensity effect (ΔEG) and the REC effect (ΔCE), based on the equation (1). Particularly, the effects driven by the four factors were 3.61, 12.89, −6.90 and 1.10 Bt, respectively, with the contributions of 33.70%, 120.47%, −64.49% and 10.32% to the total CO2 change (Table 3). Then, the ΔCtot was decomposed into the five factors’ effects by equation (2) as follows: ΔP, ΔGP, ΔEG, energy structure effect (ΔES) and carbon coefficient effect (CI). The effects driven by the five factors were 3.61, 12.89, −6.90, 0.41 and 0.69 Bt, with the contributions of 33.70%, 120.47%, −64.49%, 3.84% and 6.48%. These results indicated that the economic output effect was the most important driver of carbon emissions growth, followed by the population effect. Inversely, the only energy intensity effect was the most obvious inhibitor of carbon emissions growth. The REC effect (sum of energy structure effect and carbon coefficient effect) still had the driving impact on the CO2 emissions due to the decreasing trend of the REC ratio during 1992–2014.
Decomposition results of the growth of the total CO2 emissions in the BRI region in 1992–2014
| Model 1 | ΔCtota | ΔPb | ΔGPb | ΔEGb | ΔCEb | |
|---|---|---|---|---|---|---|
| Numerical values (Bt) | 10.70 | 3.61 | 12.89 | −6.90 | 1.10 | |
| Contributions (%) | / | 33.70 | 120.47 | −64.49 | 10.32 | |
| Model 2 | ΔCtota | ΔPb | ΔGPb | ΔEGb | ΔESb | ΔCIb |
| Numerical values (Bt) | 10.70 | 3.61 | 12.89 | −6.90 | 0.41 | 0.69 |
| Contributions (%) | / | 33.70 | 120.47 | −64.49 | 3.84 | 6.48 |
Notes:
means the change of CO2 emissions;
means the decomposed driving factors; indicates a negative (mitigation) effect on CO2 emissions
It should be noteworthy that no matter the CO2 emissions’ growth was decomposed into four or five factors, the amounts and percentages of driving contribution from the same factors (ΔP, ΔGP and ΔEG) were unchanged. Moreover, the REC effect ΔCE was 1.10 Bt and its contribution was 10.32%. The two sub-factors’ effects (ΔES and CI) of the REC were 0.41 and 0.69 Bt and their effects’ sum was equivalent to the REC effect (1.10 Bt, Table 3). Similarly, the two sub-factors’ contributions were 3.84% and 6.48% and their contributions’ sum was also equivalent to the REC (10.32%). These results showed that the REC had always an overall driving impact of 10.32% on the CO2 emissions’ growth, which contained the two effects of energy structure (3.84%) and carbon coefficient (6.48%).
Nevertheless, as shown in Figure 1, the populations, carbon emissions and REC ratios of HI, UM, LM and LO groups had some obviously different changing trends. Thus, it is necessary and meaningful to study deeply the different reasons or mechanisms of carbon emissions’ mitigation for the four grouped countries of the BRI due to their heterogeneity.
3.2 Comparisons of the decomposition results of grouped countries by their different income levels
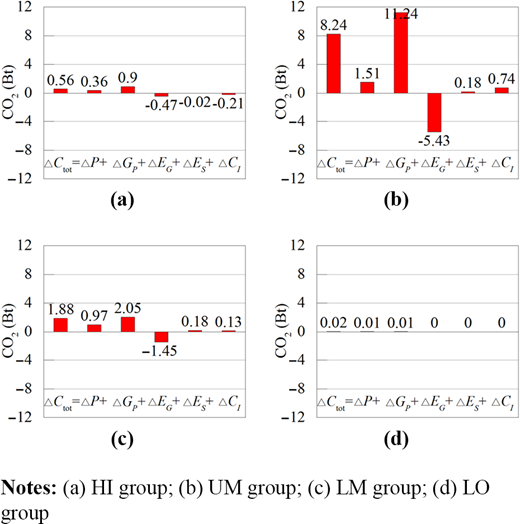
Only five factors’ decomposition results of grouped countries of HI, UM, LM and LO levels from 1992–2014 were listed in Figure 2. The corresponding (annual average) contributions were in Table 4. It can be easily seen that the growth amounts of HI, UM, LM and LO levels’ groups from 1992–2014 were 0.56, 8.28, 1.88 and 0.02 Bt, respectively. Thus, their contributions to the total CO2 growth were 5.28%, 77.02%, 17.54% and 0.16%. The corresponding annual average contributions were 0.24%, 3.50%, 0.80% and 0.01%. Namely, as the black numbers, prior attention should be paid to the UM countries. The LM and HI countries followed it and the LO countries should be the last.
Detailed decomposition results for four different groups by their income levels (ΔCtot, ΔP, ΔGP, ΔEG, ΔES and CI denote the total CO2 change in the BRI region and the effects of population, economic output, energy intensity, energy structure and carbon coefficient, respectively)
Detailed decomposition results for four different groups by their income levels (ΔCtot, ΔP, ΔGP, ΔEG, ΔES and CI denote the total CO2 change in the BRI region and the effects of population, economic output, energy intensity, energy structure and carbon coefficient, respectively)
Changes of the CO2 emissions’ growths and contributions of decomposition results for four different countries’ groups by their income levels in BRI in 1992–2014
| Groups | Variables | ΔCtota | ΔPb | ΔGPb | ΔEGb | ΔESb | ΔCIb |
|---|---|---|---|---|---|---|---|
| HI | Contributions (%) | 5.280.24 | 3.340.15 | 8.430.38 | −4.40−0.20 | −0.21−0.01 | −1.88−0.09 |
| UM | Contributions (%) | 77.023.50 | 14.080.64 | 105.074.78 | −50.76−2.31 | 1.700.08 | 6.910.31 |
| LM | Contributions (%) | 17.540.80 | 9.020.41 | 19.160.87 | −13.54−0.62 | 1.650.07 | 1.250.06 |
| LO | Contributions (%) | 0.160.01 | 0.110.01 | 0.080.00 | −0.040.00 | 0.030.00 | −0.020.00 |
Note:
Numbers in the top right corner mean the annual average changes or contributions
For the UM group, the change CO2 emissions driven by the five factors (ΔP, ΔGP, ΔEG, ΔES and CI) were 1.51, 11.24, −5.43, 0.18 and 0.74 Bt and the corresponding contributions (annual average contributions) were 14.08% (0.64%), 105.07% (4.78%), −50.76% (−2.31%), 1.70% (0.08%) and 6.91% (0.31)%. The REC effect’s contribution was 8.61% (= 1.70 + 6.91)% and its annual average contribution was 0.39% (= 0.08 + 0.31)%. These results showed that the economic output effect was the most important driver of carbon emissions growth, followed by the population effect. The driving impacts of the energy structure effect and carbon coefficient effect were less than the above two. Inversely, the energy intensity effect was the only and obvious inhibitor of carbon emissions growth. Similarly, for the LM group, the five factors’ effects were 0.97, 2.05, −1.45, 0.18 and 0.13 Bt and the corresponding contributions (annual average contributions) were 9.02% (0.41%), 19.16% (0.87%), −13.54% (−0.62%), 1.65% (0.07%) and 1.25% (0.06)%. The REC effect’s contribution was 2.90% (= 1.65 + 1.25)% and its annual average contribution was 0.13% (= 0.07 + 0.06)%.
However, for the HI group, the five factors’ effects were 0.36, 0.90, −0.47, −0.02 and −0.20 Bt and their contributions (annual average contributions) were 3.34% (0.15%), 8.43% (0.38%), −4.40% (−0.20%), −0.21% (−0.01%) and −1.88% (−0.09)%. The REC effect’s contribution was −2.09% (= −0.21 − 1.88)% and its annual average contribution was −0.10% (= −0.01 − 0.09)%. These results showed that the economic output effect was still the most important driver of CO2 growth, followed by the population effect. Inversely, the energy intensity effect was the most obvious inhibitor of CO2 growth, followed by the carbon coefficient effect and energy structure effect. Finally, for the LO group, the five factors’ effects were 0.01, 0.01, 0.00, 0.00 and 0.00 Bt and their contributions (annual average contributions) were 0.11% (0.01%), 0.08% (0.00%), −0.04% (−0.00%), 0.03% (0.00%) and −0.02% (0.00)%. The REC effect’s contribution was 0.01% (= 0.03 − 0.02)% and its annual average contribution was 0.00% (= 0.00 + 0.00)%. The population effect was the most important driver of CO2 growth, followed by the economic output effect and energy structure effect. Inversely, the energy intensity effect was the most obvious inhibitor, followed by the carbon coefficient effect.
So, it can be concluded that the HI group had the most obviously REC’s mitigating effect of −2.09%. Inversely, the UM group had the largest REC’s driving effect of 8.61%, followed by the LM and LO groups (2.90% and 0.01%). Then, the population and economic output were always the most important drivers, but the energy intensity was the inhibitor, which was consistent with other studies (Kahia et al., 2019; Emir and Bekun, 2019; Lee, 2019). Third, the contribution of the energy structure effect was negative only for the HI group (black and italic numbers, Table 4). This result indicated that the REC of the LO group had an initially and relatively unreasonable structure, in which the REC had a slight impact on the CO2 growth (0.03%). However, with economic development and population increase, the REC structure of the LM and UM groups (i.e. India and China) overly depended on fossil fuel, and thus become extremely unreasonable and had an obviously driving impact on the CO2 growth (1.65% and 1.70%). When entering into the HI group, people were more likely to use renewable energy for replacing traditional fossil fuels. Thus, the REC structure of the HI group became relatively reasonable and had a certain mitigating impact on the CO2 changes (−0.21%). Last, the carbon coefficient effect was the inhibitor of the CO2 growth only in the HI and LO groups (−1.88% and −0.02%). The reasons were that, first, with the growth of REC, the carbon coefficient should inversely decrease, which given rise to the inhibiting impact on the CO2 change. Then, the REC ratios, realistically, only in the HI group and part periods of the LO group, had some obvious growths (Figure 1).
3.3 Comparisons of the decomposition results of four countries’ groups during three varied periods
The total CO2 changes decomposed into five factors during three periods (1992–2000, 2000–2010 and 2010–2014) are compared in Table 5. The corresponding change percentages of CO2 growth and contributions of the five drivers’ effects are in Figure 3.
The total CO2 emissions change (Mt) and effects (Mt) of the decomposed drivers during three varied periods
| Periods | ΔCtota | ΔPb | ΔGPb | ΔEGb | ΔESb | ΔCIb |
|---|---|---|---|---|---|---|
| 1992–2000 | 555.15 | 1,041.59 | 2,054.70 | −2,371.25 | −11.67 | −159.24 |
| 2000–2010 | 7,651.51 | 1,452.34 | 7,024.82 | −1,878.19 | 399.28 | 653.26 |
| 2010–2014 | 2,493.25 | 762.57 | 3,420.32 | −1,986.24 | −5.46 | 302.06 |
Change percentage of CO2 emissions growth and the contribution of the decomposed drivers’ effects in three varied periods
Change percentage of CO2 emissions growth and the contribution of the decomposed drivers’ effects in three varied periods
3.3.1 Overall decomposition results during three varied periods.
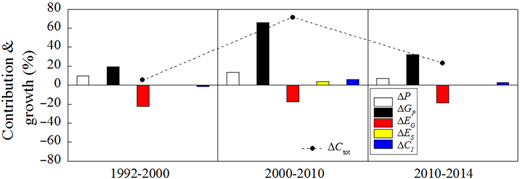
It can be easily seen that the BRI’s CO2 emissions increased 0.56 Bt with a change percentage of 5.18% in the 1st stage (Figure 3 and Table 5) and then sharply increased 7.65 Bt with the percentage of 71.52% in the 2nd stage. In the 3rd stage, the CO2 increased 2.49 Bt with a percentage of 23.30%. Overall, the CO2 emissions exhibited a sequentially increasing trend with a total growth amount of 10.70 (= 0.56 + 7.65 + 2.49) Bt.
The population had always a driving impact on the CO2 growth, with the increasing effects of 1.04, 1.45 and 0.76 Bt and contributions of 9.74%, 13.57% and 7.13% from Stages 1 to 3, respectively (Figure 3 and Table 5). Similarly, the economic output also always had a driving impact on the CO2 growth with the increasing effects (contributions) of 2.05 (19.20%), 7.02 (65.66%) and 3.42 Bt (31.97%). However, the energy intensity had always a mitigating impact on the CO2 growth, with the changing effects (contributions) of −2.37 (−22.16%), −1.88 (−17.56%) and −1.99 Bt (−18.56%). In addition, the change trends of the REC effect (contained energy structure effect and carbon coefficient effect) were not stable and often had only a relatively small influence on the CO2 emissions (Figure 3 and Table 5). Thus, for more deeply analyzing the REC’s impact on mitigating the CO2 emission, the authors divided the BRI into four countries’ groups by their different income levels during three varied periods.
3.3.2 Decomposition results of four countries’ groups by their income levels during three varied periods.
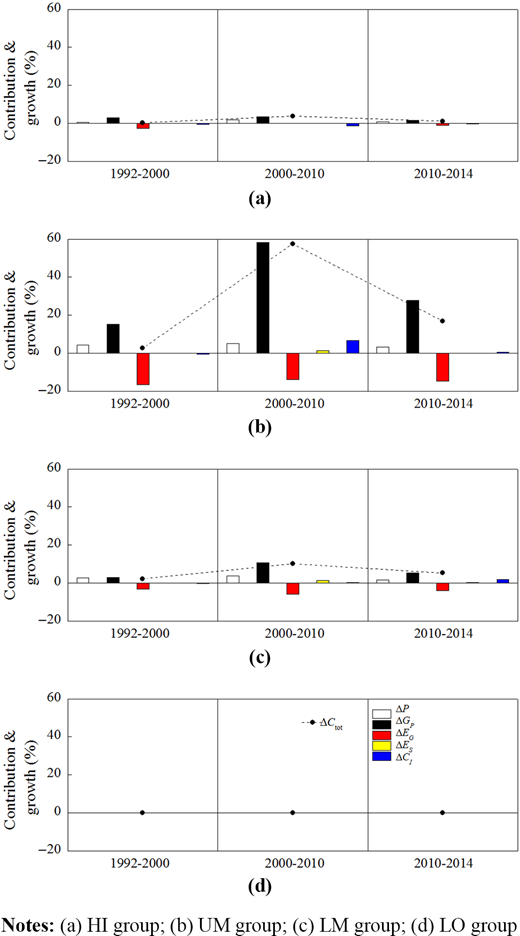
The CO2 emissions change and effects of the decomposed drivers from four countries’ groups by their income levels during three varied periods are shown in Table 6. The corresponding change percentage of CO2 growth and the contributions of five decomposed drivers’ effects are in Figure 4. The annual average change percentage of CO2 emission and contribution rates of drivers during three varied periods are shown in Table 7. It can be easily seen that the HI, UM and LM groups had the obvious CO2 changes. However, the change of the LO group can almost be neglected.
The CO2 emissions change (Mt) and effects (Mt) of the decomposed drivers from four countries’ groups by their income levels during three varied periods
| Groups | Periods | ΔCtota | ΔPb | ΔGPb | ΔEGb | ΔESb | ΔCIb |
|---|---|---|---|---|---|---|---|
| HI | 1992–2000 | 36.73 | 69.71 | 322.48 | −296.72 | 1.18 | −59.93 |
| 2000–2010 | 406.05 | 193.61 | 362.97 | −7.07 | −4.77 | −138.69 | |
| 2010–2014 | 121.92 | 87.58 | 165.64 | −123.85 | −20.25 | 12.80 | |
| UM | 1992–2000 | 283.63 | 452.90 | 1,645.05 | −1,773.60 | 7.28 | −48.01 |
| 2000–2010 | 6,151.11 | 537.13 | 6,241.05 | −1,495.20 | 155.97 | 712.16 | |
| 2010–2014 | 1,805.32 | 339.36 | 2,978.20 | −1,567.25 | −2.43 | 57.45 | |
| LM | 1992–2000 | 232.44 | 298.77 | 319.85 | −347.83 | 2.40 | −40.75 |
| 2000–2010 | 1,083.27 | 402.62 | 1,134.40 | −633.33 | 147.00 | 32.58 | |
| 2010–2014 | 561.12 | 186.01 | 566.79 | −413.56 | 24.37 | 197.51 | |
| LO | 1992–2000 | 1.35 | 4.13 | 1.41 | −3.66 | −1.41 | 0.88 |
| 2000–2010 | 11.09 | 4.84 | 6.21 | −3.56 | 2.53 | 1.08 | |
| 2010–2014 | 4.88 | 1.85 | −0.03 | 5.47 | 3.30 | −5.71 |
Change percentage of CO2 emissions growth and the contribution of the decomposed drivers’ effects from four different countries’ groups by their income levels during three varied periods
Change percentage of CO2 emissions growth and the contribution of the decomposed drivers’ effects from four different countries’ groups by their income levels during three varied periods
The annual average change percentage of CO2 emission (%) and contribution rates (%) of drivers from four countries’ groups during three varied periods
| Groups | Periods | ΔCtota | ΔPb | ΔGPb | ΔEGb | ΔESb | ΔCIb |
|---|---|---|---|---|---|---|---|
| HI | 1992–2000 | 0.04 | 0.08 | 0.38 | −0.35 | 0.00 | −0.07 |
| 2000–2010 | 0.38 | 0.18 | 0.34 | −0.01 | 0.00 | −0.13 | |
| 2010–2014 | 0.28 | 0.20 | 0.39 | −0.29 | −0.05 | 0.03 | |
| UM | 1992–2000 | 0.33 | 0.53 | 1.92 | −2.07 | 0.01 | −0.06 |
| 2000–2010 | 5.75 | 0.50 | 5.83 | −1.40 | 0.15 | 0.67 | |
| 2010–2014 | 4.22 | 0.79 | 6.96 | −3.66 | −0.01 | 0.13 | |
| LM | 1992–2000 | 0.27 | 0.35 | 0.37 | −0.41 | 0.00 | −0.05 |
| 2000–2010 | 1.01 | 0.38 | 1.06 | −0.59 | 0.14 | 0.03 | |
| 2010–2014 | 1.31 | 0.43 | 1.32 | −0.97 | 0.06 | 0.46 | |
| LO | 1992–2000 | 0.00 | 0.00 | 0.00 | 0.00 | 0.00 | 0.00 |
| 2000–2010 | 0.01 | 0.00 | 0.01 | 0.00 | 0.00 | 0.00 | |
| 2010–2014 | 0.01 | 0.00 | 0.00 | 0.01 | 0.00 | −0.01 |
The CO2 emission of the HI group increased 36.73 Mt with a change percentage of 0.34% to the total CO2 growth and an annual average change rate of 0.04% in the 1st stage (Figure 4, Tables 6 and 7). Then, it sharply increased 406.05 Mt with the percentage of 3.80% and the change rate of 0.38% in the 2nd stage. In the 3rd stage, the CO2 increased 121.92 Mt with a percentage (change rate) of 1.14% (0.28%). Overall, the HI group’s CO2 exhibited a sequentially increasing trend with a total growth amount of 564.70 Mt.
The HI group’s population had always a driving impact on the CO2 growth with the increasing effects (annual average contributions) of 69.71 (0.08%), 193.61 (0.18%) and 87.58 Mt (0.20%) from the Stages 1st to 3rd. Similarly, the economic output also always had a driving impact on the CO2 growth with the effects (contributions) of 322.48 (0.38%), 362.97 (0.34%) and 165.64 Mt (0.39%). However, the energy intensity had always a mitigating impact, with the effects (contributions) of −296.72 (−0.35%), −7.07 (−0.01%) and −123.85 Mt (−0.29%). The energy structure effects were not stable and often only had a small influence on the CO2 growth, with the effects (contributions) of 1.18 (0.00%), −4.77 (0.00%) and −20.25 Mt (−0.05%). The carbon coefficient had an overall mitigating effect except for the 3rd stage, with the effects (contributions) of −59.93 (−0.07%), −138.69 (−0.13%) and 12.8 Mt (0.03%). These results indicated that the REC effect of the HI group had an overall mitigating impact on the BRI’s CO2 growth by optimizing the structure of energy use or decreasing the corresponding carbon coefficient. Its annual average contributions were −0.07% (= 0.00 − 0.07)%, −0.13% (= 0.00 − 0.13)% and −0.02% (= −0.05 + 0.03)% from the Stages 1st to 3rd, respectively.
Similarly, the CO2 emission of the UM (LM) group increased 283.63 (232.44) Mt with a change percentage of 2.65% (2.17%) and an annual average change rate of 0.33% (0.27%) in the 1st stage. It also sharply increased 6,151.11 (1,083.27) Mt with the percentage of 57.49% (10.13%) and a change rate of 5.75% (1.01%) in the 2nd stage. In the 3rd stage, this CO2 increased by 1,805.32 (561.12) Mt with a percentage of 16.87% (5.24%) and a change rate of 4.22% (1.31%). Overall, the CO2 emission of the UM (LM) group also exhibited a sequentially increasing trend with a total growth amount of 8,240.06 (1,876.83) Mt. In the driver’s analysis, population, economic output, etc. had a similar impact on the BRI’s CO2 growth, but all them were omitted for saving space. In spite of this, it can be easily seen that the CO2 emissions growth and the corresponding drivers’ contributions of the LO group were extremely small (Figure 4, Tables 6 and 7). So, these results were also omitted.
However, it should be noteworthy that the driving effects of economic output on the BRI’s CO2 emission are quite obvious, especially in the 2nd stages of UM and LM groups (Figure 4). These results could be arising from the fact that some developing countries such as China (in UM group) and India (in LM group) had a large economic output and concurrently the quick economic development (Table A1). Meanwhile, their energy-use efficiency was relatively small. However, many developed countries, especially in the HI group’s countries, paid much attention to energy conservation and carbon emissions reduction by various means and measures, which could be reflected from the HI group’s annual average contribution rate of energy intensity effect (always negative, Table 7).
In addition, an interesting result was that only the energy intensity effect of the LO group was positive (5.47 Mt) in the 3rd stage and, concurrently, the REC effect (sum of energy structure effect and carbon coefficient effect) was negative (3.30 − 5.71 = −2.41 Mt). These results indicated that many poor countries recently developed their own economy and reduced carbon emissions only by using more and more renewable energy to replace the utilization of fossil fuels such as coal, oil and natural gas. However, worriedly, they did not pay attention to improve their level of science and technology and the production efficiency for saving energy and reducing energy intensity. So, with the fast development of the economy and quick growth of the REC, the energy intensity exhibited a driving impact (although the REC effect brought out a mitigating impact) on the CO2 growth.
3.4 Sensitivity analysis
In this study, the reliability and stability of the results are indisputable. However, these results may have a few slight errors. The reasons are as follows. First, some data themselves are generated and acquired by using the reasonable estimating method. Thus, the inevitable, although tiny error indeed exists in these databases. Then, renewable energy has many categories such as hydro, wind, solar energy, geothermal energy, biomass energy. However, the complete data containing each category are almost impossible to be found. Thus, the subtraction of total energy consumption and the total fossil energy consumption is used to replace the total REC. The approximate approach may also bring certain errors. Third, some small errors may be produced by the computation itself such as the rounded integer arithmetic method.
4. Conclusions and policy implications
The REC must have an important significance to mitigate the CO2 emissions and inhibit climate warming. However, so far, still few scientists analyzed this underlying impact’s differences from the income levels’ perspective. Thus, the authors divided most countries of the BRI region into four groups (HI, UM, LM and LO) by their income levels during 1992–2014 to analyze this issue using the preferred LMDI method.
Results show: the REC had an overall driving effect on the total CO2 change, due to the decreasing trend of the REC during 1992–2014. However, the HI group’s REC had the most obviously mitigating effect of −2.09%. Inversely, the UM group’s REC had the largest driving effect of 8.61%, followed by the LM and LO groups (2.90% and 0.01%, respectively). These results indicated that it is important to exploit and use renewable energy, especially in developing or underdeveloped countries. Because renewable energy uses are extremely insufficient and even decreasing in these countries. Then, in some countries such as China (in the UM group) and India (in the LM group), their economic development overly depended on the consumption of energy. This is because the driving effects of economic output in these countries are quite obvious, especially in the 2nd stage. More worriedly, the use of renewable energy in these countries was still relatively insufficient. This is because their REC effects were always exhibiting an overall driving impact. Thus, some special attention should also be paid to these countries. Third, during 2010–2014, only the energy intensity effect of the LO group was positive (5.47 Mt) and, concurrently, the REC effect of this group was negative (−2.41 Mt). These results showed that many poor countries recently reduced carbon emissions only by extensively using renewable energy not enhancing the corresponding efficiency. However, the other rich countries paid enough attention to reduce carbon by improving the level of science and technology to lower energy intensity. Thus, some particular policy implications for reducing CO2 in the BRI’s different countries were recommended.
First, on a whole, it should become a long-term development strategy to exploit and use renewable energy to replace the use of fossil fuels. This is because, presently, only the REC of HI countries had the obvious inhibiting impact (−2.09%) on the CO2 growth. All the other groups’ REC of upper-middle income, lower-middle income and lower income have the driving impact on the CO2 growth. The exploitation and utilization of renewable energy in these countries are relatively not enough.
Then, for the HI countries, people should continue to strengthen the development and utilization of renewable energy. At the same time, people should also continue to strengthen the relevant scientific research and improve the technology and efficiency of energy utilization. Thereby, to the greatest extent, it is possible to achieve rapid economic development and, concurrently, to use the least energy amount and to generate the least corresponding carbon emissions. Moreover, the advanced technologies or methods of renewable energy exploitation and utilization in the HI countries should, as far as possible, transfer to other countries through the appropriate way or being paid. So, based on these advanced technologies, the exploitation and utilization of the related renewable energy in developing or underdeveloped countries become more easily and quickly be come true.
Next, in the middle income countries such as China and India, the economic development overly depended on the consumption of a large number of energy (particularly fossil fuel). At the same time, the use of renewable energy was still relatively insufficient in these countries. Therefore, people should give half attention to exploit and use the related renewable energy and also concurrently give the other half attention to improve the related level of science and technology and the efficiency of energy use. These two aspects have the same importance and significance. Of course, the particular measures contained the advanced technology’s introduction of renewable energy exploitation and energy efficiency improvement.
Finally, many poor countries in the lower income group developed their own economy and reduced carbon emissions only by using more and more renewable energy to replace fossil fuel. Meanwhile, they did not pay enough attention to improve the level of science and technology for saving energy. Therefore, in these countries, people should give prior importance to improve their own energy-use efficiency to save energy and reduce emissions. All the related technologies or measures helpful to improve the efficiencies of not only the renewable energy use but also the fossil energy use, should be given the same attention and be exploited, used or introduced.
Funding: This research was funded by the Chinese National Science Foundation (71473113).
