


In recent years, agricultural activities in the Mekong Delta have frequently faced the potential risks of drought, saline intrusion and unusually heavy rainfall because of climate change, leading to a decline in crop yield. Therefore, this study aimed to establish rice planting seasons in An Giang, an upper-located province in the Mekong Delta.
The impacts of seasonal variation on the key rice seasons were simulated using the Food and Agriculture Organization-crop model for the OM6976 rice variety grown in the study area. For the simulation, the model combined crop, soil, weather and crop management data.
The results show that seasonal variation because of changes in weather factors leads to alternation in crop yields across the study area. Specifically, the spring and summer rice planting seasons are advanced by one to two weeks compared with the baseline, and crop yield increased by 5.9% and 4.2%, respectively. Additionally, planting for the autumn–winter rice season on 3 August increased crop yield by up to 8.1%.
In general, rice planting seasons that account for weather factor changes effectively reduce production costs and optimise production.
1. Introduction
In the last two decades, under the impact of climate variability (ICV), rainfall has changed significantly in various regions of the world (APN, 2010; Kontgis et al., 2019; Furuya and Koyama, 2005), leading to a lack of water for irrigation activities in the dry season, flooding in the rainy season (Brauman et al., 2013) and extreme rainfall events causing losses after harvest (Deryng et al., 2014; Zhu and Troy, 2018). The RCSA (2016) reported that climate variability would impact many Asian regions, including the Mekong Delta, in the 2020s. Climate variability is one of the main causes of drought, leading to water scarcity and unseasonal rainfall, which are the major factors limiting crop yields. According to Croitoru, rainfall is an important factor that can be directly affected by climate variability. In this context, compliance with agronomic practices such as fertiliser application, suitable plant densities, adoption of appropriate rice varieties (Bai and Xiao, 2019) and timeous planting (Dang, 2021; Trang, 2016) has been considered optimal solutions. Agronomic practices help minimise the negative ICV (Dang, 2021; Lobell, 2014; Giorgi et al., 2016) and contribute to improving crop yields (Leng and Huang, 2017). According to Sacks, selecting adaptable cultivars and planting are two of the top criteria that help to increase crop yields in the context of climate variability (CCV).
In recognition of the importance of seasonal variation in rice-growing regions in the CCV, a study on the changes in the planting seasons as an adaptation solution for rice production in Kurunegala was conducted by Dharmarathna et al. (2014). They concluded that the crop yield in the dry season would increase compared with the current crop calendar if the planting seasons were delayed by four weeks under the regional growth scenario (A2) and the increasing population scenario (B2). In the Ca Mau Peninsula of Vietnam, Deb et al. (2015) reported that a shift in planting seasons was beneficial for enhancing rice yields under the ICV. In 2016, Shrestha et al. (2016) conducted a study on adaptation strategies for rice-growing regions in Central Vietnam under the ICV and reported that a delay in planting resulted in a projected rice yield increase of up to 20%. In 2017, Li et al. (2017) reported that advancing planting by three weeks compared with the baseline would slightly increase rice yields in Cambodia by 0%–4.7%.
Vietnam has faced a high risk of crop failure because of the ICV in recent years (MNRE, 2016). Farmers usually rely on irrigation water from the Mekong River and local rainfall (Mainuddin et al., 2013). These crops face regular potential risks and must be replanted if heavy rainfall events occur after seeds have been planted or during the flowering and harvesting stages. Salim (2009) recommended that rice planting seasons in Vietnam should be altered to ensure optimal grain yield under the ICV. The harvesting stage of the summer crop season often coincides with peak-intensity rainfall varying from 10 to 50 mm/day, leading to a significant reduction in the harvested yield owing to rice paddy collapse following heavy rainfall events.
In the context of seasonal variation, the ICV has negatively affected crop seasons, so planting seasons need to be re-delineated to ensure that the different rice crop growth stages receive appropriate rainwater irrigation, contributing to minimising the adverse effects of weather factors as well as improving grain yield in the study area. Therefore, by focusing on rice paddies across An Giang Province as a typical case study, this study aimed to highlight the role of weather factors in crop productivity through a combination of statistical analysis and crop model simulation.
2. Materials and methods
2.1 Study area
An Giang, an upper-located province in the Mekong Delta, lies between 10°12′ N latitude and 10°57′ N and 104°46′ E and 105°35′ E longitude (Figure 1). It has a total agricultural land area of approximately 300,000 ha, with elevations ranging from 0.5–2.5 m a.m.s.l (Dang, 2021; Vu et al., 2018). An Giang is an agricultural province known to have the highest production in Vietnam, with average rice productivity reaching 6.74 ton per ha (Trang, 2016). Agriculture is considered a key sector, with rice production based on soil fertility and freshwater from the upper Mekong River and local rainfall (Vo and Huynh, 2014).
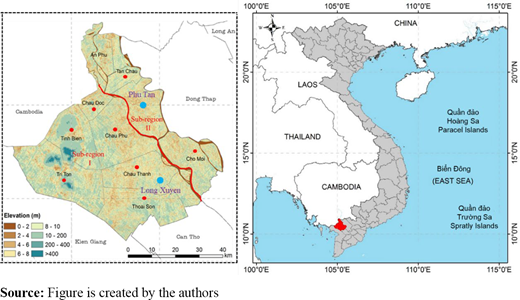
Map of the study area with rainfall observation stations for conducting the model calibration and validation marked the green circles
Map of the study area with rainfall observation stations for conducting the model calibration and validation marked the green circles
In An Giang Province, farmers often have three rice crop seasons per year, including spring, summer and autumn–winter planting seasons. The flowering and harvesting stages can vary from season to season and year to year based on weather conditions, as well as the decisions of professional management agencies. The East Asian monsoon circulation is dominant in the study area and is divided into two main seasons: the southwest and northeast monsoon. The southwest monsoon is characterised by heat and humidity with abundant rainfall, whereas the northeast monsoon is dry and hot, producing very little rainfall. Average temperatures range between 26.3°C and 28.5°C, with average annual precipitation varying from 1,268.5 mm at the Chau Doc station to 1,549.6 mm at the Long Xuyen station, of which approximately 90% falls in the wet season (Table 1).
Average annual rainfall (AAR) and standard deviation (SD) at weather stations
| No. | Station name | AAR (mm) | SD (mm) | Latitude (N) | Longitude (E) |
|---|---|---|---|---|---|
| 1 | Chau Doc | 1,285.6 | 76.6 | 10°33′24 | 105°08′09 |
| 2 | Xuan To | 1,467.9 | 84.7 | 10°35′32 | 104°56′44 |
| 3 | Tri Ton | 1,421.4 | 85.0 | 10°23′50 | 104°59′08 |
| 4 | Long Xuyen | 1,399.8 | 97.6 | 10°23′08 | 105°26′04 |
| 5 | Tan Chau | 1,300.1 | 88.7 | 10°50′32 | 105°11′04 |
| 6 | Phu Tan | 1,378.7 | 86.2 | 10°40′00 | 105°17′22 |
| 7 | Cho Moi | 1,409.6 | 86.5 | 10°28′57 | 105°28′37 |
Rainfall is highly concentrated in the western and southern districts, with up to 1,430 mm per year, and it decreases gradually in the eastern and northern districts, down to 1,350 mm per year. In recent years, a significant reduction in rainfall has been recorded in the northern districts, which could negatively impact agricultural production in the study area (Vo and Huynh, 2014). Therefore, the area faces the ICV, leading to drought, flooding and unseasonal rainfall. For example, in 2016, the worst drought event in 90 years was recorded in Vietnam; the lower Mekong River receded to its lowest level since 1926, and water shortages hampered agricultural productivity in regions of Vietnam (FAO, 2016). Furthermore, the collapse of the Xe-PianXe-Namnoy dam in Laos in 2018 because of heavy rainfall led to rapidly increasing floodwater levels which impeded the ongoing harvest of the summer crop (Mainuddin et al., 2013). The low-lying geography of the study area makes it vulnerable to sea-level rise, salinity intrusion and flooding because of heavy rainfall events (RCSA, 2016). The area is divided into two subregions (Figure 1) based on topographical conditions and irrigation water sources. Specifically, subregion I is characterised by a lower topography from north to south and east to west, with the rice paddies receiving irrigation water from the Hau River and local rainfall. However, the rice fields in the coastal districts sometimes regularly face saline intrusion during the dry season and flooding during the wet season. Subregion II is characterised by a lower topography from north to south, and the rice fields receive irrigation water from the Tien and Hau Rivers and local rainfall. Subregion II has not faced saline intrusion and is rarely flooded during the wet season.
2.2 Model description
The Food and Agriculture Organization (FAO)-crop model was designed by the FAO to evaluate the irrigation water requirement, biomass, component and crop yields, fertiliser, nutrient management and planting under current and future climatic conditions (Lee and Dang, 2019; Steduto et al., 2009). Its performance has been demonstrated by study outcomes that have been widely adopted for a wide range of applications at different spatial and temporal scales, for example, simulating a maize crop in a semi-arid region in India; predicting the spatiotemporal shifts of rice phenology in China from 1981–2010 (Bai and Xiao, 2019); estimating rice productivity in the Ca Mau Peninsula, Vietnam (Deb et al., 2015); and simulating canopy cover, biomass, yield and water requirement in Southern Taiwan (Greaves and Wang, 2016). Details of the crop model can be found in FAO, 2015.
2.3 Data collection
To conduct this study, weather data from 2000 to 2018 were obtained from Phu Tan and Long Xuyen meteorological stations, whereas evaporation data were calculated based on the Penman-Monteith formula. Specifically, rainfall data from 2000 to 2010 [Figure 2(a)] were used for model calibration, whereas rainfall data from 2011 to 2018 [Figure 2(b)] were applied for model validation.
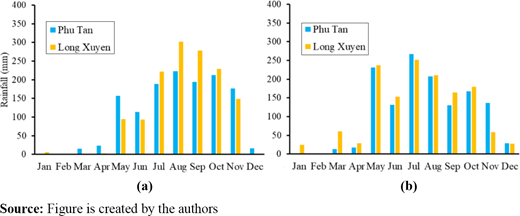
Precipitation data for a) model calibration using 2000–2010 data and b) model validation using 2011–2018 data
Precipitation data for a) model calibration using 2000–2010 data and b) model validation using 2011–2018 data
To simulate crop yield, detailed data on the soil characteristics were collected from a field survey at Phu Tan and Long Xuyen stations and were analysed for application as input data. The analysis indicated that the soil components were sandy loam to loamy sand and alkaline to slightly alkaline (pH = 4.6–5.8). The soil contained a Ca2+ content of 7.5–13.0 mg kg−1 and a Mg2+ content of 2.69–4.73 mg kg−1 in the upper surface layer (0–120 cm). Based on the indicative values for soil water content by the FAO (2015), the moisture content at saturation (SAT) was 47%, field capacity was 32%, permanent wilting point was approximately 20%, saturated hydraulic conductivity was 120 mm m−1 and total available soil water was 225 mm per day. The crop management data for rice cultivation were collected from the Department of Agriculture and Rural Development. Detailed information on planting, harvesting times, density at planting, fertiliser application and irrigation amount are presented in Table 2. OM6976 is a rice cultivar with high productivity and good pest resistance, with a planting cycle varying from 95 to 105 days and is planted widely in the area (Table 2).
Crop calendar, fertiliser schedules and application rate for rice varieties
| Crop | Crop calendar | Variety | Density (kg ha−1) | Fertiliser schedules and applications rate | |||||||
|---|---|---|---|---|---|---|---|---|---|---|---|
| Plant | Harvest | I | II | III | IV | Urea | N | K | |||
| Spring | 05 December | 15 March | OM6976 | 180 | 10 | 20 | 28 | 42 | 80 | 70 | 60 |
| Summer | 08 April | 24 July | OM6976 | 200 | 8 | 16 | 27 | 36 | 90 | 70 | 60 |
| Autumn–winter | 10 August | 22 November | OM6976 | 180 | 9 | 17 | 26 | 35 | 100 | 60 | 60 |
Notes:
I, II, III and IV are days after planting (DAP)
The paddies are commonly planted in the first week of December and harvested in the third week of March for the spring rice season, planted in the second week of April and harvested in the fourth week of July for the summer rice season and planted in the second week of August and harvested in the fourth week of November for the autumn–winter rice season. Fertiliser was applied at the recommended rates to obtain an optimal crop yield for all crop planting seasons varying from 80–100 kg ha−1 for Urea, 60–70 kg ha−1 for N and 60 kg ha−1 for K. The optimal fertiliser schedules were determined for the first time as 8–12 days after planting (DAP), the second time at 18–22 DAP, the third time at 27–32 DAP and the final time at 40–43 DAP (Table 2).
2.4 Model performance assessment
The model performance was assessed using the agreement of regression equations based on the observation data and the calculated model. Error statistics such as the coefficient of determination (R2), index of agreement (d) and root mean square error (RMSE) were used in this study (Greaves and Wang, 2016; Lee and Dang, 2019).
3. Results and discussion
3.1 Model calibration and validation
The crop model was calibrated using the rice yield of the three rice crops during 2000–2010 period. Results indicated a strong linear correlation between the model and the observed yield corresponding to the spring, summer and autumn–winter planting seasons [Figure 3(a), 3(b), 3(c)] in subregion I, with d, R2 and RMSE varying from 0.84–0.93, 0.89–0.94 and 0.17–0.38, respectively; the corresponding values for subregion II were 0.79–0.88, 0.86– 0.91 and 0.21–0.45, respectively (Table 3).
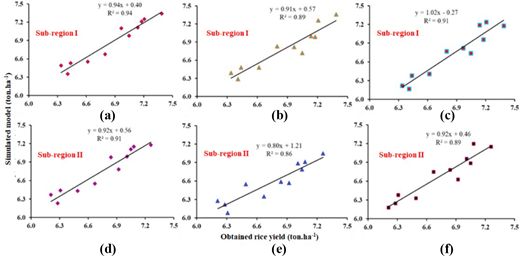
Results of model calibration based on the simulated and observed yield of a) spring, b) summer and c) autumn–winter planting seasons in subregion I; and d) spring, e) summer and f) autumn–winter planting seasons in subregion II
Results of model calibration based on the simulated and observed yield of a) spring, b) summer and c) autumn–winter planting seasons in subregion I; and d) spring, e) summer and f) autumn–winter planting seasons in subregion II
Evaluation results of the performance of the applied model
| Region | Crop | Calibration | Validation | ||||
|---|---|---|---|---|---|---|---|
| d | RMSE | R2 | d | RMSE | R2 | ||
| Subregion I | Spring | 0.93 | 0.17 | 0.94 | 0.92 | 0.19 | 0.95 |
| Summer | 0.84 | 0.38 | 0.89 | 0.87 | 0.33 | 0.91 | |
| Autumn–winter | 0.88 | 0.25 | 0.91 | 0.89 | 0.27 | 0.93 | |
| Subregion II | Spring | 0.88 | 0.21 | 0.91 | 0.90 | 0.24 | 0.91 |
| Summer | 0.79 | 0.45 | 0.86 | 0.83 | 0.37 | 0.87 | |
| Autumn–winter | 0.82 | 0.31 | 0.89 | 0.85 | 0.29 | 0.90 | |
Similarly, model validation was also performed for the three rice crop planting seasons using crop yield from the 2011–2018 period. The accuracy of the applied model is shown in Table 3. Results showed a high correlation between the model and observed yield with d, R2, and RMSE varying from 0.87–0.92, 0.91–0.95 and 0.19–0.27, respectively, in subregion I; the corresponding values for subregion II were 0.83–0.90, 0.87–0.91 and 0.24–0.37, respectively Figure 4.
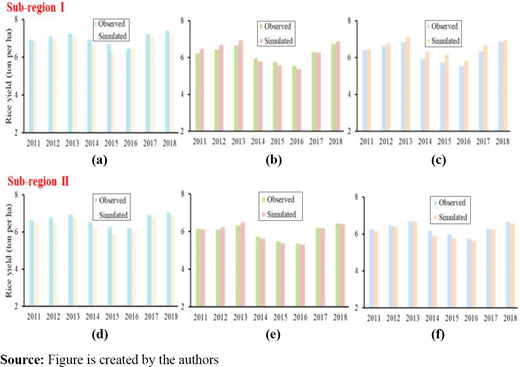
Results of the model validation based on the simulated and observed yield of a) spring, b) summer and c) autumn–winter planting seasons in subregion I; and d) spring, e) summer and f) autumn–winter planting seasons in subregion II
Results of the model validation based on the simulated and observed yield of a) spring, b) summer and c) autumn–winter planting seasons in subregion I; and d) spring, e) summer and f) autumn–winter planting seasons in subregion II
3.2 Impact of seasonal variation on crop yield
For years, rice has been cultivated in An Giang Province without considering seasonal variations. Cultivating rice under inappropriate weather conditions, such as high daily rainfall during harvest, can reduce rice production. According to Kunimistu and Kudo (2015), heavy rainfall events that occur continuously during the flowering stage of rice can reduce the grain filling process.
The results indicated that the crop yield of rice planting seasons in the An Giang Province increased notably if the rice received low daily rainfall during the flowering and harvesting stages. Specifically, for spring and summer planting seasons, a planting delay of one to two weeks resulted in low daily rainfall during the flowering and harvesting stages. Crop yield of the spring and summer planting seasons increased by approximately 5.9% and 5.1% for subregions I and II, respectively (Table 4).
Change in rice yield (%) for different planting times in the study area
| Region | Crop | Percentage yield change corresponds to the different planting seasons | ||||||||||
|---|---|---|---|---|---|---|---|---|---|---|---|---|
| Earlier (week) | Later (week) | |||||||||||
| −5 | −4 | −3 | −2 | −1 | Current (ton ha−1) | 1 | 2 | 3 | 4 | 5 | ||
| I | Spring | −5.9 | −4.4 | −2.9 | −2.9 | 1.7 | 6.8 | 4.3 | 5.9 | 4.4 | 2.9 | −1.5 |
| Summer | −4.8 | −6.3 | −7.9 | −4.8 | −3.2 | 6.3 | 3.2 | 4.2 | 3.2 | 3.2 | −1.6 | |
| Autumn-winter | −1.5 | 1.5 | 3.0 | 6.1 | 3.0 | 6.6 | 2.1 | −3.0 | −6.1 | −4.5 | −2.8 | |
| II | Spring | −6.2 | −4.6 | −4.6 | −3.1 | −1.5 | 6.5 | 4.6 | 3.1 | 4.2 | 1.5 | −1.3 |
| Summer | −1.7 | −3.4 | −5.1 | −1.7 | −1.7 | 5.9 | 5.1 | 5.1 | 5.1 | 3.4 | −1.4 | |
| Autumn-winter | −1.6 | 3.2 | 3.2 | 8.1 | 3.2 | 6.2 | 2.0 | −4.8 | −6.5 | −4.8 | −2.6 | |
Consequently, if planting is delayed by two weeks compared with the baseline, the autumn–winter planting season can approach the maximum crop yield. This implies that bringing forward the autumn–winter planting season by one to two weeks will help achieve an optimal crop yield. These simulated results are consistent with the actual weather conditions. When planting is brought forward by one to two weeks, rice will receive high daily rainfall during its growth phase but will receive less daily rainfall during the flowering and harvesting phases, which is favorable for high-yielding crops.
4. Conclusion
The impacts of seasonal variation due to climate change in the rice cultivating regions across the An Giang Province were estimated using the FAO-crop model.
The model was applied to simulate the crop yield of three key rice planting seasons in the An Giang Province based on combining crop, soil, weather and crop management data. The results show that the crop yield of the three rice seasons can be significantly influenced by seasonal variation because of climate change. In general, the planting calendar of the three rice seasons is no longer suitable, and farmers are exposed to high risks leading to crop failure. Therefore, it is necessary to adopt technological solutions in the near future to enhance rice production abilities and mitigate the effects of global climate variability.
Author contributions: H.P.H. Yen and N.V. Hong discussed the original idea of the draft. H.P.H. Yen analysed and designed the input data. N.V. Hong established the input data and performed the model simulation. H.P.H. Yen wrote and edited the manuscript. N.V. Hong analysed the output data. Both authors reviewed and submitted the final version of the manuscript.
Conflict of interest: The authors declare that there are no conflicts of interest.

