


This study aims to evaluate the knowledge and attitudes of dairy farmers about climate change in dairy farms in the Eastern Cape province of South Africa.
The study was conducted following a cross-sectional research design (Bryman, 2012). The study was conducted mainly on dairy farms located on the south-eastern part of the Eastern Cape province in five districts out of the province’s six districts (Figure 1). These districts include Amathole, Chris Hani, OR Tambo and Cacadu; these regions were not included in a recent surveying study (Galloway et al., 2018).
In all, 71.7% of dairy farm workers heard about climate change from the television, and 60.4% of participants reported that they gathered information from radio. Eighty-two out of 106 (77.4%) correctly indicated that climate change is a significant long-term change in expected weather patterns over time, and almost 10% of the study participants had no clue about climate change. Approximately 63% of the respondents incorrectly referred to climate change as a mere hotness or coldness of the day, whereas the remainder of participants correctly refuted that definition of climate change. Most of the study participants correctly mentioned that climate change has an influence on dairy production (92.5%), it limits the dairy cows’ productivity (69.8%) and that dry matter intake of dairy cows is reduced under higher temperatures (75.5%).
The use of questionnaire to gather data limits the study, as respondents relied on recall information. Also, the sample size and study area limits use of the study as an inference for the excluded parts of the Eastern Cape Province. Also, it focused only on dairy farm workers and did not request information from beef farmers.
This study imply that farmers without adequate knowledge of the impact of climate change keep complaining of a poor yield/ animal productivity and changing pattern of livestock diseases. Hence, a study such as the present one helps to bridge that gap and provide relevant governing authority the needed evidence for policy changes and intervention.
Farmers will begin to get help from the government regarding climate change.
This a first study in South Africa seeking to document the knowledge of dairy farm workers about climate change and its impacts on productivity.
1. Introduction
Globally, the demand for milk and milk-related products far exceeds the supply (FAO, 2008; Lemmer, 2018; Wreford and Topp, 2020). Hence, milk production has to double to meet the protein needs of the growing population. Adverse climatic conditions are associated with catastrophic consequences for global food production (FAO, 2016; IPCC, 2007). Thus, climate change and food security are burning issues attracting international organisations such as the World Health Organisation (WHO) and the Food and Agriculture Organisation (FAO). The WHO projects that between 2030 and 2050, climate change is expected to cause roughly 250,000 deaths per year from heat stress, malnutrition, diarrhoea and malaria (Dioula et al., 2013; FAO, 2014; IPCC, 2007; WHO, 2007; Wreford and Topp, 2020). Also, the International Fund for Agricultural Development reports that at least 70% of people living in rural areas depends partly or entirely on agriculture for their livelihoods (FAO, 2016). Furthermore, about 500 million smallholder farmers in the developing countries support almost 2 billion people, and in Asia and sub-Saharan African, these small farms produce 80% of the food consumed. Hence, climate change directly impacts farmers' ability to produce food sustainably (Osei-Amponsah et al., 2020).
The dairy industry is one of the critical sectors contributing to global food security and is directly affected by climate change. One of the important climate change components that pose a grave danger to dairy farms is heat stress (André et al., 2011; Osei-Amponsah et al., 2020; Ravagnolo and Misztal, 2000; St-Pierre et al., 2003). Heat stress is described as discomfort in a dairy cow when there is an imbalance in heat energy produced by the cow and its environment induced by high temperatures and thermal radiation (André et al., 2011; Nguyen et al., 2019; St-Pierre et al., 2003; Wreford and Topp, 2020). This discomfort drastically reduces dry matter intake and consequently reduces the milk yield of dairy cows. In the United States, approximately 2,000 kg of milk is lost per cow per year, amounting to an estimated 800 million US dollars due to heat stress (St-Pierre et al., 2003). A later study further warned about the negative relationship between high humidity, solar radiation and milk production levels of dairy cows (André et al., 2011).
Previous studies have pointed out that heat stress has a severe effect on high-producing cows such as Holstein-Friesian and Ayrshire, and it takes up to a maximum of 9 days for the cows to recover (André et al., 2011). Also, Scholtz and Grobler (2011) reported that dairy cows under a conventional/pasture-based system are more susceptible to heat stress. In South Africa, dairy farms are vulnerable to climate change because they mainly operate under the pasture-based system. The pasture-based system has an increased susceptibility to climate change (Milk Producers Organisation, 2018; Scholtz and Grobler, 2011; Williams et al., 2016). As a result, dairy farmers are expected to set up barns, sprinklers and shades to protect dairy cows from heat stress and combat climate consequences (André et al., 2010). However, limited studies have evaluated the knowledge, attitudes and perceptions about climate change in dairy farms in the Eastern Cape province of South Africa. Hence, the study's objective was to evaluate the knowledge and attitudes of dairy farmers about climate change in dairy farms in the Eastern Cape province of South Africa.
2. Materials and methods
2.1 Ethical considerations
Ethical clearance certificate REC-270710-028-RA Level 1 with project number JAJ011SDINO1 was obtained from the University of Fort Hare Research and Ethics Committee before the data collection process.
2.2 Research design and study area
The study was conducted following a cross-sectional research design (Bryman, 2012). The study was conducted mainly on dairy farms located in the south-eastern part of the Eastern Cape Province in five districts out of the province's six districts (Figure 1). These districts include Amathole, Chris Hani, OR Tambo and Cacadu. These regions were selected purposively because they were not included in a previous study by Galloway et al. (2018). The Eastern Cape has the highest number of cows in milk averaging 760 cows per farm than any other province (Milk Producers Organisation, 2020).
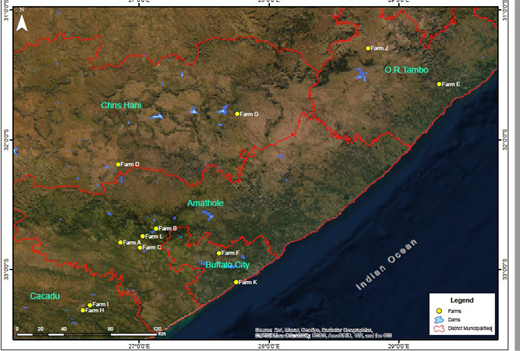
The Eastern Cape province map depicting the districts and the study sites
The Eastern Cape province map depicting the districts and the study sites
2.3 Study population
Twenty dairy farms were randomly selected, telephonically approached and sent emails requesting permission to visit and conduct the research. A snowball technique was used to reach out to small-scale dairy farms. Approval to conduct the study was obtained from 12 dairy farms, and these were the farms included in the final survey. Approximately 20 dairy workers per farm were targeted, including the managers, supervisors, general workers and bulk-tank workers. However, there were only five to ten milkers per milking session on average or found around the dairy parlour in each dairy farm, varying with farm sizes. As such, 106 respondents out of a possible 120 (10 from 12 dairy farms) correctly completed the questionnaire. Nine incorrectly filled questionnaires were excluded from the analysis.
2.4 Data collection
An online close-ended questionnaire was developed, validated and piloted on the nearby dairy farm workers and students undertaking practical training on the farm. Piloting was done to note the ease of answering the questionnaire and even the time it takes to fill it. The questionnaire mainly comprised close-ended questions, thus generating quantitative data (Bryman, 2012). The questionnaire was designed in English, and it was translated as per the respondent's home language during data collection.
There was minimal susceptibility to a social-desirability bias of the results (McConnel et al., 2017), as there was minimal acquaintance between the researcher and the respondents.
2.5 Statistical analysis
The questionnaire data were coded in Microsoft Excel to facilitate the data's quantitative analysis (Bryman, 2012). Descriptive statistics analysis was performed with IBM SPSS Statistics 25 to identify demographics and associations among nominal data variables. Cronbach's alpha based on standardised items was generated to test reliability which amounted to 0.854. Chi-square (X2) test was adopted to test for statistical associations amongst variables. In a case whereby p ≤ 0.05, the findings were regarded as significant.
3. Results
3.1 Demographic profile
Table 1 expresses the demographic information of the respondents. Most of the respondents were males accounting for 60%, while females accounted for 40% of the study population (Table 1). Almost half (49.1%) of the study population was aged between 21–30 years, whereas only 13% were within 41–60 years. Forty-five percent of the respondents had a matric certificate, with 23% dropping out in grade 12. About 32% reported having no formal primary education.
Demographic profile of the respondents
| Demographic characteristics | N | Category | Frequency | (%) |
|---|---|---|---|---|
| Gender | 106 | Female | 42 | 39.6 |
| Male | 64 | 60.4 | ||
| Age | 106 | Below 20 years | 4 | 3.8 |
| 21–30 | 52 | 49.1 | ||
| 31–40 | 36 | 34.0 | ||
| 41–60 | 14 | 13.2 | ||
| Workplace position | 106 | Manager | 24 | 22.6 |
| Supervisor | 4 | 3.8 | ||
| General worker | 62 | 58.5 | ||
| Temporary worker | 16 | 15.1 | ||
| Educational level | 106 | Less than grade 12 | 34 | 32.1 |
| Grade 12 | 24 | 22.6 | ||
| Above grade 12 | 48 | 45.3 | ||
| Work experience | 106 | 0–3 years | 48 | 45.3 |
| 4–5 years | 24 | 22.6 | ||
| Above 5 years | 34 | 32.1 | ||
| Marital status | 106 | Single | 84 | 79.2 |
| Married | 22 | 20.8 | ||
| Divorced | 0 | 0 | ||
| Widowed | 0 | 0 | ||
| Tribe | 106 | Black | 98 | 92.5 |
| White | 6 | 5.7 | ||
| Coloured | 2 | 1.9 | ||
| Indian | 0 | 0 |
Furthermore, 45.3% of the respondents had 0–3 years of dairy experience, with 32% having more than five years of dairy experience. However, 79.2% of the respondents have only worked on the same dairy farm ever since they started in the industry. The other 20.8% of the respondents had acquired experience from other dairy farms. As expected, most of the respondents (59%) were general workers, and 23% were farm managers, with 79.2% of the respondents single and the remaining 20.8% being married. The results also revealed that 57% of the respondents had been exposed to a dairy herd health course, with the remainder claiming that they have never attended any course. Finally, only 28% of the study population does not undergo medical check-ups.
3.2 Sources of information for dairy farm workers about climate change
Table 2 shows that 71.7% of dairy farm workers heard about climate change from television, and 60.4% of participants reported that they gathered information from radio. The table further displays that study participants rarely gathered information from climate change training/workshops and billboards. A handful of study participants were uncertain about their source of climate change information, whether it was television (3.8%) or school (5.7%), or colleagues (1.9%).
Sources of information for dairy farm workers about climate change
| Questions | N | Category | ||
|---|---|---|---|---|
| How did you hear about climate change and heat stress? | 106 | Yes (%) | No (%) | I do not know (%) |
| Television | 106 | 76 (71.7) | 26 (24.5) | 4 (3.8) |
| School | 106 | 56 (52.8) | 44 (41.5) | 6 (5.7) |
| Colleagues | 106 | 56 (52.8) | 48 (45) | 2 (1.9) |
| Climate change training | 106 | 16 (15.1) | 90 (84.9) | 0 (0) |
| Newspaper and books | 106 | 42 (39.6) | 64 (60.4) | 0 (0) |
| Radio | 106 | 64 (60.4) | 42 (39.6) | 0 (0) |
| Billboards | 106 | 18 (17.0) | 88 (83.0) | 0 (0) |
| Vet | 106 | 38 (35.8) | 66 (62.3) | 2 (1.9) |
3.3 The knowledge and attitudes of dairy farm workers about climate change and heat stress
Most respondents (77.4%) indicated that climate change is a significant long-term change in expected weather patterns over time, and almost 10% of the study participants had no clue about climate change. Approximately 63% of the respondents referred to climate change as mere hotness or coldness of the day, whereas the remainder of the participants refuted that definition of climate change. Table 4 shows that most managers (66.7%) answered that climate change is related to global warming, whereas others had no idea. However, there was no significant difference between the managers' understanding of climate change and the global warming association. More than 25% of the general workers answered that there is no relationship between climate change and global warming, whereas another +25% of the general workers had no clue. Tables 3 and 4 further show that female participants (60%) indicated that climate change is related to global warming. There was a statistically significant association (p ≤ 0.05) between gender and knowledge of the climate change relation to global warming. Study participants aged 21–40 years showed a better understanding of climate change than age groups outside this age range. There was a significant relationship (p ≤ 0.05) between the participants' age and the knowledge of climate change association with global warming. Participants with 4–5 years (83.3%) experience answered that climate change is related to global warming (Table 4).
Associations between demography and knowledge of climate change relation to global warming
| Climate change is not related to global warming | Total | |||||
|---|---|---|---|---|---|---|
| Demography | Yes (%) | No (%) | I do not know (%) | Chi-Square | ||
| Workplace position | Manager | 6 (25)a | 16 (66.7) a | 2 (8.3) a | 24 | |
| Supervisor | 0 (0.0)a | 2 (50.0)a | 2 (50.0)a | 4 | ||
| General worker | 16 (25.8)a | 30 (48.8)a | 16 (25.8)a | 62 | ||
| Temporary worker | 8 (50.0)a | 6 (37.5)a | 2 (12.5)a | 16 | ||
| Total | 30 (28.3) | 54 (50.9) | 22 (20.8) | 106 | 0.103 | |
| Gender | Male | 10 (23.8)a | 16 (38.1)a | 16 (38.1)b | 42 | |
| Female | 20 (31.3)a | 38 (59.4)a | 6 (9.4)b | 64 | ||
| Total | 30 (28.3) | 54 (50.9) | 22 (20.8) | 106 | 0.002** | |
| Age | Less than 20 | 2 (50)a | 2 (50)a | 0 (0.0)a | 4 | |
| 21–30 | 16 (30.8)a | 32 (61.5)a | 4 (7.7)b | 52 | ||
| 31–40 | 6 (16.7)a | 20 (55.6)a | 10 (27.8)a | 36 | ||
| 41–60 | 6 (42.9)a | 0 (0.0)b | 8 (57.1)a | 14 | ||
| Total | 30 (28.3) | 54 (50.9) | 22 (20.8) | 106 | 0.000** | |
| Tribe | Black | 30 (30.6)a | 48 (49.0)a | 20 (20.4)a | 98 | |
| White | 0 (0.0)a | 4 (66.7)a | 2 (33.3)a | 6 | ||
| Coloured | 0 (0.0)a | 2 (100)a | 0 (0.0)a | 2 | ||
| Total | 30 (28.3) | 54 (50.9) | 22 (20.8) | 106 | 0.327 | |
| Educational level | Less than grade 12 | 10(29.4)a | 18 (52.9)a | 6 (17.6)a | 34 | |
| Grade 12 | 0 (0.0)a | 14 (58.3)b | 10 (41.7)b | 24 | ||
| Greater than grade 12 | 20 (41.7)a | 22 (45.8)a, b | 6 (12.5)b | 48 | ||
| Total | 30 (28.3) | 54 (50.9) | 22 (20.8) | 106 | 0.002** | |
| Workplace experience | 0–3 years | 16 (33.3)a | 28 (58.3)a | 4 (8.3)b | 48 | |
| 4–5 years | 0 (0.0)a | 20 (83.3)b | 4 (16.7)b | 24 | ||
| More than 5 years | 14 (41.2)a | 6 (17.6)b | 14 (41.2) 34a | 34 | ||
| Total | 30 (28.3) | 54 (50.9) | 22 (20.8) | 106 | 0.000** | |
Notes:
Each subscript letter denotes a subset of Climate change is not related to global warming categories whose column proportions do not differ significantly from each other at the 0.05 level. **Significant at 0.01 level (p ≤ 0.01)
Knowledge and attitudes of dairy farm workers about climate change and heat stress
| Questions | N | Yes (%) | No (%) | I don’t know (%) |
|---|---|---|---|---|
| Climate change is a significant long-term change in the expected patterns of average weather of a region over a significant time period | 106 | 82 (77.4) | 14 (13.2) | 10 (9.4) |
| It is the hotness and/or coldness of the day | 106 | 44 (41.5) | 40 (37.7) | 22 (20.8) |
| Climate change is not related to global warming | 106 | 30 (28.3) | 54 (50.9) | 22 (20.8) |
| Does climate change have an effect on dairy production? | 106 | 98 (92.5) | 4 (3.8) | 4 (3.8) |
| Do dairy cows produce more milk under cooler climatic conditions than hot climatic conditions? | 106 | 74 (69.8) | 8 (7.5) | 24 (22.6) |
| Dry matter intake in dairy cows is lower under high temperatures | 106 | 80 (75.5) | 12 (11.3) | 14 (13.2) |
| At which parity do you think heat stress has more effect on the dairy cows’ productivity? Heifer | 106 | 34 (32.1) | 58 (54.7) | 14 (13.2) |
| At second and third parity | 106 | 50 (47.2) | 38 (35.8) | 18 (17.0) |
| At fourth parity and above | 106 | 72 (67.9) | 20 (18.9) | 14 (13.2) |
Note:
The numbers highlighted in italic are the correct answers to the questions
Most of the study participants (92.5%) mentioned that climate change influences dairy production by limiting the dairy cows' productivity (69.8%). Also noted that the dry matter intake of dairy cows is reduced under higher temperatures (75.5%). Also, 71% of the participants indicated that heat stress has a significant (p ≤ 0.05) effect on older cows. Table 4 shows a statistical relationship (p ≤ 0.05) between all participants (regardless of demography) and their knowledge of the vulnerability of older cows to heat stress (Tables 4 and 5). In addition, Table 4 shows that there is no association (p > 0.05) between the different demographic profiles and their overall knowledge of climate change and heat stress except for the age of participants (Table 5).
Association between demography of the participants and their knowledge of climate change and heat stress
| Demography | Knowledge of climate change effect on dairy production | Knowledge of production of dairy cows under different conditions | Knowledge of cows’ dry matter intake under different weather conditions | Knowledge of older cows’ susceptibility to heat stress | Knowledge of Heifers’ susceptibility to heat stress |
|---|---|---|---|---|---|
| Age | 0.259NS | 0.000** | 0.057* | 0.009** | 0.001** |
| Gender | 0.468NS | 0.218NS | 0.218NS | 0.059* | 0.456NS |
| Workplace position | 0.284NS | 0.086NS | 0.435NS | 0.002** | 0.147NS |
| Educational level | 0.002* | 0.094NS | 0.136NS | 0.002** | 0.142NS |
| Work experience | 0.105NS | 0.078NS | 0.173NS | 0.001** | 0.085NS |
| Tribe | 0.951NS | 0.000** | 0.157NS | 0.254NS | 0.021* |
Notes:
*Statistically significant at p ≤ 0.05. **Highly significant at p ≤ 0.01; NSNot significant at p > 0.05
4. Discussion
4.1 The common sources of information about climate change used by dairy farmers
There are still almost 800 million hungry people in the world who do not have access to food in the correct quantity and quality (FAO, 2016). Climate change further worsens the problem of food insecurity, especially in developing countries. In the present study, all the participants claimed that there they have heard about climate change. The assertion is similar to findings in a previous Chinese studies, which reported 90–95% of participants hearing about climate change (Jin et al., 2015; Kibue et al., 2015). The Chinese studies linked hearing about climate change to a high level of awareness. In this study, it cannot be equated to an extensive awareness as some participants could not even recall their source of information. Although most study participants heard about climate change from television and radio, hypothetically, these are not reputable platforms for dairy farmers to enhance their knowledge about climate change effects on dairy production (Kibue et al., 2015). This is because the mentioned platforms are not consistent in reporting about climate change. Previous studies have reported that training and workshops are convenient platforms for knowledge transfer about any subject matter (Jin et al., 2015; Kibue et al., 2015). However, in this study, only a handful of participants gathered information about climate change and heat stress from training or workshop.
4.2 Knowledge and attitudes of dairy farm workers about climate change
The study findings showed that the participants indicated that climate change influences the productivity of dairy cows. This corroborates findings from a recent study in Australia which reported that climate change, heat stress, in particular, deteriorate milk production in dairy cows (Osei-Amponsah et al., 2020). The study further elaborated that one of the contributing factors is a drop in dry matter intake by dairy cows during higher temperatures, which becomes evident in the average daily milk yield. Also, heat stress tampers with the dairy cows’ physiological parameters such as respiratory rate and surface body temperatures, thus lowering milk yield (André et al., 2010; Osei-Amponsah et al., 2020; West, 2003). However, the dairy farmers’ knowledge of these climate change adverse effects is not clear, thus arguable. The basis of arguing their knowledge is that they have minimal or no climate change trainings and rarely gather related information from veterinarians. They incorrectly described climate change as hotness or coldness of the day and refuted the linkage between global warming and climate, which is contrary to a recent study (Nguyen et al., 2019). Therefore, the correct indication by the participants can be equated to generalization or guesswork response.
The study participants (75.5%) correctly reported that dry matter intake in dairy cows drops during hot climatic conditions than during colder climatic conditions. This assertion is in line with a study conducted in South Africa that alluded to a redirection of energy from production to cooling by dairy cows during higher temperatures (Williams et al., 2016). An earlier study in the United States emphasized that heat stress is experienced during the day and at night when there is high humidity (West, 2003). The study further explained that physiological changes in the digestive system induce dairy cows’ drop in dry matter intake. There are no apparent measures such as shades and cooling systems in place in all study farms; therefore, the respondent correctly noted a drop in production and dry matter intake. Also, the incorrect identification of the parity in which dairy cows are more vulnerable to climate change forms a strong basis for refuting dairy farmers’ knowledge about climate change. Furthermore, in conventional dairy systems like the study farms, there is no monitoring of lactating dairy cows at night during heat stress season; therefore, the effects of heat stress are currently unknown (West, 2003).
Dairy cows take longer to recover from heat stress than from milk fever, clinical mastitis and other diseases, but no studies evaluate the farmer's knowledge of the phenomenon. Previous studies have reported that there are minimal measures that conventional dairy farmers set up to combat the effects of heat stress on dairy cows (Osei-Amponsah et al., 2020; St-Pierre et al., 2003). Heat stress is difficult or tricky to observe in dairy cows, as it coincides with other cow factors such as mastitis outbreaks and lameness. As a result, the heat stress effect on dairy cows is easily overlooked, and it remains an unresolved dairy production constraint that drastically drops the milk yield of dairy cows.
Heat stress limits the oestrus detection process and diminishes oocytes’ functioning, thus causing reproduction failures and escalating the culling and mortality of dairy cows (St-Pierre et al., 2003). Furthermore, it leads to intra-mammary infections, which leads to a high prevalence of mastitis and a high somatic cell count. Heat stress, for instance, has led to the culling of 20–40% of dairy cows in different parts of the world (Compton et al., 2017; Ghaderi-Zefrehei et al., 2017; Orpin and Esslemont, 2016). Thus, culling due to heat stress further validates the negative impact climate change has on food security.
4.3 Demographic differences in knowledge of climate change association to global warming
We observed gender disparities concerning understanding and response to climate change. These results align with an earlier study that reported that women have a more logical view of climate change than men (McCright, 2010). Interestingly, that study also revealed that political affiliations influenced the gender disparities, and these findings were supported by a later study (Liu et al., 2014). Also, findings from the current study echo the assertions of a study conducted in China which reported that women are likely to have a better understanding of climate change than men (Jin et al., 2015). People are most likely to ignore any subject such as climate change if it has no apparent influence on their livelihoods. A previous study mentioned that women are more vulnerable to climate change effects than men due to their limited access to resources which oblige them to self-equip with information to protect their households (IPCC, 2007; Jin et al., 2015). However, this study cannot clearly ascertain that the same explanation applies as there were no reported and visible signs of immediate vulnerability to climate changes. Educational levels and age can be accountable for the study participants' differences in understanding of climate change.
Study participants with higher experience incorrectly answered about the relationship between climate change and global warming than their counterparts. These findings disagree with previous studies, which alluded that first-hand experience enhances one's knowledge (Gandure et al., 2013; Kibue et al., 2015; Liu et al., 2014; Nguyen et al., 2019). Experienced participants have been reported as hesitant and negligent when planning and implementing adaptation strategies (Jin et al., 2015; Nguyen et al., 2019). This current study is not an exception as there were no visible adaptation measures in place even though more than 50% of the study population had more than 4 years of farm experience. This is evident even though previous studies have pointed out that the study farms are more vulnerable to adversities of climate change (André et al., 2011; Gandure et al., 2013; Nguyen et al., 2019; Scholtz and Grobler, 2011; Williams et al., 2016). One of the factors influencing the farmer's lack of adaptation in Africa is cultural barriers and government support (grants and unrestricted water access) (Gandure et al., 2013).
4.4 Limitations of the study
The use of questionnaire to gather data limits the study as respondents relied on recall information. Also, the study focused on dairy farm workers in the Eastern Cape province.
5. Conclusion
The study's objective was to evaluate the knowledge about climate change in dairy farms in the Eastern Cape province. The dairy farmers showed limited knowledge about climate change as they kept providing contradictory answers to knowledge-probing questions. Only a handful of farmers reported that they had attended any climate change workshop or training, thus relied on inconsistent sources of information such as radio and television. Consequently, a considerable number of participants with a higher educational level and those with more than five years of dairy experience incorrectly mentioned that climate change is not related to global warming. This is of great concern and motivates for immediate intervention by the government, researchers and curriculum designers to combat the threat posed by climate change on food security. These stakeholders can incorporate climate change mitigation strategies in their scope and host regular science engagements with dairy farms. In this study, there were also significant gender disparities regarding climate change knowledge and attitudes. This current study provided baseline information on dairy farmers' knowledge of climate change and has established a basis for in-depth climate change experimental studies.
Authors would like to thank the Risk, Vulnerability and Sustainability Centre of University of Fort Hare for funding the project. Authors would also like to acknowledge Rochen Elizabeth Wiltshire and Zamavuso Tshazi from the University of Fort Hare GIS and Remote Sensing department for their expertise on designing maps. They are also very grateful to the participation of the farmers.
Funding: This study was conducted with funding (Grant number MND200605528175) from the Department of Science and Technology (DST), South Africa and the Risk and Vulnerability Science Centre (RSVC), University of Fort Hare.
Author contributions: YSD and IFJ conceptualized the study and conducted the research, YSD curated and analysed the data and conducted the writing of original draft and IFJ and LZ supervised YSD and revised and edited the manuscript.
Declaration of competing interest: The authors declare that they have no known competing financial interests or personal relationships that could have appeared to influence the work reported in this paper.

