


This study looks at the growing trend of higher temperatures in cities during the summer months. This rise in temperature leads to various environmental and health issues. This research aims to identify the major risks posed by extreme heat, especially for vulnerable communities. It also evaluates how well the current measures in different cities around the world address this increasing problem.
The research adopts a comparative analysis approach, examining and contrasting specific measures and strategies adopted across different cities worldwide to address rising urban heat. The study reviews existing literature and real-world examples from 2023 and 2024 to explore how cities are coping with extreme temperatures, focusing on solutions such as green infrastructure, early warning systems and water management strategies.
The results reveal that, while some cities have made considerable progress in enhancing their heat resilience, including the implementation of urban greening and improved early warning systems, there remains a pressing need for more targeted measures to address urban heat effectively to strategically protect human well-being in a context where excess heat conditions migrate from exception to occurrence. The study emphasises that metropolitan areas and expanding megacities worldwide require comprehensive strategies to manage summer heatwaves and adapt to the impacts of a changing climate posing novel, compounded hazards to human health.
This paper contributes to the ongoing discourse on urban heat resilience by highlighting the emerging patterns of extreme temperatures and their effects on public health and well-being. It underscores the urgency for cities to adopt adaptive strategies to cope with rising temperatures, offering insights into the potential trajectory of heatwaves in 2024 and beyond. The study provides a timely and relevant analysis of the global urban heat challenge, urging policymakers and urban planners to prioritise sustainable and effective interventions demanded by populations across the full complex spectrum of contemporary societies.
1. Introduction
1.1 Heat and cities
As climate change progresses, cities around the world are facing significant increases in temperatures, as highlighted by the Intergovernmental Panel on Climate Change (IPCC) (IPCC, 2022; Short and Farmer, 2021). Urban areas globally have been hit by extreme heatwaves that often reach or go beyond 40°C and persist for longer periods (WMO, 2023a). These extreme weather events (EWEs) arise from ongoing global warming. Urban heating and increased humidity make the effects of rising temperatures even worse in crowded regions (IPCC, 2018; Kim and Brown, 2021; IPCC, 2022; Ivanovich et al., 2024; Tamminga et al., 2025; Tandon, 2024). Hazards related to EWEs, such as cyclones, heatwaves and floods, are becoming more intense and more frequent (GIZ, 2021; Copernicus, 2024a). This situation threatens progress on the 2030 Agenda for Sustainable Development. This pattern will likely continue, partly because of ongoing climate impacts and because there is still considerable uncertainty about the IPCC’s idea of “Zero Emissions Commitment” (ZEC) (IPCC, 2021). The potential for additional warming in the 21st century, even after reaching net-zero emissions, is both possible and significant. The overall warming could increase by more than 15% due to the combined effects of ZEC measures (Palazzo Corner et al., 2023). Short-term EWEs represent just one end of the climate-related hazards spectrum, which also includes less obvious slow onset processes (SOPs) and the risks they produce (GIZ, 2021). One effort that examines this complexity is the German GIZ’s Global Programme on Risk Assessment and Management for Adaptation to Climate Change (GP Loss and Damage) (GIZ, 2021) (Figure 1).
 The chart shows the climate risk spectrum arranged in a semi-circle with the label climate risk spectrum at the centre. On the left side are extreme weather events, including flooding, storm or cyclone, extreme rainfall, drought, and heatwave. At the centre are increasing temperatures, followed by slow onset events on the right side, including land and forest degradation, salinisation, ocean acidification, glacial retreat, loss of biodiversity, desertification, and sea level rise.
GIZ’s climate risk spectrum.
Note(s): The project deals with increasing temperatures in the middle of the climate risk spectrum and heatwaves slightly to the left (EWE), focusing on the record-breaking Northern Hemisphere summer and worldwide year. In GIZ (2021) (Link to giz.deLink to a PDF of the cited article.)
Source(s): © Deutsche Gesellschaft für Internationale Zusammenarbeit (GIZ) GmbH, Global Programme on Risk Assessment and Management for Adaptation to Climate Change (Loss and Damage)
The chart shows the climate risk spectrum arranged in a semi-circle with the label climate risk spectrum at the centre. On the left side are extreme weather events, including flooding, storm or cyclone, extreme rainfall, drought, and heatwave. At the centre are increasing temperatures, followed by slow onset events on the right side, including land and forest degradation, salinisation, ocean acidification, glacial retreat, loss of biodiversity, desertification, and sea level rise.GIZ’s climate risk spectrum.
Note(s): The project deals with increasing temperatures in the middle of the climate risk spectrum and heatwaves slightly to the left (EWE), focusing on the record-breaking Northern Hemisphere summer and worldwide year. In GIZ (2021) (Link to giz.deLink to a PDF of the cited article.)
Source(s): © Deutsche Gesellschaft für Internationale Zusammenarbeit (GIZ) GmbH, Global Programme on Risk Assessment and Management for Adaptation to Climate Change (Loss and Damage)
The summer of 2023 was Earth’s hottest since global records began in 1880, contributing to deadly wildfires, searing heatwaves and severe rainfall in various areas (NASA, 2023), aligned with the trend over the past nine years, 2015–2023, the warmest on record (Copernicus Climate Change Service, 2023). In turn, 2024 proved to be no different; also, the warming El Niño event, which emerged over the Northern Hemisphere during the spring of 2023 and developed rapidly during the summer, is likely to fuel heat in the medium term further (WMO, 2023b, 2023c; WMO, 2024; Jha et al., 2025), just like any ordinary – if significant – geophysical hazard has been shown to do in the short term (Jenkins et al., 2023). Eventually, peak temperatures have become so recurrent that they have increasingly made headlines over the past few years (Wang and Downey, 2024).
Heatwaves pose a significant risk, often underestimated by citizens and municipalities (Arsad et al., 2022); this occurrence is of particular concern to the numerous urban agglomerations that unfolded in once warm locations, but now under far drier climate conditions (Wang et al., 2023). High temperatures disrupt the body’s natural self-regulation ability (Osilla et al., 2023), thus having the ability to cause heat strokes (Obaidullah et al., 2023). One of the keys to combating summer heatwaves and increased humidity is steady hydration, seeking protection under shaded areas and wearing breathable fabrics. Loose-fitting clothing in light colours assists in keeping cool by promoting airflow around the body (Jay et al., 2021). Due to the specific nature of urban topology (i.e. infrastructures adjacent to building complexes), spatial pattern (i.e. distribution of boroughs, building density), geometry of exposure to direct sunlight (i.e. glass walls, tunnels, walkways) and composition/juxtaposition of buildings (i.e. concrete/asphalt and their reflectivity/absorption properties), above-normal temperatures may exert adverse effects on human well-being in patterns and intensity peculiar to urban contexts – i.e. the “urban heat island” effect (McCarthy et al., 2010; Hibbard et al., 2017; Santamouris, 2020; Panda et al., 2023; Yang et al., 2023; Zhao et al., 2014).
1.2 The influences of recent heatwaves
Heatwaves in 2023 have occurred in multiple regions across the Northern Hemisphere, including southern Europe. Well-above-average temperatures also occurred over several South American countries and around much of Antarctica (WMO, 2024). Besides, the annual average global temperature in 2023 dwarfed the international record, reaching +1.45°C set against the pre-industrial era (1850–1900) – approaching the critical threshold of +1.5°C set in the Paris Accords. The concept of “normal” climate and weather is thus shifting due to rising temperatures; the hottest days are getting hotter and more frequent, while droughts and floods are becoming more extreme and frequent (IPCC, 2021). Since “normal temperature” can no longer be taken for granted virtually anywhere, human life in this relatively uncharted territory (Schmidt, 2024) no longer adheres to established norms.
Beyond the various measures adopted concerning policy, infrastructural and environmental adaptation, the most resilient yet most fragile element of the equation remains the human being, undergoing changes throughout starkly evolving ecological conditions (Selby et al., 2024). Evidence has long indicated that deaths are increasingly associated with extreme, durable temperatures (Ballester et al., 2023a, 2023b; Clarke et al., 2025), with mortality rates projected to increase fourfold over the 21st century (Kovats and Brisley, 2021; Masselot et al., 2025), thus contributing to depict scenarios characterised by recurring, consistent heat in the future (Harrington et al., 2022). This also involves how, or whether, the built environment is being adapted to face temperatures that were not ordinary when most buildings were conceived. This can be the case for schools and universities too (Bolinger et al., 2024), to the point of potentially affecting the students’ proficiency (Park et al., 2020a, 2020b), in part due to infrastructures unfit to effectively shield from outside temperatures or just too expensive for public administrations to retrofit them (Phillips and Penney, 2024).
Also, socioeconomic inequalities weigh on the diverse effects of excess temperatures on human safety and overall quality of life (Gasparrini et al., 2022). Access to education and healthcare for underserved communities in outer urban contexts can face lessened levels of assistance, as can be the case for vulnerable societies (Kovats and Brisley, 2021). Similarly, low-income boroughs may undergo compounded issues due to insufficient shielding from outer climate, poor building performance, lack of air conditioning (due to costs, for instance) (Pavanello et al., 2021), landscape and location (Haddad et al., 2022). Finally, while heightened rates of mortality per se suggest a loss of safety and living conditions, excess, repeated heat may lead to several health issues less visible or more challenging to discern, including a range of aggressive behaviours (Anderson, 2001) and mental disorders (Li et al., 2023; Singh et al., 2024). After all, climate change manifestations have been known to adversely affect those citizens exposed to pre-existing neurological or psychiatric conditions (Sisodiya et al., 2024).
Based on the need to better understand the pressing issues posed by urban heat, this article reports a well-known heating trend, the July 2023 extreme heatwaves in some cities worldwide being a landmark. Against this baseline, we highlight what is being done to address the effects of warming – as real-time as doable – to then underscore the urgency posed by record temperatures, especially as climate conditions evolve. We particularly emphasise the need for collaborative and proactive strategies and purposefully suggest prevention and mitigation measures that can constrain the multiple adverse effects – both the witnessed and the less intuitive ones – on human life due to extreme temperature events.
2. Data and methods
This research employs a comparative analysis to examine how different cities worldwide are addressing urban heat. By reviewing literature and real-world examples from 2023 and 2024, the study aims to understand how a range of cities throughout varied geographies and socio-economic contexts are coping with extreme temperatures.
2.1 Context
During 2023 across the Northern Hemisphere, June, July and August combined were 0.23°C warmer than any other summer in NASA’s record. The global average surface temperature for July 2023 was the highest ever on record for any month (Copernicus, 2024a; NASA, 2023), exposing people to more frequent and intense extreme events. The temperature was 0.72°C warmer than the 1991–2020 average for July, 0.33°C warmer than the previous hottest month, July 2019, and around 1.5°C warmer than the average for 1850–1900 (Copernicus Climate Change Service, 2023). Several cities have recently reached record temperatures and humidity during heatwaves worldwide, exceeding the physiological limits (Wong, 2023; Vanos et al., 2023; Boni et al., 2025). For instance, Europe experienced its hottest recorded decades, with an average temperature rise of 2.53°C and 2.71°C above pre-industrial levels (EEA, 2023). These “new temperatures,” well exceeding the pre-existing historical series of climate fluctuations were documented in Paris, France, reaching 42.6°C in the summer of 2019 (Vautard et al., 2020) and throughout the UK, 40°C in 2019 (WMO, 2022). Paris is Europe’s most susceptible city to heatwaves among all age groups, showing the highest risk of heat-related deaths, with a 1.6-fold increased probability compared to other European cities, with Amsterdam and Zagreb closely trailing behind in heat-related risk (Masselot et al., 2019). Southern Europe has also witnessed temperatures peaking at new extremes near 45°C in Greece, Spain and southern Italy (Copernicus Climate Change Service, 2023; Wedler et al., 2023) in 2023. Moreover, a “heat dome” spread over the southern half of Latin America, leading to extreme heatwaves, heat stress, wildfires and long-term warming trends (Kephart et al., 2022; WMO, 2023d). Other examples of scorching temperatures during the historical world record temperatures during the 2016–2023 span – some of which being local maxima – include:
Mitribah, Kuwait, and Turbat, Pakistan, 54.0°C in 2019 (WMO, 2019; Merlone et al., 2019);
Phalodi, Northern India, 51.0 in 2016 (van Oldenborgh et al., 2018);
Upington, South Africa, 45.3°C in 2016 (Landman et al., 2017); and
Rivadavia, Argentina, 46.5°C in 2023 (SMN, 2023).
Considering these facts, evidence collected by Berkeley Earth (Berkeley Earth, 2023) allows us to highlight the urgency of addressing climate change impacts and implementing sustainable urban development in a consequential manner, reflecting its rather existential remit (Figure 2). Cumulatively, we used 18 data sources, which we consulted during July–August 2024; except where indicated in the References list, they are directly accessible from the websites of their respective publishers.
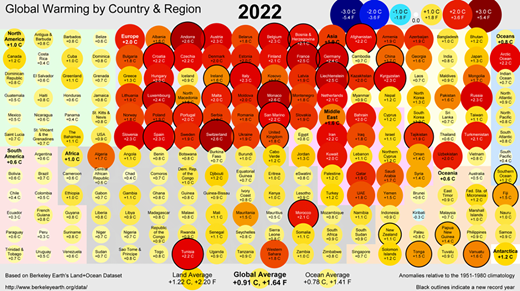
The latest data on global warming by country and region for 2022 shows anomalies in the average temperatures recorded for 1951–1980. Black outlines indicate a “new” record year. In Berkeley Earth (2023)
Source(s): © Berkeley Earth, “Global Warming by Country and Region, 2022,” CC BY-NC 4.0
The latest data on global warming by country and region for 2022 shows anomalies in the average temperatures recorded for 1951–1980. Black outlines indicate a “new” record year. In Berkeley Earth (2023)
Source(s): © Berkeley Earth, “Global Warming by Country and Region, 2022,” CC BY-NC 4.0
2.2 Workflow
To contextualise information, temperature peaks and overridden records were searched for documented evidence of cities that are part of the C40 network (C40 Cities, 2023) (state capitals, large cities and metropolitan agglomerations, spanning cities as diverse as Rome, Los Angeles and Hong Kong) that, by location, climate and local conditions, have experienced exceptional heat and have planned/deployed adaptation and mitigation measures to help curb the harmful and potentially disruptive effects of such peak and persisting heat conditions.
C40 is an international coalition of mayors from the world’s major cities across Africa, Asia, Europe, Latin America, North America and Oceania, totalling 96 cities in 48 countries, who have joined efforts to address the challenges posed by the climate crisis, among other reasons (C40 Knowledge Hub, 2019; C40 Cities, 2023; Martin et al., 2024). The mayors of C40 municipalities (C40 Cities, 2023) are adopting a collaborative, science-driven and inclusive strategy to cut their equitable portion of emissions by 50% before 2030, thus assisting the global effort to limit mean temperature rise within the 1.5°C set in the UNFCCC Paris Agreements and creating healthy, fair and resilient communities. C40 supports mayors in achieving these goals through specific initiatives, e.g. supporting climate action plans aligned with the 1.5°C target, promoting equitable measures in communities through global programs, building a global movement through advocacy, scaling up climate action by sharing best practices across sectors and facilitating access to finance for green jobs and urban resilience projects.
We thus set our search threshold at 40°C as a relevant value due to two major aspects: the numerous areas of the world where large cities have reached and (well) overcome such value and the global resonance and life-changing perspective that such peaks project across human perception. While such temperatures are not necessarily the uppermost values ever recorded in areas dwelled by humans, they represent peaks endured by residents, long-term populations and communities in urban contexts. As such, these conditions cast a peculiar occurrence, since they affect humans in the supposedly ordinary scenario of their daily lives – i.e. where they assume to prospectively thrive, not needing to find “escape routes” out of a sustained source of hazard.
Figure 3 shows examples of some cities’ regional distributions worldwide, whose temperatures occasionally or recurrently exceed 40°C. Some examples focus on newly recorded urban temperature extremes above 40°, 45°, or 50°C, as stated above and in Figure 1.
 The map highlights global regions with numbered markers indicating cities across North America, Europe, Asia, and Australia. North America includes several marked locations in the United States and Canada. Europe shows multiple city markers spread across the western, central, and southern regions. Asia includes numbered cities in China, India, and surrounding areas. Australia shows one marked city. A scale below indicates the number of cities, ranging from two to fourteen, based on spatial data sources from the Australian Bureau of Statistics, Microsoft, NavInfo, Open Places, OpenStreetMap, TomTom, Wikipedia, and Zenrin.
Selected world cities and localities hit by temperatures over 40°C (see Tables 2 and 3)
Notes(s): (data from Adnan et al., 2022; Broadbent et al., 2022; Nandi and Swain, 2023; Marvuglia et al., 2020; Nishant et al., 2022; Sharma et al., 2022; Sethi et al., 2021; Shen et al., 2022; Yang et al., 2019; Yin et al, 2018). Basemap (by Bing Technologies, © Microsoft) cumulatively plots the list in Table 1
Source(s): Figure by the authors
The map highlights global regions with numbered markers indicating cities across North America, Europe, Asia, and Australia. North America includes several marked locations in the United States and Canada. Europe shows multiple city markers spread across the western, central, and southern regions. Asia includes numbered cities in China, India, and surrounding areas. Australia shows one marked city. A scale below indicates the number of cities, ranging from two to fourteen, based on spatial data sources from the Australian Bureau of Statistics, Microsoft, NavInfo, Open Places, OpenStreetMap, TomTom, Wikipedia, and Zenrin.Selected world cities and localities hit by temperatures over 40°C (see Tables 2 and 3)
Notes(s): (data from Adnan et al., 2022; Broadbent et al., 2022; Nandi and Swain, 2023; Marvuglia et al., 2020; Nishant et al., 2022; Sharma et al., 2022; Sethi et al., 2021; Shen et al., 2022; Yang et al., 2019; Yin et al, 2018). Basemap (by Bing Technologies, © Microsoft) cumulatively plots the list in Table 1
Source(s): Figure by the authors
We extracted data from the respective sources concerning record temperatures (Adnan et al., 2022; Broadbent et al., 2022; Marvuglia et al., 2020; Nandi and Swain, 2023; Nishant et al., 2022; Sharma et al., 2022; Sethi et al., 2021; Shen et al., 2022; Yang et al., 2019; Yin et al, 2018) and plotted them on a global base map (Figure 3). Cumulatively, we used 13 data sources, which we consulted during July–August 2024; except where indicated in the References list, they are directly accessible from the websites of their respective publishers.
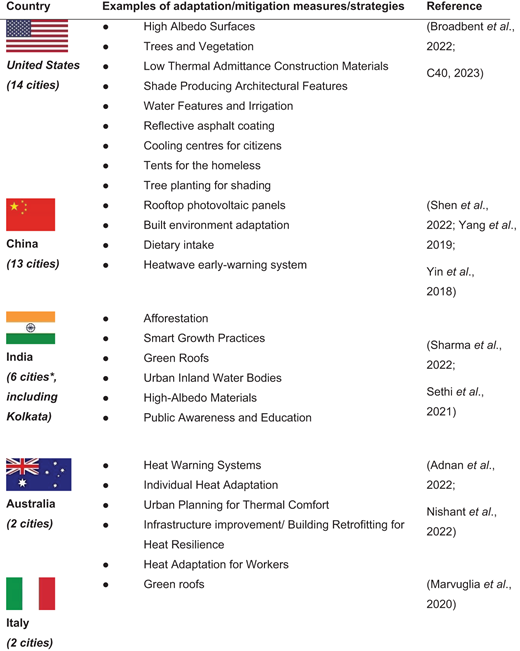
Among those cities/countries that have experienced temperatures above 40°C where adaptation and mitigation measures have been planned/deployed, we extracted data available (Adnan et al., 2022; Broadbent et al., 2022; C40 Knowledge Hub, 2019; Marvuglia et al., 2020; Nandi and Swain, 2023; Nishant et al., 2022; Sharma et al., 2022; Sethi et al., 2021; Shen et al., 2022; Yang et al., 2019; Yin et al, 2018) and broke these down by the number of cities affected per country, in descending order (Table 1). Depending on the country, city, local economy and landscape, such measures include solutions such as reflective asphalt coating, cooling centres for elderly citizens, tents for people experiencing homelessness and tree planting for shading.
Worldwide cities from the C40 database (C40; C40 cities) where two or more cities are listed per country
| City | Country |
|---|---|
| Austin | USA |
| Boston | USA |
| Chicago | USA |
| Houston | USA |
| Los Angeles | USA |
| Miami | USA |
| New Orleans | USA |
| New York City | USA |
| Philadelphia | USA |
| Phoenix | USA |
| Portland | USA |
| San Francisco | USA |
| Seattle | USA |
| Washington, DC | USA |
| Beijing | China |
| Chengdu | China |
| Dalian | China |
| Fuzhou | China |
| Guangzhou | China |
| Hangzhou | China |
| Hong Kong | China |
| Nanjing | China |
| Qingdao | China |
| Shanghai | China |
| Shenzhen | China |
| Wuhan | China |
| Zhenjiang | China |
| Ahmedabad | India |
| Bengaluru | India |
| Chennai | India |
| Delhi NCT | India |
| Mumbai | India |
| Kolkata* | India |
| Cape Town | South Africa |
| Durban | South Africa |
| Ekurhuleni | South Africa |
| Johannesburg | South Africa |
| Tshwane | South Africa |
| Curitiba | Brazil |
| Rio de Janeiro | Brazil |
| Salvador de Bahía | Brazil |
| São Paulo | Brazil |
| Montréal | Canada |
| Toronto | Canada |
| Vancouver | Canada |
| Hanoi | Vietnam |
| Ho Chi Minh City | Vietnam |
| Melbourne | Australia |
| Sydney | Australia |
| Tokyo | Japan |
| Yokohama | Japan |
| Amsterdam | The Netherlands |
| Rotterdam | The Netherlands |
| Barcelona | Spain |
| Madrid | Spain |
| Berlin | Germany |
| Heidelberg | Germany |
| Milan | Italy |
| Rome | Italy |
| Bogotá | Colombia |
| Medellín | Colombia |
| Guadalajara | Mexico |
| Mexico City | Mexico |
Italics: Subset listing cities hit by temperatures over 40°C are only from the USA, China, India, Australia, and Italy. Data from (Adnan et al., 2022; Broadbent et al., 2022; Nandi and Swain, 2023; Marvuglia et al., 2020; Nishant et al., 2022; Sharma et al., 2022; Sethi et al., 2021; Shen et al., 2022; Yang et al., 2019; Yin et al, 2018);
*removed from the C40 list, but often with temperatures above 40°C
On these grounds, we identified evidence for the following large world cities that we synthesised in Table 1.
We focused on the USA, China, India, Australia and Italy to account for the areas/world regions that we deemed most diverse and representative and convey the cases’ global remit. We thus list this subset in Tables 2 and 3, highlighting some widespread adaptation and mitigation measures – either planned or deployed – in countering heatwaves worldwide in specific countries. To partially even out differences among countries by extents and population densities, only those countries with more than two cities per country among the 96 ones belonging to the C40 Cities alliance were included (C40 Cities, 2023). Such breakdown results in 15 nations: the USA (14 cities), China (13), India (5), South Africa (5), Brazil (4), Canada (3) and finally, Vietnam, Australia, Japan, The Netherlands, Spain, Germany, Italy, Colombia and Mexico (2). Although the examples list diverse standards and innovative measures referring to specific cities, regions, or countries, most plans to tackle climate action, such as urban forestry or strategies like heat warning systems, can be expected to be implemented across all countries. While the focus of the examples has primarily been on the C40 cities group, the evidence collected from these urban centres may be seen as exemplary of broader trends to combat global warming observed in cities around the world. Other locally suggested mitigation measures, such as green roofs, are only partially practical, as they require specific conditions, such as humidity, for evapotranspiration to be effective.
Selected world cities and localities hit by temperatures over 40°C, in descending order of record temperature. Notice the diverse geographies of such localities and the rather ubiquitous occurrence of the phenomenon, hinting at how globally widespread such temperatures can be recorded
| Locality | T °C | Country |
|---|---|---|
| al-'Azīziyah | 58.0 | Libya |
| Furnace Creek | 56.7 | USA |
| Death Valley | 56.7 | USA |
| Ghadames | 55.0 | Libya |
| Kebili | 55.0 | Tunisia |
| Mitribah | 54.0 | Kuwait |
| Ahwaz | 54.0 | Iran |
| Basra | 53.9 | Iraq |
| Jacobabad | 53.7 | Pakistan |
| Turbat | 53.5 | Pakistan |
| Bandar-e Mahshahr | 53.0 | Iran |
| Needles | 51.0 | USA |
| Phalodi | 51.0 | India |
| Oodnadatta | 50.7 | Australia |
| Rivadavia | 48.9 | Argentina |
| Athens | 48.0 | Greece |
| Seville | 47.2 | Spain |
| Las Vegas | 47.0 | USA |
| Phoenix | 45.0 | USA |
| Rome | 42.0 | Italy |
Selected literature-supported examples of countries bearing temperatures above 40°C with adaptation and mitigation measures and strategies listed per descending number (≥2) of cities per reported country (C40 Cities, 2023). Notice that, in the case of Italy, green roofs emerge as a standard adaptation measure usually employed – cities per country from Table 1
 | |
3. Results
A diverse range of heat mitigation and adaptation measures at different scales have proven efficient in reducing the impact of urban heat throughout large urban agglomerations (Adnan et al., 2022). Green infrastructures, for instance, are recognised as sustainable interventions to shield heatwave effects, offering multifaceted advantages. In selected Australian cities, adopting water-sensitive urban design, which can retain water bodies, has been identified as effective in reducing extreme temperature impacts. High-albedo surfaces and radiative cooling materials can enhance solar radiation reflectance and alleviate potential heating effects; however, they have only been shown to reduce surface temperature, not air temperature, increasing the mean radiant temperature and, thus, heat stress on people (Schneider et al., 2023). Nonetheless, thermal comfort-based urban planning is instrumental in improving heat adaptation, just like public health interventions, which are essential in reducing the effects of heatwaves or containing pre-existing health-related fragilities prone to augmenting adverse impacts of excess urban heat. Raising awareness about health risks linked to heat exposure can encourage behavioural changes and other adaptation strategies to reduce heat-related effects (Nishant et al., 2022), including repercussions on outdoor working patterns (Zhang et al., 2025).
Repeated heatwaves, triggering ozone peaks and affecting air quality (EC, 2022), have forced municipalities to assist the local populations in coping with extreme heat throughout Europe (Eurocities, 2022) and globally (Giguere et al., 2025). In London, for instance, the mayor issued a press release advising people about dealing with unprecedentedly high temperatures and encouraging citizens to reach out to older adults and individuals living alone – the Cool Spaces (Mayor of London, 2023). The Mayor of London’s app shows where to find places to seek refuge from the heat. Also, a homeless assistance plan involving regular welfare checks and water distribution is in place. Broadbent et al. (2022) suggested creating a database containing cooling effectiveness values for cities in the USA, accompanied by adaptation measures to provide a comprehensive representation that allows going beyond the one-size-fits-all approach and becoming more effective.
Since heatwaves have also become more frequent in China and India, with populations of 1.4 billion (a steep multiplier of repercussions), adaptation responses must be considered over the long term rather than as occasional events, with repercussions affecting uniquely large human distributions throughout a diversity of landscapes, infrastructural and social contexts. In these cases, individual reactions should also consider awareness through education, for citizens to be better informed and prepared to handle the problem (Errett et al., 2023; Cologna et al., 2025). At the institutional level, cities in China and India have a range of adaptation measures at their disposal to address the challenges posed by rising heatwaves to their populations, particularly the most vulnerable (Sharma et al., 2022). Such strategies to counter urban heat are components of a heat-resilient infrastructure or, rather, of a deep-seated approach treating both the hazard and the vulnerability/exposure sides of the equation (Cui et al., 2024; Langendijk et al., 2024). These measures have been implemented in many cities, and their success depends on various factors, while their effectiveness is still being studied and evaluated (WEF, 2023). However, these are applicable worldwide and span across multiple sectors, including:
early-warning systems – via mobile apps or social media, possibly integrated with similar systems for further pre-existing hazards, like seismic or transportation disruption (WMO, 2023e);
comprehensive action plans, especially those devised to include local consultation and co-design (Johar et al., 2025);
green spaces and urban greening, including the exploitation of pre-existing (or abandoned) large surfaces, from parking lots to roofs (Jay et al., 2021; WEF, 2023);
water management, especially given the expected increased need due to higher population density and lengthier and harsher summers (UNEP, 2024);
resilient infrastructures, lifelines and utilities adapted to sustained, repeated hot peaks that may otherwise strain them over time (Cui et al., 2024);
public awareness campaigns, such as the one set forth by the mayor of London or broadcasted by international agencies such as UNEP or the World Economic Forum (WEF, 2023);
sustainably-powered transportation, from light rail to hybrid buses (WRI, 2019);
heat-adaptive and smart-operated agriculture to proactively use targeted water consumption only when and where needed (Mandal et al., 2024);
healthcare readiness, to prospectively anticipate extra needs for fragile societal sectors over the summertime (Zimmermann et al., 2024); and
greater international cooperation – however complex and demanding (GHHIN et al., 2025).
The World Economic Forum identified seven cities – Abu Dhabi, Los Angeles, Medellin, Seville, Sidney, Paris and Rotterdam – successfully tackling heatwaves with innovative solutions. These include “cool island” spaces, green roofs, planting trees, self-shading tower blocks and awnings and reflective coating painting (WEF, 2023); given their “ordinary” nature, these should and can be applied elsewhere. A list of national heatwave strategies set forth by southern Asian countries is connected to National Disaster Action Plans, demanding specific interventions. In this respect, Pakistan, Nepal, India and Bangladesh are among the countries with explicit heat action plans to combat heatwaves. These include building adaptive measures, public awareness, warnings and education (Sharma et al., 2022). Among existing strategies specifically considered to face extreme temperatures, green roofs are a commonly recognised adaptation and simultaneously mitigation measure against urban-induced warming and global change. In addition to other characteristics, such as temperature reduction by providing a cooling effect, green roofs can significantly reduce the cooling load of buildings during hot weather, contributing to reduced energy consumption – thus reverberating in comprehensive lower CO2 emissions. Consequently, such measures improve the overall air quality in urban areas and promote a healthier environment for residents while protecting roof waterproofing membranes from harmful UV radiation and extreme temperature fluctuations. Ultimately, they positively contribute to climate adaptation and mitigation efforts, making cities more heat-resilient and environmentally friendly (Imran et al., 2018; Marvuglia et al., 2020; Sharma et al., 2022; Wu et al., 2025).
4. Discussion
4.1 Too hot for comfort
As earlier outlined, July 2023 and 2024 reached a new world temperature ever on record, underscoring the severity of the issue and the urgency of addressing it, with the early summer of 2025 appearing no different. This is a compelling reminder of the broader implications of climate change and urban-accrued heat on urban environments.
Heatwaves and altered climate manifestations elicit several effects, including – but far from being limited to – peak temperatures and a diverse set of consequences on populations concentrated in urban spaces. We thus attempt to break down some recurring traits:
Heatwaves can make outdoor conditions unbearable, limiting people’s ability to enjoy public spaces, engage in physical activities and socialise outdoors. Addressing rising temperatures is thus aimed at protecting public health and crucial in ensuring residents’ well-being and quality of life, across a range of activities (Zhang et al., 2025).
They can expose individuals to heat-related medical risks, such as heat exhaustion and heatstroke (Obaidullah et al., 2023). They can also strain neurological conditions (Sisodiya et al., 2024) and reverberate on behaviours (Li et al., 2023). The mixture of health risks and uncomfortable outdoor conditions projects the significance of addressing urban heat as a public health concern at multiple levels and across complex social response from a multi-hazard perspective (Mitchell and Chakraborty, 2015).
Higher temperatures can disrupt local ecosystems, alter plant and animal behaviours, impact water bodies and aquatic life and affect the efficiency and reliability of urban infrastructure and lifelines. In other words, no human living space is unaffected (EEA, 2023).
Rising temperatures can worsen air pollution, posing additional health hazards, particularly for respiratory systems. This entails the stringent need for sound measures to protect vulnerable groups such as young children, the elderly, pregnant women and people who suffer from pre-existing health conditions – an element that ageing populations worldwide can only strengthen (Carr et al., 2024; Chen et al., 2023; Granés et al., 2024; Masselot et al., 2025).
Cities, however, can implement different sets of systemic strategies to reduce heat-related impacts, including urban planning measures that promote better ventilation, using sustainable building designs, and raising public awareness about heat-related risks and those actions to take when extreme heat events are expected – as they prospectively will (Rusca, 2024; Sherwood et al., 2024). In other words, the approach that may pay off in the medium-long term is the one that integrates proactive protection (like shielding and greening) with considerate design (e.g. thermal efficiency in buildings and infrastructure) and direct, concrete involvement of exposed communities (e.g. communication, school programs, information in public buildings and spaces).
In Paris, architects have suggested removing multiple traffic lanes to create space for bike lanes and wider pedestrian walkways, which involves replacing the existing dark asphalt with a lighter-coloured pavement that can reflect sunlight, capturing and recycling rainwater and planting thousands of trees in open soil conducive to the mingling of tree roots, thus reducing the sidewalk temperature by over 4°C (Goodell, 2023).
Several cities that hit temperatures well over 40°C locally concentrate near one another in what we may define as “temperature hotspots” (Figure 3). This feature is evident, for instance, in the Middle East, where Iran, Iraq, Syria and the United Arab Emirates broadly surround the Gulf of Aqaba. Another seeming “hotspot” occurs in the southwestern USA, straddling California, Nevada and Arizona near the northern termination of the Gulf of California. Very hot or even record-high temperatures in dry areas are certainly expected and documented (McCarthy et al., 2010; Hibbard et al., 2017; IPCC, 2018). However, while such “hotspots” may fall near semi-arid or sub-tropical climate swaths, we notice the seeming nexus among local climate, landscape and environmental features that may play a role in causing such concentrations, where geographic location, terrain and proximity to an engulfed water space appear to coexist. Although these “hotspots” may also result from the uneven spatial density or inconsistent data distribution, we remark that an environmental and landscape set of parameters may intrinsically facilitate such a pattern.
The measures undertaken by cities worldwide reflect the importance of collaborative efforts in tackling the challenges of rising temperatures, mainly heat extremes, including heatwaves, as anthropogenic climate change has already increased their frequency and severity (IPCC, 2023). Additionally, complex phenomena and equally demanding measures to be deployed may elicit societal resistance (Nature Sustainability, 2024). Within the inherent complexities and the range of vulnerabilities involved, this article aims to serve as a call to action, highlighting the need for proactive strategies and shared policies to address the environmental and health problems associated with urban heat in the summer months – ever hotter and longer. We maintain that the way ahead is to act; there is no further option.
4.2 Solutions bring chances, results and complexities
Despite promising, coordinated interaction among city councils hailing from diverse metropolitan areas worldwide, country differences can remain stark throughout cultures, languages, political contexts and openness to international policy exchange (or its exact contrary) – among many other factors. As such, the C40 initiative can also be seen as an invaluable vanguard that, while having so far achieved tangible results and having laid a set of standards, highlights the exceptional efforts still to be pursued and propagated globally.
Additionally, while the qualities of the C40 consortium foster constructive and intelligent efforts, the various solutions being adopted have limitations, depending on multiple factors. To begin with, temperatures reach new maxima in various global locations, due to climate dynamics and complexities across the Earth system that, of course, go far beyond what can be planned or contained solely by resorting to municipal measures, clever and effective as these may be. Although well-coordinated, they operate at the local and urban scales, targeting the protection of local residents, while the overarching cause remains global and ultimately depends on physical mechanisms that need to be addressed by international institutions and intergovernmental initiatives. In some instances, the latter ones are lagging behind, while in other instances, they show promising advancement; therefore, coordinated city efforts to contain adverse climate effects at the local scale should align with broader efforts, possibly by fostering forms of institutional interaction with initiatives ranging from the IPCC to the Conference of the Parties (COP).
Second, sensible adaptation strategies can achieve tangible results, but their deployment throughout large urban agglomerations can be unevenly distributed (as they are, not merely among countries but also within given large cities) and can reflect development, the quality of the built environment, and the overall degree of investment. These measures are thus influenced by the resulting spatial urban and infrastructural patterns, which can be positively altered and partially adapted, but only if a long-term vision is available from city managers and substantial allocations are made from city budgets. Therefore, for strategies such as green roofing and tree planting to be feasible, they first need to be compatible with the structural integrity of the addressed buildings, the availability of water circulation/recycling systems to allow sustainability and the size of the area of interest needs to be compatible with or useful to the chosen neighbourhood/city section.
Furthermore, two very physical constraints, such as landscape and time, can locally favour or impede solutions. While being of a very different sort, the natural landscape can locally dictate conditions that lead to local-to-regional climate alterations or mitigate their effects, and the time necessary to pursue effective urban redesign may significantly elapse before policies yield results that citizens can positively reap, while climate patterns continue to fluctuate. The effects influenced by climate alterations, such as accelerating sea-level rise (which can redraw the seascape of coastal megacities) and rising temperature maxima (which impact human health in various forms), affect the Earth in discontinuous patterns and amounts due to numerous planetary-scale complexities, ranging from ocean dynamics to Earth’s gravity and diverse tipping points (IPCC, 2023). Therefore, their repercussions on urban agglomerations vary widely among continents and countries, especially as large megacities straddle broader areas, or even small regions. Therefore, the strategies to be locally adopted can be optimised only as long as they realistically fit within the intrinsic characteristics posed by terrain, time and resources.
Last but not least, many mitigation strategies, such as green roofs, reflective pavements and urban forestry, are often applied on a small scale or in affluent areas only, leaving many parts of cities vulnerable. For instance, this is often the case for urban sections inhabited by underprivileged communities (Zahnow et al., 2025), glaringly showing that while current practices are designed to be effective, their limited deployment and use reduce overall impact. Lack of actual access to mitigation can also depend on the urban landscape, like the location of residential areas in higher relief sections, which may be inherently safer from the effects of the urban heat island (UHI), or the proximity to water bodies or the coastline. In other words, landscape matters from a spatial viewpoint, but it reverberates on the overall urban structure and, therefore, on where measures against urban heat occur first – if indirectly. Research suggests that there is ample room to investigate such uncertainties and their complex urban and societal repercussions (Dow et al., 2025).
4.3 Heatwaves continue in 2024 and 2025
This article focused primarily on the summer of 2023 and its temperature extremes within the warmest decade (2014–2023) ever recorded – hitting the top-ten world average temperatures – with 2023 first and 2016 s, respectively (NOAA, 2024). However, after the July 2023 peak, all months until June 2024 have been the hottest on record (NOAA, 2024). Namely, it was the thirteenth consecutive month to set a temperature record, 12 of which reached 1.5°C above pre-industrial levels, according to new data released by the EU Copernicus Climate Change Service (UN News, 2024). These extremes were, of course, recorded worldwide, with temperatures well above average over eastern Canada, the western USA and Mexico, Brazil, Northern Siberia, the Middle East, Northern Africa and western Antarctica (Copernicus, 2024b). The compounded impact of human-caused climate change and El Niño has contributed to these record highs (The Straits Times, 2024), as the WMO reports predicted (WMO, 2023b, 2023c; WMO, 2024). In June and July 2024 and 2025, heatwaves impacted the global economy and daily life. For instance, record temperatures in the Death Valley and Las Vegas, heat-induced wildfires in California (USA) and extreme heat-related droughts in Mexico and Central America resulted in deaths (Pinto et al., 2024). During the Hajj pilgrimage in Saudi Arabia, over 1,000 people collapsed and died due to extreme temperatures (China Daily Global, 2024). Climate change intensifies heatwaves, making them stronger and more frequent (Climate Central, 2024; Giguere et al., 2025; Martinez-Villalobos et al., 2025). Among many manifestations, the recent, devastating wildfires that occurred across the southern state of California (USA) in early 2025 are a very grim landmark (UN News, 2025).
A stringent question arises: Are we on the path to experiencing more extreme temperatures and heatwaves from 2025 onward? The 1.5°C warming threshold, a critical point in the Paris Climate Agreement, is an average temperature change over 30 years designed to smooth the impact of natural year-to-year fluctuations. The Earth has only surpassed this threshold for a year (February 2023-January 2024). However, the current trajectory suggests we could hit the 30-year average threshold of 1.5°C within a decade (Figure 4). This trend could trigger more frequent and severe heatwaves, which might ultimately lead toward an “uncharted territory” (Schmidt, 2024), underscoring the urgent need for immediate action to shield human life from the expected consequences.
 The graph shows global temperature trends from 1980 to 2040 with a temperature range from 0 to 2 degrees Celsius. Observed temperature changes since pre-industrial times are shown up to April 2024, when global warming reached 1.28 degrees Celsius. The trend line projects that if the same 30-year warming pattern continues, global warming would reach 1.5 degrees Celsius by May 2033. The background shading represents the I P C C likely estimate and projections, and the data are produced using Copernicus Climate Change Service information for 2024.
Linear trend projection of 30-year (1994–2033) temperatures over the next decade
Source(s): © The Conversation (2024). Based on the Global temperature trend monitor (Link to theconversation.comLink to a PDF of the cited article.), Copernicus Climate Change and Atmosphere Monitoring Services, © EC – Copernicus – ECMWF. CC BY-NC 4.0
The graph shows global temperature trends from 1980 to 2040 with a temperature range from 0 to 2 degrees Celsius. Observed temperature changes since pre-industrial times are shown up to April 2024, when global warming reached 1.28 degrees Celsius. The trend line projects that if the same 30-year warming pattern continues, global warming would reach 1.5 degrees Celsius by May 2033. The background shading represents the I P C C likely estimate and projections, and the data are produced using Copernicus Climate Change Service information for 2024.Linear trend projection of 30-year (1994–2033) temperatures over the next decade
Source(s): © The Conversation (2024). Based on the Global temperature trend monitor (Link to theconversation.comLink to a PDF of the cited article.), Copernicus Climate Change and Atmosphere Monitoring Services, © EC – Copernicus – ECMWF. CC BY-NC 4.0
5. Conclusions
5.1 The multi-faceted impacts of excess heat
This article has examined the impact of heatwaves and discussed recent trends related to them in Europe. Heatwaves, like any sign of a changing climate affecting a growing population, pose serious threats to human well-being. They bring multiple hazards and combined risks that impact today’s societies, especially in urban areas. Their impacts are influenced by the distribution of people, the shape of the land, and the layout of densely populated regions, such as floodplains and coastlines, as well as the structure of cities at both the building and infrastructure levels. The scale of the issue indicates that immediate action is necessary to tackle the challenges of rising temperatures and heat created by cities, especially in connection with heatwaves. One approach is to adopt green infrastructures, such as water-sensitive urban design and high-albedo surfaces, to mitigate the effects of extreme heat. Promoting public health programs, increasing awareness of health risks and encouraging behavioural changes are key strategies, too. In the USA, for example, efforts include building a database of cooling effectiveness values and city adaptation and mitigation efforts.
Long-term adaptation responses, education and citizen awareness are being advocated in countries like China and India and, by the sheer numbers of their population (1.4 billion), measures that enroot in these countries – overly diverse and large as they are – could spark global, transformative momentum. At the institutional level, cities in these countries exhibit and plan a range of adaptation measures straddling early warning systems, urban greening, water management, resilient infrastructure and public awareness campaigns. Green roofs, for instance, are recognised as a common, effective adaptation and mitigation measure, both affordable and relatively easy to deploy, although only partially efficient in the absence of humidity. We also emphasise the importance of collaborative efforts and proactive strategies to address the environmental and health problems associated with urban heat. The record-breaking temperatures in July 2023 – with 2024 and 2025 at least as relevant – underscore the urgency of these measures to protect vulnerable populations and ensure urban residents’ well-being and quality of life. Additionally, housing quality should be regarded as a right to an acceptable, humanly adequate living standard, promoting belonging rather than inducing seclusion, as highlighted by Oppenheimer (2002) and the UN (2020).
5.2 Limitations and opportunities
For our study, we focused on the C40 cities group and on recent heatwaves, like those that have occurred in 2023, which had critical and, to some extent, transformative impacts. Despite the intrinsic spatial and chronological limitations that our study faces depending on these choices, the paper provides an important addition to the literature on this specific topic and a basis for future research. Naturally, any of the first-order measures discussed in this paper require equally first-order strategies that put the protection of citizens’ lives at the core of policymaking – in other words, of the political actions necessary to enact these measures in the first place. This entails capturing, on the one hand, the deep-seated effects – in part scarcely visible yet profound – that rising temperatures exert directly on the biosphere and human health and, indirectly on the other hand, on the human living environment, both natural and built; in one word, the “concrete-sphere.” While the former make up, after all, the motivation of this work, the latter is its underlying object, as it holds the “core unit” of where human life thrives in cities.
As we have remarked in various instances throughout our work, the efforts undertaken by large urban agglomerations can be remarkably well-thought-out and energetic, and yet, none of them can physically reverse the evolution of the climate alterations that affect current and foreseeable future times, due to the constraints of scale and effect. This constitutes a basic, intrinsic limitation, just as these measures are constrained despite being applied in many meaningful locations across the Earth’s built environment. Also, there is indeed a difference across the spectrum of choices, efforts, budgets and, therefore, results among the large cities that have embraced measures to counter excess heat. This, in turn, makes up a complex, inherent limitation that incorporates – and reverberates – the spatial diversity of practical applications on a further spatially diverse and complex climate dynamics in the Earth system.
As this paper has shown, since global temperatures are likely to continue rising, cities worldwide need to implement adaptive measures to mitigate the impacts of heat. To fully achieve this, further research is needed to explore effective strategies and emerging challenges, as well as to understand their effectiveness, limitations and how to adapt them to maximise results strategically.
5.3 Implications and constructive repercussions
The implications of this work to theory and practice are thus twofold. First, it may assist the scientific community in further exploring this critical topic and identifying the variables that influence it. Second, the paper illustrates how the increasing knowledge and understanding of urban-induced heat and heatwaves can support cities and local governments in taking the needed action. The ultimate scope is to enable them to be more effectively prepared for the multifaceted consequences of warming and heatwaves, which is especially relevant since societies, cities and nature need to coexist and to thrive, emphasised by WEF (2024).
One significant aspect of these implications is the need for cities to adjust their local development plans to manage the challenges posed by increasing temperatures. This includes carefully considering areas where new settlements will be established and ensuring the inclusion of more green areas, such as green roofs, water-sensitive urban design and high-albedo surfaces, which can reduce urban temperatures and mitigate heatwave risks in the long term. The findings of this article emphasise the importance of local governments and policymakers making necessary adjustments to urban planning, not only to improve resilience against rising temperatures but also to enhance the quality of life for urban populations, especially to protect their health. If left unattended, high urban temperatures are likely to lead to a wide range of health problems, which will be especially dangerous to vulnerable groups such as the elderly, small children, pregnant women and people with cardiovascular diseases.
These actions are not merely about mitigating immediate threats but also about fostering long-term societal changes that bridge the gap between climate adaptation and urban development. Through the incorporation of these strategies into urban development, cities can reduce the impact of extreme temperatures and propagate sustainability throughout both their urban and human landscapes (Figure 5). The escalating pattern of record high temperatures in urban areas triggers a cascade of interconnected impacts, from the aggravation of air pollution and increased health risks during summer heat to broader public health concerns and negative effects on community well-being and outdoor activities. These local manifestations of heat stress reflect deeper climate change implications, emphasizing the global dimension of the problem and the urgent need for collaborative efforts and a coordinated global response. Together, these elements underscore the study’s central message: addressing the compounded environmental and health challenges of extreme urban heat requires a comprehensive call for action that integrates mitigation, adaptation and resilience strategies at multiple scales.
 The diagram presents interconnected boxes showing how increasing temperatures lead to various consequences and responses. The sequence starts with record high temperatures leading to air pollution aggravation and health risks in summer heat. It continues with impacts on outdoor activities, community well-being, and public health concerns. The lower sequence connects climate change implications, global response, and collaborative efforts. The diagram ends with the phrase call for action, emphasising the need for joint initiatives to address climate-related challenges.
The sketch of the trigger effect due to record-high temperatures in urban areas illustrates a cascade of interconnected impacts, ranging from environmental and health risks to broader public health issues affecting community well-being
Note(s): Local manifestations of heat stress respond to deeper, global climate change mechanisms, highlighting the critical need for collaborative efforts and coordinated responses
Source(s): Figure by the authors
The diagram presents interconnected boxes showing how increasing temperatures lead to various consequences and responses. The sequence starts with record high temperatures leading to air pollution aggravation and health risks in summer heat. It continues with impacts on outdoor activities, community well-being, and public health concerns. The lower sequence connects climate change implications, global response, and collaborative efforts. The diagram ends with the phrase call for action, emphasising the need for joint initiatives to address climate-related challenges.The sketch of the trigger effect due to record-high temperatures in urban areas illustrates a cascade of interconnected impacts, ranging from environmental and health risks to broader public health issues affecting community well-being
Note(s): Local manifestations of heat stress respond to deeper, global climate change mechanisms, highlighting the critical need for collaborative efforts and coordinated responses
Source(s): Figure by the authors
5.4 The road ahead
In perspective, this work also recommends using the remarkable effects of 2023’s heatwaves as a cornerstone to shed light on adaptation strategies being adopted, how and where these can be effective and what conditions apparently prevent them from being so. After all, the summer of 2024 and the early summer of 2025 proved no different from the heatwave episodes of 2023, so there is no shortage of public concern; heat, its occurrences worldwide and its effects on human health are by now on daily news.
One key area is the evaluation of the UHI) reduction techniques, such as green roofs, cool/reflective pavements and expanded tree canopies. Comparative studies across different climate regions can identify best practices for maximizing cooling benefits. Another systemic fragility that needs monitoring and exploration resides in the socio-economic equity of heat resilience initiatives, since evidence already highlights that marginalised communities worldwide have scarcer access to cooling infrastructures and measures. Additionally, the long-term effectiveness of policy interventions, such as heat action plans and building codes, requires deeper analysis to assess scalability and enforcement. In complex, multi-hazard scenarios that require monitoring and mitigating the effects of diverse threats on living contexts, these strategies need to jointly account and carefully plan for multiple stressors and accrued vulnerabilities affecting the human living environment. In this context, infrastructures are strained by rising, sustained temperatures and peaks in ways not yet fully accounted for and need broad, long-term rethinking (First Street Foundation, 2022).
Contemporary and prospective innovations, including those based on artificial intelligence/machine learning architectures, that in part can help to streamline heat mapping and smart cooling systems, also warrant investigation for their potential in urban climate adaptation. Furthermore, cross-disciplinary research combining urban planning, public health and natural/environmental sciences could provide holistic insight into heat-related mortality and productivity losses. Finally, studies on behavioural adaptation – how residents modify their daily routines in response to extreme heat – could further inform community-based resilience programs and help to implement policies in this field. By addressing these gaps, future research can support cities in developing sustainable, equitable and adaptive solutions to rising temperatures. Contrary to common perception, evidence suggests that communities and societies are eager to adopt protective measures against the adverse effects of heat, provided they are duly informed.
Since making good decisions aims to shape the future within the unavoidable limits of complexities and uncertainties on how to create a safe one, there is a clear need for measures that adjust to unprecedented future heat. At the societal level, changes in behaviours and policies may bring resistance in response to complex issues. However, it is important to emphasise that taking action is crucial without falling back on ineffective “business-as-usual” methods. This may require an innovative, collaborative effort from researchers and practitioners to expand their focus beyond urban climate research into policy and society, where more direct and possibly bolder participation is necessary (Sharma, 2025).
Acknowledgements
The authors express their gratitude for the opportunity to enhance their paper based on the editor and reviewers’ comments, which significantly improve its quality.
This paper is part of the “100 papers to accelerate climate change mitigation and adaptation” initiative, led by the International Climate Change Research and Information Programme (ICCIRP), HAW Hamburg, Germany.
This work acknowledges the support of the Foundation for Science and Technology within the framework of the UID/04292/MARE – Marine and Environmental Sciences Centre.
Authors’ contributions
Conceptualisation, methodology and formal analysis by Walter Leal Filho, Maria Alzira Pimenta Dinis, Umberto Fracassi and Gustavo J. Nagy. Software, preparation and writing of original and draft by Walter Leal Filho, Maria Alzira Pimenta Dinis, Umberto Fracassi and Gustavo J. Nagy. Writing, review and editing by Walter Leal Filho, Maria Alzira Pimenta Dinis, Umberto Fracassi and Gustavo J. Nagy. Visualisation by Walter Leal Filho, Maria Alzira Pimenta Dinis, Umberto Fracassi and Gustavo J. Nagy. Supervision by Walter Leal Filho, Maria Alzira Pimenta Dinis, Umberto Fracassi and Gustavo J. Nagy.

