


The purpose of this paper is to present a framework for estimating the costs of adaptation to climate change impacts on ecosystems.
While existing studies on costing adaptation base themselves on either the financial flows on conservation or the costs of specific adaptation measures at the global level, the methodology presented here takes into account the impacts on ecosystems, the identification of vulnerable areas, and adaptation options at a more regional level.
The framework is then applied to forest ecosystems in India. The authors find that the total adaptation costs for forest ecosystems in India until 2085 are in the range of $1.34‐2.32 billion.
The key contribution of this paper is the proposal that for any robust estimation of adaptation costs, people should take into account the regional level impacts and the multiple adaptation options linked to those impacts.
1 Introduction
By the end of the twenty‐first century, climate change impacts are expected to be the primary cause for biodiversity loss and changes in ecosystem services on a global scale (MEA, 2005; Pimm and Raven, 2000; Thomas et al., 2004). Maintaining the resilience of natural ecosystems enhances their stability, which is very important under the threat of shifting ecosystems to less desirable states as a result of climate change (Scheffer et al., 2001; Prato, 2008). The Intergovernmental Panel for Climate Change (IPCC) predicts that approximately 20‐30 percent of the known plant and animal species will face an increased risk of extinction if the global temperatures increase in a range of 1.5°C‐2.5°C (IPCC, 2007). Fischlin et al. (2007) estimate that a 3°C warming would transform about one‐fifth the world's ecosystems. Mitigation policies are already in place to reduce climate change impacts, but effects of mitigation policies on biophysical systems will not be globally noticeable until the middle twenty‐first century (IPCC, 2007). Short‐term impacts are expected even with strong mitigation efforts. Therefore, adaptation is the only way to deal with the unavoidable impacts of climate change (Stern et al., 2006), although mitigation is of course still necessary in order to reduce future costs of adaptation measures (IPCC, 2007).
Adaptation can be defined as the “adjustment in natural or human systems in response to actual or expected climatic stimuli or their effects, which moderates harm or exploits beneficial opportunities” (IPCC, 2007). It can be further distinguished as anticipatory, autonomous or planned adaptation. In the case of natural ecosystems[1], human planned adaptation is necessary to avoid the projected negative impacts on biodiversity (Fischlin et al., 2007). When designing adaptation measures, it is important to bear in mind the promotion of win‐win strategies and the avoidance of maladaptation or unsustainable adaptation. For a review on adaptation and mitigation options in relation to the potential impacts on biodiversity (Paterson et al., 2008).
Adaptation in natural ecosystems requires nature conservation efforts that extend the current approach of fixed protected areas (Stern et al., 2006). In their review, Stern et al. propose that conservation efforts are required to operate at the landscape level, with the management of larger areas to better accommodate species movement. The TEEB (2009) climate report promotes investment in “ecological infrastructure” as a way to adapt to climate impacts. Ecological infrastructure refers both to natural and man‐made ecosystems. Heller and Zavaleta (2009) review in a recent work the literature addressing biodiversity management and adaptation in the face of climate change. Among the most important measures, they emphasize on the increase in habitat connectivity, the integration of climate change into planning exercises and the mitigation of other threats to ecosystems (Heller and Zavaleta, 2009).
The range of adaptation options that can help in reducing climate change impacts on ecosystems and biodiversity have been studied in detail by natural scientists (Heller and Zavaleta, 2009). However, assessing their costs and effectiveness for policy‐making is still an under‐developed field. Currently, countries lack estimates of the costs needed to adapt to climate change impacts. This is mainly due to the limited number of studies on costing specific adaptation measures and the problems associated with putting an economic value to biodiversity and ecosystems (Parry et al., 2009). The contribution of this paper is to provide a framework for estimating the costs of adaptation specific to forest ecosystems and to show how it can be applied, through the case of forest ecosystems in India. Subsequently, research gaps are identified in order to improve current estimates of adaptation costs, especially in developing countries.
The structure of the paper is as follows: Section 2 reviews previous cost estimates for adaptation in natural ecosystems; Section 3 presents the new framework for costing adaptation; Section 4 develops this framework to forest adaptation in India; and finally, Section 5 closes with some concluding remarks and recommendations for future analysis.
2 Previous estimates on ecosystem adaptation costs
The IPCC defines adaptation costs as the “costs of planning, preparing for, facilitating, and implementing adaptation measures, including transition costs” (IPCC, 2007). The literature on adaptation costs and benefits is limited and fragmented and is not focused on ecosystems (IPCC, 2007; Stern et al., 2006). Moreover, there is an emphasis on the USA and other OECD countries, with only a few studies for developing countries. Improving the knowledge of the costs of climate change adaptation will allow policy‐makers to consider optimal strategies for implementing adaptation policies (IPCC, 2007). Estimates of the costs of adaptation for ecosystems are scarce and very recent. From the ecological and conservation perspective, adaptation options for ecosystems are well‐known (Heller and Zavaleta, 2009), but current estimates of adaptation costs are often based on one single adaptation measure such as increasing protected areas (Berry, 2009). Existing studies are very case specific and there has been hardly any attempt to provide a wider costing framework for adaptation, especially at the national level. Callaway et al. (2007) and Martin‐Ortega (2011) are two exceptions, but these studies refer to freshwater systems and are difficult to generalize to other ecosystems.
Two types of approaches have been developed to estimate adaptation costs: financial flows on conservation and costs of specific adaptation measures. The United Nations Framework Convention on Climate Change (UNFCCC) has conducted an overview of current investment and financial flows by source of financing. According to that, between 1991 and 2000, the Global Environmental Facility (GEF) provided about $1.1 billion in grants and leveraged an additional $2.5 billion in co‐financing biodiversity‐related projects (UNFCCC, 2007). Most of these grants were used to support protected areas, covering 226 million hectares in 86 countries (IPCC, 2007). James et al. (2001) reported that in the mid‐1990s, an average of $6.8 billion/year was spent on global protected areas, with about 89 percent of that amount spent in developed countries.
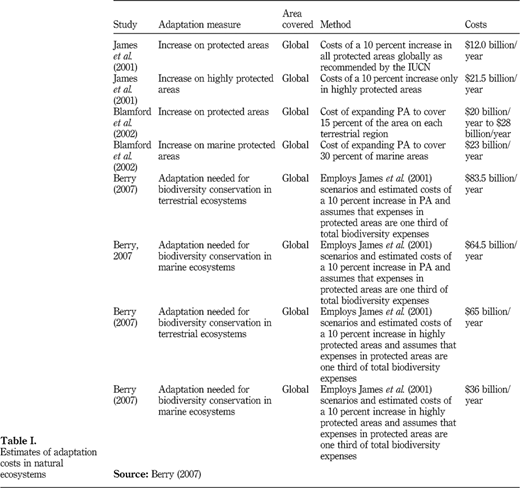
The UNFCCC study was the first one providing an estimate of the costs of adaptation for natural ecosystems (Berry, 2007, 2009). Their estimate bases on the James et al. (2001) study, who calculated the investment and financial flows needed to protect natural ecosystems from current threats. To do this, the authors followed the International Union for the Conservation of Nature (IUCN) recommendations of how much additional land needs to be set aside as biodiversity protected areas. This recommended expansion was set at additional 10 percent of existing protected areas, but was not set based on the additional protection needs that climate change might require. From this, the improved protection is achieved with an annual increase in expenditures of $12 billion to $22 billion (James et al., 2001). Further, Berry (2007) adapted James et al. (2001) estimates by scaling up values, assuming that expenses in protected areas are one third of total biodiversity expenses. Following this assumption, total expenses on biodiversity adaptation amounted to $64.5 billion/year under the scenario with mitigation and $36 billion/year under the scenario with adaptation (Berry, 2007). The World Bank (2009) has recently launched the first results of a global study on the costs of adaptation in developing countries from 2010 to 2050. For all the sectors including coastal zones, extreme weather events, water, infrastructure, agriculture, health and fisheries, they estimate adaptation costs to be in the range of $75 billion/year to $100 billion/year. The adaptation needs in the forestry sector are set by estimating the expected change in timber production under climate change. As a result, no planned adaptation was recommended by this study, as the harvest is, overall, expected to increase by 6 percent. But looking only at forest market revenues can underestimate the adaptation needs in both natural and planted forests as they ignore the impacts on non‐market ecosystem services as well as impacts on the local communities that are forest dependent. The current work also presents evidence of the negative impacts affecting forest ecosystems in India and shows how these impacts actually result in high adaptation costs.
Table I summarizes up to date studies that deal with global financial investments on adaptation for biodiversity and natural ecosystems. It has information on the adaptation measure, scope of the study, the method used and the estimated adaptation costs. These costs range from $12 billion/year to $28 billion/year when considering the expansion of protected areas as the adaptation measure, and between $65 billion/year and $83.5 billion/year when the expansion of protected areas is considered to be only one third of the total required adaptation measures. Some important shortcomings of these approaches are that:
they provide global estimates, whereas regional estimates would be more appropriate in the case of adaptation (Callaway, 2004);
they estimate adaptation costs based only on one adaptation measure; and
the amount of adaptation needed does not depend on the level of climate impacts.
The method proposed in this paper aims to overcome these important issues.
There are, however, some regional studies calculating the cost of specific adaptation measures apart from the global financial estimates of adaptation. Examples are migration corridors in Kenya (Ferraro and Kiss, 2002), coastal reforestation in Croatia (Pagiola et al., 2004) or conservation of tropical forests in Costa Rica (Ferraro and Kiss, 2000). Reviewing this literature suggests that there is need for a framework of costing ecosystem adaptation that takes into account more refinements such as identifying where adaptation actions are needed (vulnerable regions); identifying the positive or negative direction of the impacts on each area; linking adaptation options to specific impacts; and valuing the costs of these specific and feasible adaptation requirements. In pursuance of that, in the next section a framework aimed at filling these gaps is presented.
3 Framework for estimating ecosystem adaptation costs
The approach is divided in six steps: first, the identification of the climatic impact; second, and based on the impacts, the identification of the vulnerable areas; third, the identification and selection of the adaptation options; fourth, the assessment of the unitary costs of the adaptation measures; fifth, a discussion on the possible indirect impacts related to that adaptation measure and impact; and finally, the total cost of the adaptation measure. Each step is described below, while the next section presents the specific case of forests in India.
1. Quantification of CC direct impacts
The first step is to identify and quantify in physical terms the relevant impacts of climate change on the country's ecosystems. Impacts should be quantified based on the available scientific knowledge. Wherever geographically disaggregated data is available, it should be preferred. Uncertainty over the perceived impacts of climate change can be reduced with the use of more than one climate projection model. Previously it has been difficult to establish projected scenarios for natural ecosystems and other sectors (The World Bank, 2009). Timeframe for adaptation is usually 2030‐2050 as climatic impacts become more uncertain afterwards. However, in the case of natural ecosystems it is not uncommon to have predictions on long‐term impacts (Ravindranath et al., 2006), where impacts on forest ecosystems are in effect positive in the short term but negative in the longer term. For this reason, authors argue that selecting the relevant timeframe subject to the specific impacts under assessment and the reliability and accuracy of the available biophysical data is the way to move forward[2].
Imagine a situation where there are impacts (Ii) affecting ecosystems in vulnerable areas. The baseline scenario is the current situation (current impact) and is identified as I0 In a medium timeframe and with no adaptation, climate change is projected to change the magnitude of the impact to I1. The magnitude of an impact will be the difference between the projected impact (I1) and the baseline scenario (I0) for all the vulnerable areas (va). Thus, an impact Ii can be quantified as: Equation 1 where the baseline scenario I0 could be the current scenario or a projected baseline without climate change.
2. Identification of the vulnerable areas
Climate change does not affect all the regions with the same intensity. It could be the case that a particular impact is neutral at the sub regional level while it is significant at the regional level. In order to avoid this problem, the regions in which an impact has significant effects can be identified. These areas need to be selected for each specific impact identified in the previous step. On a sub‐national basis (e.g. provinces, ecological regions, biomes, etc.), different criteria can be used in order to select climate vulnerable areas. Whether climate impacts in ecosystems are negative at this level can be addressed based on a set of indicators such as the impacts on biodiversity or productivity for local communities.
Identification of adaptation options
This step deals with the identification of the relevant adaptation option specific to the impact and the vulnerable area (adaptation assessment). IPCC states that adaptation assessment consists of identifying options to adapt to climate change and evaluating them in terms of criteria such as availability, benefits, costs, effectiveness, efficiency and feasibility (IPCC, 2007). Building up on these guidelines, the authors propose four criteria for the selection of adaptation measures.
a. Relevance
The adaptation option should be relevant for the impact. This means that the adaptation option has been already recommended or applied to the selected impact. For this step one can rely on the existing literature on adaptation policies and recommendations, as well as on the countries' specific policies and plans.
b. Effectiveness
This is a measure of the capacity of an adaptation action to achieve its intended objectives (Adger et al., 2005). How much adaptation units are required to avoid the impact to happen or reduce it to the minimum? With the magnitude of the impact identified, a rule that gives us the magnitude of the adaptation option to be implemented is needed. If the adaptation option recovers the system to the status quo scenario (with current impact) then, the efficiency of the adaptation measure will be one. This measure of efficiency will be employed only where relevant information is available or some imputation can be made reasonably. For each impact, authors have identified several adaptation measures (a). Each adaptation measure has a different effectiveness, in reducing the impact, leading to a reduction in the magnitude of the impact. Thus, with the help of an adaptation option, the expected impact will change from I1 to I2, where I1>I2. The effectiveness of a given adaptation option (Ea) is the part of the expected impact with climate change (I1) that is avoided by the adaptation option I1−I2 for each vulnerable area: Equation 2 when the adaptation option completely avoids the impact of climate change (I2=I0), the effectiveness is equal to 1 and the expected impact with adaptation is equal to zero.
For each impact, one should select the set of adaptation measures that minimize the expected impact with climate change. However, the effectiveness of adaptation options is not always known, and the example presented in this paper shows a way to deal with this situation.
In the absence of information on effectiveness, it is not possible to implement optimal adaptation policies. Therefore, adaptation levels are defined based on the needs to restore pre‐climate impact levels. This is also the approach followed by the World Bank (2009) adaptation costs study and what is illustrated in the sections ahead.
c. Scale of action
Refers to the magnitude of the adaptation option. There must be an estimate of the magnitude of the impact that the adaptation options needs to avoid. The World Bank (2009) study on adaptation costs establishes proxies to define the level of welfare in which to base adaptation costs, identifying fisheries revenues in the fisheries sector, level of income from ecosystem services, or forestry market revenues. This way, the level of adaptation covers a target established under economic criteria. However, the economic costs and benefits of climate change in natural ecosystems are under‐assessed and there is a high level of uncertainty on the economic impacts of climate change. The special TEEB report in climate change states that this uncertainty can be addressed using the precautionary principle. This means to adopt a strategy that is sustainable and aims at protecting both human and natural habitats (TEEB, 2009). In this paper, the authors propose that targets for adaptation can be set based on physical units, considering conservation and sustainable development criteria. The main reason for this is that, due to the existing evidence on the impacts of climate change in biodiversity and ecosystems, they can be identified and compared to non‐climate baseline levels[3]. Starting from the estimated impact of climate change based on climatic models, and considering the subsequent uncertainty in predictions, adaptation levels can be defined as the amount of adaptation needed to reduce the impact from the baseline.
The preferred level of adaptation would be the result of maximizing the difference between the adaptation benefits and the adaptation costs. Economic decision rules include cost‐benefit analysis (CBA) and cost‐effective analysis (CEA). CBA shows whether the total economic benefits of an adaptation measure exceed the costs (Parry et al., 2009). A good adaptation policy from the financial point of view will be one where the aggregate benefits exceed the aggregate costs, including non‐market values. Under uncertainty in the total environmental costs and benefits of adaptation policies, CEA is the preferred tool, measuring the benefits from adaptation in physical terms rather than in monetary units. The objective of CEA is to identify the maximum level of adaptation given budget constraints or to identify the lowest costs of achieving a given level of a physical target (Parry et al., 2009)[4]. A cost‐effective rule for adaptation options at time t can be presented as the difference between adaptation costs (Costa) and the costs of climate change (CostI) in relation to the avoided effects of climate change through adaptation (I2−I1): Equation 3
d. Feasibility
Refers to the real possibility of applying the adaptation option. This is a crucial criteria where both the adequacy to implement the adaptation measures in the vulnerable areas and the feasibility itself of the adaptation measure must be examined. One way to do this is to review existing policies in the region and look for evidence from the field on the feasibility of specific actions. Another possibility is to conduct stakeholder analysis.
3. Identification of per unit cost of the adaptation measure
Costs of adaptation measures vary in time and in spatial scale. Based on the existing literature and national expenses on conservation, afforestation, etc. per unit costs can be identified for each adaptation measure. Per unit costs must be in the form of cost per magnitude per year, where the magnitude should be in the same units as on the adaptation option. Naidoo and Ricketts (2006) differentiate several conservation costs that can be identified when measuring adaptation. These are:
Acquisition costs. Costs of acquiring property rights of a land area.
Management costs. Costs associated with the conservation programs developed in a protected area.
Damage costs. Costs associated with damages to economic activities arising from conservation programs.
Transaction costs. Costs of transfer property rights.
Opportunity costs. Per unit costs of the adaptation measure should optimally account at least for acquisition and management costs.
4. Identification of indirect impacts
Indirect impacts and interactions with other sectors such as agriculture, water, as well as human livelihoods need to be considered. Since it is difficult to account for these interactions at this point, the authors are not including these indirect impacts into the framework on a quantitative basis. However, interactions with other sectors can be important and further development of this framework should include them. One example is deforestation in Orissa (India) which has severely affected the role of women as forest gatherers with implications for their livelihoods (EEA, 2008).
5. Total costs
The final step consists of the aggregation of the costs of adaptation measures for all the vulnerable areas and adaptation measures passing the above four criteria. For this, first, the cost of each adaptation measure can be calculated using the unitary cost of the measure and the magnitude of adaptation required. Second, the aggregation of the adaptation costs per impact needs to be aggregated, and finally the total costs of all the impacts. Cost estimates should be ideally provided in the form of intervals, i.e. some lower and upper bounds could be presented if including different interest rates (Arrow, 1995), adaptation scenarios or climate scenarios (IPCC).
4 Estimating forest adaptation costs in India
Costing adaptation at this level is crucial for countries to plan their climate policy under the international agreements. India constitutes a good case study given its vulnerability to climate change and the importance of forests. Forests cover about 19.4 percent of the country's surface in India, and have a crucial role in energy supply by providing almost 40 percent of the country energy needs, reaching up to 80 percent in rural areas (Government of India, 2008). The authors will adapt the framework to the specific case of Indian forests and will discuss the main problems and difficulties in the process of doing so[5].
4.1 Quantification of climate change direct impacts
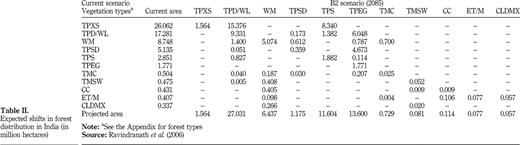
The main impact affecting forest ecosystems in India is the expected shift between forest types (Joshi et al., 2006; Murthy et al., 2010; Ravindranath et al., 2006). This shift will affect forests in terms of their productivity and dominant species, as well as the biodiversity and human livelihoods dependent on each forest type. Ravindranath et al. (2006) identify what forest types are more vulnerable to decrease under the A2 and B2 climate scenarios. Following the study of Ravindranath et al. (2006), the authors identify the forest areas that will be impacted the most by climate change in terms of change in forest type for B2 scenario and year 2085[6]. Based on the grid size and data used in the BIOME4[7] model, it is very difficult to calculate the exact areas for each of the vegetation types. One cannot assume that a certain vegetation type will cover the total area of a grid, a part of which may be located inside. So as a proxy measure the authors have divided the total forestland in India, 64 million hectares (Ravindranath et al., 2006), proportionately based on the number of grid points into the various vegetation types. From there the size of the areas that will shift in either direction is estimated based on Ravindranath et al. (2006) projections of forest shifts in India. Table II presents the magnitude of the change and the projected area of future biomes. Like this, for example, tropical xerophytic shrubland (TPXS) forests expand in 26.06 million hectares and in 2085, under B2 scenario, are projected to cover only 1.56 million hectares. One example illustrates how Table II reads. Warm mixed (WM) forests are spread across India covering roughly 8.75 million hectares of land. From these current hectares, 1.4 million hectares will shift to tropical deciduous woodland (TPD/WL), 5.074 million hectares will remain WM, 0.61 million hectares will shift to tropical semi deciduous forest (TPSD), 0.79 million hectares will shift to tropical evergreen forest (TPEG), and 0.7 million hectares will change into temperate conifer forests (TMC).
4.2 Identification of the vulnerable areas
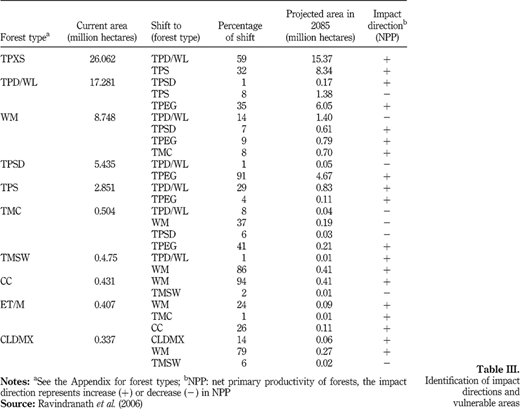
Once the magnitude of an impact is quantified, such shifts in forest distribution can be positive or negative. For this reason, authors have identified criteria for selecting the vulnerable areas and continue the analysis by focusing only on these. There might be changes in forest types, which can benefit biodiversity or human livelihoods, but on the other hand, some changes might be negative such as the loss of net primary productivity (NPP). Authors therefore have adopted one criterion to identify the vulnerable areas: the NPP. NPP is the production of biomass from atmospheric carbon dioxide. It is important, as it also constitutes an indicator of the forest mitigation potential (Ravindranath et al., 2010). Forest biomes can be ranked in terms of NPP, depending on the annual growth of biomass. Ravindranath et al. (2006) provide in their study information about the NPP for the BIOME4 forests. Based on the information in Table II and on the productivity of each forest types depicted by Ravindranath et al. (2006), Table III summarizes the current and predicted area of each forest type, indicating whether it is a positive shift (expected increase in productivity) or a negative shift (expected decrease in productivity). This is named as the impact direction and is shown in the last column of Table III. As a result, the vulnerable areas where the impact of climate change is negative in terms of productivity are identified. Next calculations will be based on these areas. However, authors acknowledge that other criteria such as biodiversity richness or the impact on human livelihoods should be also considered when identifying the direction of the impacts. However, the authors present this approach as a first approximation and further work can be developed on these lines.
4.3 Identification of adaptation options
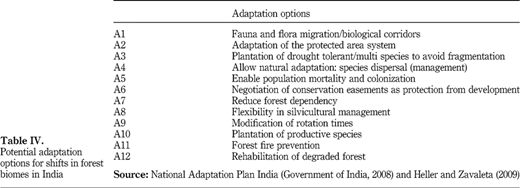
A literature review on ecosystems adaptation based on international assessments (CBD, 2009), research papers (Paterson et al., 2008; Heller and Zavaleta, 2009), and Indian national adaptation plans (Government of India, 2008) was conducted in order to identify the potential adaptation options for the projected shifts in forest distribution. Murthy et al. (2010) provide an extensive illustration of adaptation policies in Indian forests together with potential barriers. For the identified adaptation measures the set of criteria described in the framework is run in order to determine which adaptation options can be applied in the field. The relevant adaptation measures for Indian forests are summarized in Table IV.
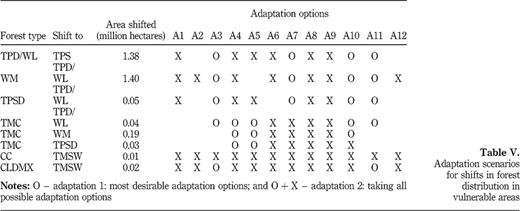
Because the effectiveness of a measure to reduce sensitivity to a climatic impact also depends on future climate conditions (Adger et al., 2005), the measurement of the effectiveness indicators became very difficult and it was not possible to obtain sufficient data. Hence, for methodological purposes, the authors assume that adaptation measures will be applied in all the areas identified as vulnerable. The scale of action is based on the area that is expected to shift towards lower productivity forests. Finally, the feasibility of the adaptation options is evaluated by means of forest expert opinion, depending on the type of shift expected. Moreover, given limitations on data availability the authors also make some assumptions on the unitary costs of the adaptation options.
Two scenarios for adaptation option choices are selected: adaptations 1 and 2 scenarios. In the scenario “adaptation 1”, based on the negative direction of the shift in forest types, the most necessary measures to address these impacts are chosen, based on expert opinion[8]. In contrast, for the “adaptation 2” scenario all the possible options available from Table IV are chosen. These scenarios in a way reflect the minimum action and the maximum action option sets, respectively. Table V presents the adaptation options considered for each adaptation scenario. As an example, the area under tropical deciduous forests/woodlands (TPD/WL) that is expected to shift towards tropical savannah (TPS) will require adaptation options A3, A7, A10 and A11 as the minimum desirable options (adaptation 1 scenario). Including all desirable options, adaptation 2 scenario for TPD/WL will require implementation of A1, A3, A4, A5, A6, A7, A8, A9, A10 and A11 to all the 1.38 million hectares of vulnerable area.
4.4 Estimation of unitary cost
In order to obtain unitary costs for the adaptation measures and evaluate their feasibility in the country, a review of the Indian national programs on forest management is conducted. From this, the measures whose objectives match with the list of potential adaptation measures have been identified. Costs are selected from the 10th Five Year Plan (2002‐2007)[9] (Government of India, 2002), in order to maintain consistency among the costs for different adaptation options.
From the available programs in the national plan, and with the information on the forest hectares and on the timeframe of the programs, the total costs per hectare can be calculated for each measure. This is done in two steps: first, forestry programs are synthesized according to the region, forest types and costs of policies. Second, policies that clearly match the adaptation options for shifts in forest distribution are selected. The unitary costs for the feasible adaptation options are presented in Table VI. The exchange value of the Indian currency, the rupee, has been updated to year 2011 using the consumer price index, from the World Economic Outlook (WEO) database of the International Monetary Fund (IMF) (WEO, 2011), and then converted to US$ with the exchange rate from the IMF. Capital costs have been converted to present values with a 5 percent discount rate.
4.5 Total costs of adaptation to forest shifts in distribution in India
Finally, the last step is to calculate the total costs for the impacts on forest distribution. Given that there is no information on the effectiveness of the adaptation options, the authors will apply the two scenarios: adaptations 1 and 2 for the selection of adaptation measures. Finally, total costs are calculated by adding the adaptation costs for all the vulnerable area. Table VII presents the results, where the total estimated adaptation costs for changes in forest distributions in India are in the range of $1.34 billion to $2.32 billion[10], for the adaptation scenario 1 and 2, respectively. Note that these figures provide us with the costs of adapting now to the climate change impacts expected in the long term. Murthy et al. (2010) state that adaptation is necessary both in the short and long term to reduce climate change impacts. In our application to Indian forests and in general for natural ecosystems, knowledge on the impacts of climate change are hardly available for the short term. Furthermore, forest ecosystems require a long response time for adaptation (Murthy et al., 2010; Ravindranath, 2007). Authors believe that the results presented here will be helpful in understanding the magnitude of the costs developing countries have to incur for adapting their natural ecosystems to climate change.
5 Concluding remarks
This study provides a framework to estimate adaptation costs for forest ecosystems on a country level basis. Based on the scarce literature about adaptation costs, especially for ecosystems, the authors identify the main gaps and propose a new framework for costing adaptation. The key contribution of the method is that any estimation of adaptation costs should be essentially linked to vulnerability and specific adaptation options. Authors believe that the framework developed here has the potential to be adapted to other natural ecosystems such as wetlands or other wildlife habitats, where climate impacts are well assessed but economic valuation of these impacts and adaptation costs still needs to be further developed. Future research will show whether this method is valid in other areas, geographical scales and ecosystems different from forests.
The functionality of this framework is illustrated with the case of forests in India. Depending on the set of adaptation options selected, our results suggest that total adaptation costs for forest ecosystems in India until 2085 are in the range of $1.34 billion to $2.32 billion. There is, however, scope to improve the present work. One such area of improvement could be to develop some criteria based identification of vulnerable zones and adaptation options. For example, vulnerable forest areas are identified based on a decrease in NPP of forests. However, additional indicators can also be used in order to take into account other sectors such as biodiversity. The approach can also benefit from a spatial approach, where adaptation actions can be planned in the field for the key vulnerable areas, so that costs can be estimated from a bottom‐up GIS based approach. Effectiveness is still a less developed criterion in adaptation policies and more research is needed in order to identify and select those effective adaptation measures. Additionally, another line for improvement is the inclusion of stakeholders into the analysis where the affected population and beneficiaries from adaptation actions are participating into de process and the costs and benefits are fairly distributed. More research on these lines will help to get more accurate cost estimates in the future.



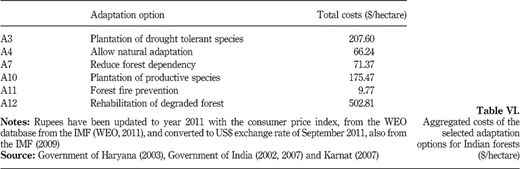
Aggregated costs of the selected adaptation options for Indian forests ($/hectare)
Aggregated costs of the selected adaptation options for Indian forests ($/hectare)
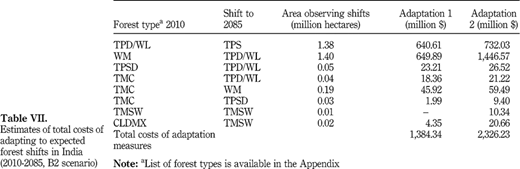
Estimates of total costs of adapting to expected forest shifts in India (2010‐2085, B2 scenario)
Estimates of total costs of adapting to expected forest shifts in India (2010‐2085, B2 scenario)
The authors would like to give special thanks to Arabinda Mishra for his ideas and comments during the writing of this paper. The authors would also like to thank Anil Markandya for his guidance throughout the work and the anonymous referees for their very useful comments. Authors solely are responsible for the content of this article.
Notes
With “natural ecosystems” authors refer to non man‐made habitats, including for example peatlands, wetlands, forests, etc.
The relevant timeframe refers to the appropriate framework for the biophysical projection of impacts. While some impacts can be projected on a shorter timeframe, vegetation models usually refer to a 80‐100 year scope.
This is a similar approach to the European Trading Scheme (ETS) system, where a reduction target is set in physical terms (CO2 equivalent concentration levels), to which the markets need to adjust.
If zero impact is unreachable with adaptation, then it is necessary to define how much residual damage society can assume. This will determine how much prevention and how much reaction are to be set up. Then the cost‐benefit decision rules should consider this.
Additional estimations for other sectors have been estimated and are available at Markandya and Mishra (2010).
Adaptation is set to impacts in 2085 as climate change is negatively affecting forests in the long term, as short‐term impacts are mainly producing an increase in primary productivity (Fischlin et al., 2007).
For more information on the BIOME4 model see Ravindranath et al. (2006).
These adaptation measures were discussed on a workshop celebrated in the TERI institute in September 2009.
The Five Year Plan is a document produced by the Planning Commission of India every five years, which lays down the basic formulation of the most effective and balanced utilization of the nation's resources. Based on certain criteria and indicators the plan document makes suggestions on the allocation of resources needed for the development of different sectors, including forestry.
Note that these costs are an aggregation for the whole period until 2085.
References
Appendix
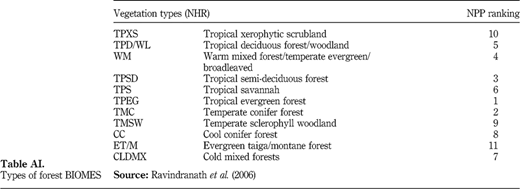
In the Table AI, the corresponding vegetation types are shown. The first column is the BIOME4 classification. The second column is the matching classification using multi temporal India Remote Sensing (IRS) Wide Field Sensor (WiFS) data (Joshi et al., 2006) and the third column shows the ranking on NPP. This mapping is done based on comparisons between various studies, Champion and Seth (1968) classification and expert ecologist opinion. In addition, the ranking of forest types based on NPP is obtained from the findings of Ravindranath et al. (2006) for each vegetation type.
About the authors
Dr Elena Ojea is a Post‐doctoral Researcher at the Basque Centre for Climate Change (BC3), in Bilbao (Basque Country, Spain). Her research focuses on the socio‐economic impacts of climate change on ecosystem services and adaptation policies. She holds a PhD in Environmental Economics (University of Santiago de Compostela, Spain) and is graduated in Environmental Sciences (University of Salamanca, Spain). She obtained her PhD in 2008 with European mention and has been recently awarded with the Extraordinary Doctorate Award of the Faculty of Economics. Elena Ojea is the corresponding author and can be contacted at: elena.ojea@bc3research.org
Ranjan K. Ghosh is currently pursuing his PhD in the Division of Resource Economics, at the Humboldt University Berlin. He completed his MSc in Economics from the Madras School of Economics, 2007. As a part of his Master's thesis he developed a mathematical model for mapping vulnerability to climatic stress. Prior to his doctoral program he worked as a Researcher at TERI and Citigroup Analytics. He is also a member of the South Asian Network for Development and Environmental Economics.
Bharat B. Agrawal currently works as Solar and Renewable Energy Certificates (REC) Market Analyst for the Bloomberg New Energy Finance. He's also building models for fundamental forecast of REC demand‐supply and Levelised Cost of Energy (LCoE). He previously worked with The Energy and Resources Institute (TERI, New Delhi) at the Climate Change Research Division. His work on estimating costs of adaptation to climate change in India's forests has been published in a book on Costing Adaptation (by TERI Press). He holds a Post Graduate Diploma in Forest Management from Indian Institute of Forest Management (Bhopal, India) and a Bachelor's degree in Commerce.
Dr P.K. Joshi is Professor and Head Department of Natural Resources, TERI University, New Delhi, India. His interest lays in vegetation characterization, climate change and ecosystem dynamics. He uses remote sensing and GIS as primary tools for such studies. He trained originally as an environmentalist, and then as an ecologist, has developed skills in remote sensing and GIS with a firm scientific research basis. His research has been recognized by the Indian Academy of Sciences (INSA) and National Academy of Sciences India (NASI) through the award of their highly prestigious Young Scientist Medal (2006) and Young Scientist Platinum Jubilee Award (2009), respectively, and many others of similar kind. He is widely published, has experience of the successful supervision of graduate research students at PhD and Master's levels. Presently, his research is more focused on landscape ecological analysis and climate change studies using geospatial tools.

