


The Philippines is among the countries vulnerable to the adverse impacts of climate change. However, many local government units (LGUs) and the people themselves are not aware of the climate change phenomenon and do not have the capacity to undertake appropriate climate change adaptation measures. The purpose of this paper is to discuss the climate change adaptation strategies of communities and LGUs and the barriers and recommendations to enhance their adaptive capacity.
The study covered five communities vulnerable to climate change impacts. Information on extreme climatic events and their impacts and adaptation strategies undertaken were gathered through focus group discussions (FGDs) and key informant interviews. LGU staff members were assisted in the preparation of their climate change adaptation plan (CCAP).
The LGUs and communities have low adaptive capacity and employed temporary adaptation strategies. Strong social cohesion and spontaneous collective action are factors that could enhance the communities' adaptive capacity. The pursuit of awareness raising and capacity building activities on climate change phenomena, alternative livelihood, preparedness and adaptation possibilities, technology and infrastructure development and collective action, which are critical adaptive capacity enhancement factors were laid‐out in the CCAP.
The paper presents the barriers that constrain the adaptive capacity of communities and LGUs, the recommended adaptive capacity enhancement measures to overcome these barriers and the highlights of the CCAP jointly prepared by the partner LGUs and scientists.
1 Introduction
The Philippines is among the countries vulnerable to the adverse impacts of climate change. Tropical cyclone is the most commonly occurring natural hazard in the Philippines, as it is located in the Pacific typhoon belt area.
An average of 20 tropical cyclones passes through the Philippine area of responsibility each year causing billions of pesos in damages. Analysis of 59‐year data on tropical cyclones revealed that the intensity of typhoons is getting stronger, especially since the 1990s (Hilario, 2009). Around 47 percent of the average annual rainfall in the country is attributed to the occurrence of tropical cyclones and this has both positive and negative effects. A good amount of rainfall brought by tropical cyclones is beneficial to agriculture but excessive rainfall has caused serious flooding and mudslides in the recent years.
There are also indications of accelerated sea level rise in the Philippines. Monitoring of Manila Bay shows a small rise in sea level before the 1960s and then a more rapid increase of between 20 cm and 40 cm through to the present. This is aggravated by excessive land reclamation and possible ground subsidence (Hulme and Sheard, 1999).
Analysis of Manila Bay area suggests that a 100 cm rise in sea level would lead to over 5,000 hectares of the Bay area being regularly inundated with over 2.5 million people affected (Hulme and Sheard, 1999). Even a 30 cm rise in sea level, anticipated by around 2,045 would threaten over 2,000 hectares and about 0.5 million people. These risks would be further enhanced if sea surges associated with intense storm activity increase. These projections are alarming, considering that the Philippines is an archipelago and has a coastline of about 34,000 km and coastal settlements are exposed to the risks of strong winds brought by cyclones as well as accelerated sea level rise.
Saline water intrusion has also been observed in some parts of the country. Increase in the salinity of groundwater aquifers, estuaries, and coastal farmlands will affect the agriculture and aquaculture sectors as well as the general public (Jabines and Inventor, 2007).
In the Philippines, local government units (LGUs) are in the forefront of disaster management, including responding to the impacts of climate change. Because adaptation to climate change is location‐specific, the role of local institutions is critical in shaping adaptation and improving capacities of the most vulnerable social groups. However, many LGUs are not aware of climate change phenomena and do not have the capacity to assist the affected communities in preparing climate change adaptation measures. It is important for people, communities and institutions to develop adaptive capacity and enhance resilience to minimize risks, damages and losses.
The local government code (LGC) of the Philippines vests authority to LGUs (i.e. provinces, cities and municipalities and villages in the implementation and maintenance of disaster management program, ensuring prevention, mitigation, preparedness, response, rehabilitation and reconstruction, and development).
The fundamental basis for disaster risk management (DRM) in the Philippines is outlined in Presidential Decree (PD) 1566 (1978) entitled “Strengthening the Philippines Disaster Control, Capability and Establishing the National Program on Community Disaster Preparedness”. This is spearheaded by the NDCC which is chaired by the Secretary of National Defense, while the Administrator of the Office of Civil Defense (OCD) serves as its Executive Officer. 18 major government departments represented by the department secretaries, were designated as NDCC members and perform functions related to their mandates and sectoral concerns. NDCC links with the disaster coordinating councils (DCCs) at the regional, provincial, city or municipal, and village level.
In the Philippines, 70 percent of the country's disasters are due to hydro‐meteorological phenomena such as typhoon and flooding. LGUs, being in the forefront in the delivery of basic services, also have the mandate in DRM as provided for by a number of national policies such as the Climate Change Act of 2009 and Disaster Risk Reduction and Management (DRRM) Act of 2010.
This paper presents the key findings of a recently completed action research project which aimed to enhance the adaptive capacity of LGUs and local scientists. It focuses on the adaptation strategies of communities and institutions, the factors that constrain their adaptive capacity and the measures to overcome these barriers, as proposed in the LGUs' climate change adaptation plan (CCAP).
1.1 Theoretical framework
Adaptation to climate change involves changes in social and environmental processes, perceptions of climate risk, practices and functions to reduce potential damages or to realize new opportunities. Adaptation measures are undertaken by a range of public and private actors through policies, investments in infrastructure and technologies, and behavioural change (Adger et al., 2007).
Vulnerability is a set of conditions and processes resulting from physical, social, economical, and environmental factors, which increase susceptibility of a community to the impact of hazards (www.unisdr.org). It is a set of prevailing and long‐term factors, conditions and weaknesses, which adversely affect the ability of individuals, households, organizations, or community to protect itself, cope with or recover from the damaging effects of disasters.
The impacts of a climate hazard on an exposed system are mediated by its vulnerability, the determinants of which will depend on how a system is defined but may include social, economic, political, cultural, environmental and geographic factors. Vulnerability can be classified into two types: biophysical and social vulnerability. The type of vulnerability that is relevant to the concept of adaptive capacity is social vulnerability (Brooks and Adger, 2005).
The following factors are said to be critical in enhancing adaptive capacity:
information on the nature and evolution of the climate hazards faced by a society and socio‐economic systems;
resources including financial capital, social capital (e.g. strong institutions, transparent decision‐making systems, formal and informal networks that promote collective action), human resources (e.g. labour, skills, knowledge and expertise) and natural resources (e.g. land, water, raw materials, biodiversity);
willingness to adapt or refusal to accept risk associated with climate change; and
large‐scale structural economic factors and prevailing ideologies (Brooks and Adger, 2005).
At the local level, vulnerability is determined by the socioeconomic characteristics of the communities and their abilities in responding effectively. The capacity to adapt varies across regions, countries, and socioeconomic groups and will vary over time. The most vulnerable regions and communities are those that are highly exposed to the changes expected in the climate and have limited adaptive capacity. Countries with limited economic resources, low levels of technology, poor information and skills, poor infrastructure, unstable or weak institutions, and inequitable empowerment and access to resources have little capacity to adapt and are highly vulnerable (IPCC, 2001).
Various adaptation options may be available to decision makers but people may not choose the best or the most effective responses that would reduce losses due to established preference for, or aversion to, certain options. High adaptive capacity may not necessarily translate into the best actions that reduce vulnerability especially when there are conditions that limit or constrain opportunities for such capacity to be realized. A number of factors may influence or explain adaptation behaviour such as economic and natural resources, social networks, entitlements, institutions and governance, human resources, and technology. Limitation in any of these factors as well becomes a significant barrier in adaptation decisions. Selection may be constrained by other priorities, limited resources, economic, institutional, or political barriers. There may be significant knowledge gaps for adaptation or impediments to flows of knowledge and information relevant for adaptation decisions. Recurrent vulnerabilities, in many cases with increasing damages, illustrate less‐than‐perfect adaptation of systems to climatic variations and risks (Adger et al., 2007; IPCC, 2001).
1.2 Methodology
Data and information for this study were collected though key informant (KI) interviews and focus group discussion (FGD). KIs include local government officials who were interviewed to find out their response strategies and the barriers that they encountered. FGD participants include community residents representing major sectors such as agriculture, fishing, and business.
Vulnerability assessment was done using the participatory approach (Pulhin, 2003; Pulhin et al., 2006). The participants were asked to recall the extreme climatic events that affected their community, identify the sectors that were adversely affected by these events and discuss their adaptation strategies and the barriers to adaptive capacity enhancement. The people's recollection of events was validated with historical records kept by national and local government agencies concerned.
The participatory vulnerability assessment was done by a group of eight to 12 participants with more or less similar socio‐economic characteristics. The participants were asked to provide the following information:
Historical events of climate variability and extremes. The FGD participants were asked to recall the natural occurrences that they have observed/experienced in their area in the last 40 years that reflect climate variability and extremes. The major events that relate to climate variability and extremes included seasonal variability, prolonged rain, drought, forest fires, and destructive typhoon.
Sectoral impacts of climate variability and extremes. Based on the climate‐related events recorded, the participants were asked about the impacts of these climatic events on different sectors and institutions.
Impacts of climate variability and extremes to different socio‐economic groups. The FGD participants were asked to identify the different socio‐economic groups in their area that were affected by climate variability and extremes and their specific impacts. Using colored paper cards cut into circles of three sizes (small, medium and large), the participants were asked to determine the degree of negative impacts of climate variability and extremes to the different groups by pasting these cards opposite the group. The size of the circles corresponds to the degree of negative impact of climate variability and extremes to the specific group, that is, small circle means small negative impact and so on. The participants were also to explain their choice.
Vulnerable groups and places. Participatory mapping exercise was done by asking the FGD participants to draw a village map indicating the major physical features such as roads, river systems and settlement areas. Using the same map, the participants identified the location of vulnerable places in their villages with triangle‐shaped paper cards of different sizes. The sizes of the triangle indicated the degree of their vulnerability – the biggest representing the most vulnerable, the average size representing moderately vulnerable and the smallest, least vulnerable. They explained why they have identified these places as vulnerable (e.g. steep slope therefore highly erosive area, grassland frequently subjected to forest fires, etc.).
Local groups and institutions adaptation strategies. The FGD participants identified the different adaptation strategies employed by the various socioeconomic groups and selected institutions to cope with climate variability and extremes. They assessed if these strategies were effective and recommended mechanisms for the different groups and institutions to improve coping capacity.
The vulnerability assessment results were used in preparing the local government's CCAP. The planning exercise was undertaken by a composite team of scientists, local government officials and community residents. The plans were presented in public forums to validate and disseminate information, solicit reactions and suggestions, create public awareness, as well as encourage preparedness to climate change‐related events and cooperation in the implementation of planned activities.
2 Vulnerability of study sites to climate change impacts
2.1 Profile of study communities
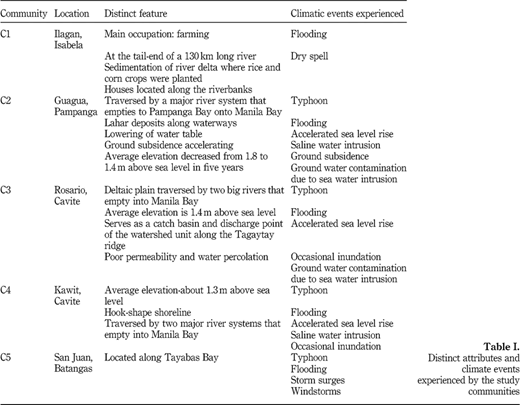
Communities 2, 3 and 4 (C2, C3 and C4) are exposed to the same climate risks largely because of the similarity of their geophysical attributes. These are coastal communities with low elevation and the people's main occupations were fishing and fish processing. In C4, saltmaking was also a major industry. These communities were exposed to risks associated with typhoons of increasing intensity and accelerated sea level rise that cause flooding, climate variability and saline water intrusion. On the other hand, C1 and C5 were located along major river systems and exposed to typhoons and flooding that caused heavy damage to crops, livestock and housing. Farming was the main occupation of community residents (Table I).
2.2 Climate events experienced
According to KIs and FGD participants, they experienced strong typhoons in the 1970s and 1980s but typhoons have increased in frequency and intensity since the 1990s. The community residents also noted climate variability and highly variable rainfall patterns and distribution, which became more pronounced particularly in the 2000s. They observed that even during dry season, heavy downpours that lasted for a few minutes, became a common occurrence only in recent years. Historically, it was not uncommon to have two to three months of dry weather during the dry season and 30 days of continuous rain during the wet season. However, the community residents noted that in recent years, typhoons occurred even during the dry season and that long dry weather spells were experienced even during the supposedly rainy season.
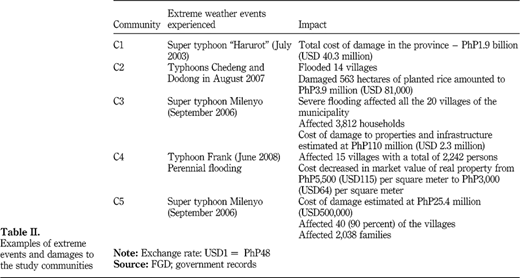
Flooding, which happened in all the study sites was caused mainly by heavy rainfall brought by typhoons. However, C2, C3 and C4 also experienced flooding due to observed sea level rise. During high tide, some parts of these communities were inundated for three‐five hours. Table II illustrates the extent of damage caused by extreme events in these communities.
2.3 Vulnerable sectors
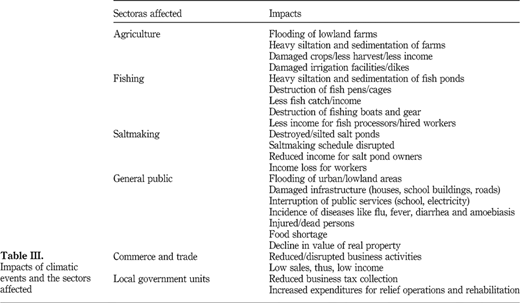
The sectors affected and the nature of the impact of the experienced climatic events varied by type of event, the geographic location of affected sectors and their socioeconomic conditions (Table III). Typhoon, which brought strong winds and flooding, was the most devastating climate event because it affected all sectors of society.
Agriculture
Farmers were the hardest hit by these climatic events because agricultural crops, particularly rice, were very sensitive to water and temperature stress. They were also adversely affected by highly variable rainfall patterns and distribution that were observed more frequently in recent years. For instance, in C1 and C5, the planting calendar usually started in June, the start of the rainy season. However, in recent years, dry spells or heavy rainfall occurred immediately after seedlings were planted or seeds were sown causing the plants to die due to water or heat stress. These events adversely affected the farmers working on rainfed farms and did not have the capability to employ coping strategies such as renting or buying irrigation pumps or using early maturing crop varieties. Indeed, the socio‐economic conditions of the farmers influence their adaptive capacity.
The strong winds that came with typhoons uprooted trees or caused fruits to fall. Flooding caused by typhoons or heavy rainfall washed away or flattened standing crops. These extreme climatic events caused a decline in harvests and reduced income for farmers. The natural recovery period for perennials took a long time. For instance, in C5, it took one to two years for coconut trees that were damaged by typhoons to regain normal levels of productivity. Farmlands silted by sediments brought by floods also took time to recover. One of the farmlands in C5 could no longer be used for growing rice and has remained idle for about three years because the topsoil was covered by gravel and sand deposited by flood waters. Also in C5, the Manalo Dam was destroyed by strong floods brought by a typhoon. This dam, which used to serve about 200 hectares of rice land, remained unserviceable because its repair required a substantial amount of money beyond the capability of the local government.
Flooding has a positive effect on some of the farmlands in C1. The sediments brought by the floods from upstream enhance the soil fertility in the river delta and benefited the farmers. However, dry spells, which is most common in C1 compared with other study communities, adversely affected farming operations.
Fishing
Typhoons, flooding and salt‐water intrusion have also significantly affected open‐sea fishing and aquaculture. Fishers could not go out to fish in the open seas during bad weather conditions due to the risk of strong waves and currents. The hardest hit were the small fishermen who fish in the so‐called municipal waters and depend on daily fish catch for subsistence and their helpers who were paid wages based on the volume of fish catch or harvest.
Many fishing boats that ventured into the open seas during stormy weather reportedly capsized, which led to loss of lives. A number of fishing boats and fishing gears were also destroyed because of the strong winds and ocean waves in some parts of C5 brought about by typhoons. Many fish pens and fish cages were also destroyed due to strong currents and strong winds. Saline water intrusion on fish ponds in C2 also adversely affected the growth of fish, which led to low income of operators and workers.
Typhoons, flooding and rainfall variability also affected the fish processing industry in C3. The schedule of fish drying activities was disrupted due to rainfall variability and flooding, which damaged the fish smoking facilities.
Saltmaking
Climate change had a significant impact on the saltmaking business. C4 belong to type 1 climate with distinct dry season from November to April and rainy season from May to October. This weather pattern enabled the saltmakers to systematically program their activities. Saltpond preparation started at the onset of dry season in November. Salt naturally crystallizes on the dried ponds and harvesting usually started in December and January when sufficient amounts of salt had accumulated. Salt harvesting usually lasted up to April or early May. This cycle of operations has been observed by saltmakers for decades and saltmaking was a profitable business that provided employment to unskilled workers. Saltponds were usually located in areas that were not accessible to motorized vehicles and harvested salt was manually hauled from the pond to the roadside warehouses.
In the recent years, changes in weather conditions, particularly variability in rainfall, disrupted the saltmaking calendar and adversely affected the profitability of the saltmaking industry. There were many times in recent years when heavy rains and even typhoons would come in December‐January and wash away or melt the salt crystals that were ready for harvest or dilute the water salinity level preventing the formation of salt crystals. Accelerated sea level rise, which in recent years caused the inundation of previously dried saltponds, has also become a problem for the operators.
General public
Typhoons and flooding caused disruption of basic services, damaged facilities and gave rise to illnesses and water‐borne diseases. Public school buildings were used as evacuation centres or temporary shelter for evacuees and classes were suspended for the entire period during which evacuees stayed in the shelter. The outbreak of illnesses and water‐borne diseases, which usually happened in the evacuation centres or in submerged areas was a serious problem. It also posed risks to surrounding communities, including to school children who would use these classrooms again when the bad weather condition subsided.
Landslides and flooding brought by typhoons and heavy rainfall have caused serious casualties such as deaths, injuries and damage to property. Food shortage among community residents who opted to stay in their houses rather than evacuate during flooding was common in the study areas. Prices of food also increased after typhoons or flooding, making it less affordable, particularly to low‐income consumers.
A long‐term effect of flooding was the decline in the value of real estate located in flood prone areas of C2, C3 and C4. For instance, real estate values in some of the regularly inundated portions of C3 declined from USD70‐USD100 per square meter to USD40‐USD50 per square meter and sellers continued to find it hard to attract buyers.
The strong winds and heavy rainfall brought by typhoons greatly affected the people whose houses were built of light materials and who were illegally squatting on river banks. These situations were observed in C1, C4 and C5 where there were many landless residents. Poor families who illegally built their houses on riverbanks were always at risk because of the danger that rushing flood waters would wash away their dwellings. Many of them could not take evasive action because of lack of response strategies and limited evacuation options. They were, therefore, the subject of evacuation and rescue operations and were brought to evacuation centres where they were provided with relief assistance such as food, clothing and temporary shelter.
Houses built along the coasts were also exposed to the risks brought by strong winds. There were many instances when rooftops in C2, C3 and C4 were blown away or entire houses collapsed in the face of strong winds.
Local government units
Being in the forefront in the delivery of services, all these climate events adversely affected the LGUs in three ways:
- 1.
loss in revenue collection;
- 2.
increased expenditure for relief and rescue operations and rehabilitation; and
- 3.
loss of investments.
When commerce and trade were disrupted due to typhoons and flooding, LGUs could not collect taxes and other fees from the affected businesses. On the other hand, the LGUs incurred greater costs for providing protection to threatened sectors and relief assistance during and immediately after the event in the rehabilitation of damaged public service facilities (e.g. school buildings, public markets and roads). Moreover, investors avoided flood prone and risky areas, which adversely affected local development.
These findings indicate the need to carefully assess the full value of losses associated with climate change‐induced events so that institutions can be established to provide appropriate adaptation measures.
3 Adaptive capacity and adaptation strategies of communities
The community residents have the same response actions to typhoons and flooding and have limited ability to design and implement effective adaptation strategies. This is largely due to their poverty and limited access to resources and economic options, limited knowledge about climate change phenomena and feasible adaptation possibilities. Their adaptation strategies were mostly temporary and reactive.
For those whose houses were built with light materials, the usual response action against typhoons was to reinforce their houses by tying their roofs or putting heavy objects such as tires or hollow blocks to prevent the roofing material from being blown away. Sometimes, this action was effective but there were also times when the walls or even the entire house was destroyed. Others protected all their clothes and other belongings in polyurethane bags to prevent them from being soaked by seeping rain and flood waters.
Evacuation was not an immediate response action in the communities. Many residents refused to take precautionary measures and evacuate to safer places despite impending typhoon and flooding‐induced hazards. They were resistant to leave their homes, preferring to take a chance and hope that the storm would subside or the typhoon would not reach land. In many instances, people went up to their rooftops until they were rescued and forcibly brought to evacuation centres.
In flood prone areas, residents applied various temporary adaptation measures. They protected their belongings from flood by placing their appliances and furniture on the second floor of their two‐storey houses or on stilts in anticipation of possible flooding. Households generally prepared alternative lighting materials and cooking fuel at the start of the rainy season when the disruption of power supply was common. Candles, lamps with rechargeable batteries and kerosene lamps, as well as charcoal‐fuelled stoves were common adaptation strategies used by many households.
Some sectors were able to exploit various opportunities during difficult times. Enterprising store owners used improvised amphibious vehicles to sell food stuffs to residents whose mobility was constrained by flood waters. In C2, boat owners used their boats to provide transport services for a fee much higher than the regular jeepney fare.
As expected, economically better‐off victims had greater resilience and higher adaptive capacity. They were able to obtain loans as new capital for the same business, and upgrade their facilities. For instance, the fish processors rebuilt their fish processing plants beyond the estimated flood line. They opted to rebuild in the same location instead of moving to another place less vulnerable to flooding.
Some factors such as strong social capital, extensive social networks, close family ties, low inherently low level of aspirations and wants and positive outlook and attitudes in life enhanced the communities' resilience and adaptive capacity.
Strong social cohesion was pervasive in the study communities with several spontaneous collective actions observed on many occasions during these events. Neighbours informed and rescued people at risks and provided food, shelter and even clothes to those in need, regardless of their socioeconomic condition. Sharing of limited resources was also common in these communities. For instance, a family of six in C5 whose damaged house was no longer liveable was accommodated by a relative with five children in their 6 m×4 m house. Shared poverty is a virtue that many Filipino families posses. People tend to share their limited resources in a time of crisis and that is a valued norm among the locals. In C2, the community initiated construction of secondary dike for flood control by soliciting financial contributions from public and private sectors.
4 Adaptive capacity and adaptation strategies of local institutions
Climate change adaptation in the Philippines was facilitated by a set of organizational structures from the national to the smallest unit of government. Protocols, systems and procedures on DRM and disaster risk reduction (DRR) were set up in 1978 by PD that aimed to strengthen national disaster control capability and establish a community disaster preparedness program.
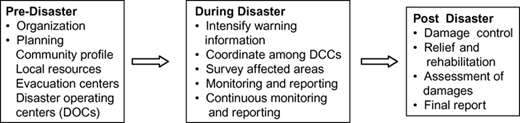
As mandated in PD 1566, LGUs are to prepare a DRM program that outlines the Local Disaster Coordinating Council (LDCC) activities before, during and after a disaster. These adaptation strategies practiced by the LGUs should follow the “preparedness‐prevention‐mitigation” pattern shown in Figure 1.
Disaster coordinating councils were established at the national, regional, provincial, municipal and village levels. LGUs at the provincial and municipal levels were allowed by law to set aside 5 percent of their regular income as “Calamity Fund” to be used for relief and rescue operation when their province/town was declared under a state of calamity.
In the study communities, the LGUs followed general DRM protocols, which included mobilizing the LDCC, monitoring the status of the event and affected communities and mobilizing the Calamity Fund. This mechanism was effective as a short‐term response action. However, much is still required in terms of long‐term response to climate change impacts, which are based on better preparedness instead of reactive responses.
Despite the current national DRM policies and procedures, the LGUs in the study communities responded differently to climate events depending on the extent of their vulnerability, the sectors affected and their own capabilities. Only C2 and C4 had long‐term preparedness plans in anticipation of worse floods in the future and C2's LGU had the highest adaptive capacity and the potential to sustain its relatively high adaptive capacity level compared to the other LGUs. It instituted more innovative programs to safeguard those who were directly and indirectly affected by flooding and saline water intrusion. It was the only LGU with an early warning system (EWS) in place with clear procedures known to all sectors. Their EWS had three major components, which were:
- 1.
rain gauge to measure rainfall;
- 2.
flood warning system; and
- 3.
information dissemination.
This EWS was effective in reducing losses, protecting lives and properties and in preventing the further aggravation of the effects of other environmental problems such as ground subsidence.
C2 also had well trained personnel who were able to implement the DRM plan and prepare their CCAP. C2 was not a rich municipality but was able to mobilize resources and motivate people to cooperate with the authorities. Their CCAP was not elaborate, but realistic and achievable, given their limited means. Their long‐term plan included the redirection of local development towards higher elevations and away from flood prone areas, upgrading of roads to increase their elevation above flood water level, awareness raising and preparedness exercises throughout the municipality. Their level of adaptive capacity may have been honed by their bad experiences with flood and lava flow from the Mt Pinatubo volcanic eruption in 1991.
C2 and C4 had structural and non‐structural adaptation strategies in addition to the reactive response actions prescribed in the DRM protocol to protect the communities and minimize or mitigate climate change‐induced impacts. C4's adaptive capacity was improving but was constrained by its very low income, high population density and lack of trained staff. C5 had strong potential because of its trained staff, but greater involvement of the local political leadership was needed to guide, mandate and empower staff to take the initiatives in climate change adaptation planning.
All the LGUs extended support to help needy families recover from the impacts of typhoon and flooding, providing starter seeds, loans and grants for house or boat repairs, which amounted to about USD50 per household. However, only 10‐20 percent of the victims received such assistance due to insufficient funds.
The adaptation measures employed by the LGUs were drawn from the DRM protocols that were meant to address extreme events such as earthquakes, volcanic eruption and typhoon. In recognition of the need for LGUs to improve their adaptive capacity and formulate policies to address other climatic events such as sea level rise and dry spells, the national government through the Department of Interior and Local Government (DILG) issued memorandum circulars (MC) to alert LGUs and encourage them to establish climate risk management (CRM) procedures. Under these circulars, all LGUs were mandated to undertake climate change awareness raising and capacity building activities to empower them in autonomously responding to climate change and preparing their adaptation plans and mobilizing local action to address the impact of climate change. However, LGUs' compliance with these circulars was reportedly low. LGUs have yet to fully appreciate the growing certainty that more frequent and intense typhoons and other climate change‐induced events can be expected, thus making it more urgent to be better prepared and to formulate specific CRM response actions. Moreover, the three year term of office of LGU executives (with re‐election for another two terms) constrain them from pursuing long‐term projects that may go beyond their term of office.
5 Conclusions and recommendations
5.1 Conclusions
Among the main socioeconomic factors constraining adaptive capacity of households and communities were a lack of organized community‐driven response action; attitudes of dependence and the perception that government and the “supreme being” will provide; poverty and limited access to resources; limited skills and employment opportunities; and limited knowledge of feasible adaptation possibilities and the potential impacts of climate change‐induced events. Institutional adaptation, on the other hand, was also constrained by institutional and attitudinal barriers. In the study sites, these barriers included limited knowledge and skills of local chief executives (LCEs) and staff about:
national government climate change programs and policies (e.g. DILG MC);
affordable technology (e.g. rain gauge);
how to set up EWS; and
climate forecasts application.
Also, LCEs and their staff had poor attitudes and perceptions which translated into an indifference to implementing national government policies or collaborating with potential partners (such as the academics) and a lack of a long‐term planning perspective. There were also limited options on potential relocation sites for communities at risks. The DRM function was performed by temporarily assigned staff, which meant that CRM skills development and capacity building were not sustained.
There may be a “lack of organised community‐driven response” as community organizations usually do not have mandates explicitly related to climate‐related disaster management. Although there may be a high degree of social cohesion among the people, this is quite informal and does not translate to forming an organization targeted for CRM.
5.2 Recommendations
To overcome these socioeconomic and institutional adaptive capacity enhancement barriers observed in the study communities, the following measures drawn from the CCAP for each LGU are recommended:
There needs to be a further strengthening of information, education and communication campaigns targeted at LCEs, LGU staff and the general public on climate change related subjects. These subjects include climate change phenomena; disaster preparedness; EWS; affordable climate change adaptation technologies; best practices by other LGUs; resource mobilization for preparedness programs and policies; relevant national government programs and policies; and effective governance. The national government should issue explicit policies to compel LGUs to prepare adaptation plans beyond the current DRM protocol and set up a disaster preparedness fund or CRM fund.
LGUs should set up a knowledge management system that contains climatological and hydrometeorological data, the incidence of climatic events and their impacts in easily retrievable format and provide relevant information to all stakeholders, particularly the decision and policymakers. Also, there should be a mechanism that will facilitate science‐informed policymaking and adaptation strategy formulation.
All municipalities should prepare hazard map, identify vulnerable sectors and their specific vulnerabilities and formulate programs and policies to enhance their adaptive capacity and resilience.
Appropriate risk monitoring and early warning technologies and devices such as rain gauge and flood indicator should be installed to forewarn and protect residents of risky areas. The EWS should be community‐based and communities should be trained and encouraged to take collective action to strengthen their adaptive response capability.
Greater links and networks with the private sectors and NGOs should be instituted to augment the LGUs' physical and financial capability.
An information dissemination system should be set up to inform the general public and the policymakers about critical decision points on risk monitoring and early warning.
CRM activities should be integrated into local development programs, regular personnel should be assigned to the CRM office and a system to sustain capacity building efforts should be instituted.
References
Further Reading
About the authors
Dr Linda M. Peñalba is Associate Professor of Institute of Governance and Rural Development, College of Public Affairs and Development (CPAf), University of the Philippines Los Baños (UPLB). She obtained her Bachelor of Science and Master of Science degrees in Agricultural Economics from UPLB and her PhD in Environmental Studies from the University of Wisconsin‐Madison, USA. Her fields of studies include agrarian studies, innovation systems, and social and institutional analysis of economic and environmental issues. Linda M. Peñalba is the corresponding author and can be contacted at: lmpenalba@yahoo.com
Dulce D. Elazegui is University Researcher at the Center for Strategic Planning and Policy Studies, CPAf, UPLB. She obtained a Master's degree in Agricultural Development Economics from Australian National University and a Master's in Technology Policy and Innovation Management from Limburg University in the Netherlands. She has been involved in climate‐change related projects with particular focus on the role of the institutions and policies and science‐policy interface.
Dr Juan M. Pulhin is Professor and UP Scientist II from the Department of Social Forestry and Forest Governance, College of Forestry and Natural Resources (CFNR), UPLB. He has over 50 technical publications on various aspects of natural resources conservation and governance as well as on the social dimensions of climate change. He was Lead Author of the 2007 Intergovernmental Panel on Climate Change (IPCC) Fourth Assessment Report. He completed his PhD in Geographical Sciences from the Australian National University.
Dr Rex Victor O. Cruz is Professor of CFNR, UPLB and Chancellor of UPLB. He obtained his PhD in Watershed Management from the University of Arizona, USA. He was the coordinating Lead Author of the IPCC Fourth Assessment Report. He has been doing research on climate change for the past 15 years and has more than 35 technical and scientific papers.

