


– The purpose of this study is to estimate carbon mitigation impacts of project activities in a community forestry project in Andhra Pradesh, India. Measurement and quantification of carbon stocks, monitoring of these stocks over time and projections using models is necessary for assessing the climate change mitigation potential or impacts of all forest development and conservation projects.
– In this study, multiple mitigation assessment methods and models were used to estimate the carbon mitigation impacts – PROCOMAP, TARAM and CATIE, by adopting a three-tier approach similar to Intergovernmental Panel on Climate Change (IPCC) Guidelines.
– There are differences in mitigation potential estimates across models as well as across tiers. The study highlights the strength and weaknesses and/or limitations and advantages of adopting the different approaches and their applicability for estimating mitigation potential of a forestry project. The same could be adopted for a future Reducing Emissions from Deforestation and Forest Degradation (REDD) regime also, given countries may not have the necessary technical capacity and data needed during the post-2012 REDD scheme. While countries with advanced data, technical and research capabilities could use models or, in other words, adopt the Tier-3 approach, countries with data and technical limitations, as in India, could adopt a Tier-2 or Tier-1 approach to begin with.
– The limitations and advantages of use of the multiple mitigation models is addressed.
– This work would help understand use of three mitigation models by prospective students and researchers and also the data needs and limitations for use of these models.
1. Introduction
Land-based projects can provide carbon benefits directly or indirectly either in the form of conserving the existing carbon stocks (conservation projects) or by enhancing the carbon stocks (afforestation and reforestation projects), reducing CO2 emissions (e.g. REDD) or by substitution of fossil fuels (biofuels and bioenergy). In India, a large number of land-based developmental and environmental conservation projects are being implemented as a part of national development goals, with domestic funding, as well as from bilateral and multilateral sources such as the World Bank, United Nations Development Programme, Asian Development Bank. According to IPCC (2007), positive synergies exist between climate change mitigation or carbon enhancement, sustainable development and adaptation. Further, there are significant opportunities, particularly in the land-use sectors to promote this synergy (Ravindranath, 2007).
Estimation of stocks and fluxes of carbon in forests or plantations in a given area over a given period and under a given management system is termed carbon inventory or estimation. Measurement and quantification of carbon stocks, monitoring of these stocks over time and projections using models are necessary for assessing the climate change mitigation potential or impacts of all forest development and conservation projects. In this study, we estimate the carbon mitigation impacts of project activities in a community forestry project in Andhra Pradesh, India, using multiple mitigation assessment methods and models by adopting a three-tier approach similar to IPCC Guidelines and compare estimates across multiple mitigation models.
2. Approach and methods adopted
A multitude of methods and/or tools are available for carbon inventory in forestry systems. The currently available methods are complementary and the utility of the same as stand-alone or in combination is determined by the activity or purpose or scale for which it is being adopted. In this study, a combination of the methods is adopted to assess the biomass and carbon stocks in forests managed and treated as well as plantation forests raised or managed under the Andhra Pradesh Community Forest Management (AP CFM) project.
2.1 Carbon inventory in baseline and project scenario
The approach for estimating carbon stock changes in the baseline and project scenario involves compilation of information from primary as well as secondary sources. The preliminary steps in carbon inventory include reconnaissance visits to project sites and collection of information or data from forest and other departments as well as village communities.
Project boundary: The project boundary needs to encompass all anthropogenic emissions by sources of greenhouse gases (GHGs) and removals by sinks under the control of the project participants that are significant and reasonably attributable to the project activity. The project area consists of a geographic area with multiple parcels, within which carbon stock changes have to be estimated and monitored. In the case of AP CFM project, discrete blocks of degraded or managed forest lands across the various districts can be considered as the project boundary.
Carbon pools to be monitored: The carbon pools relevant to forestry mitigation projects include above-ground biomass (AGB), below-ground biomass (BGB), litter, dead wood and soil organic carbon (SOC). In this study, resource and time limitation led to selection of only the two dominant carbon pools, which are most likely to be impacted, namely, AGB and SOC, which were estimated through field studies, and based on estimates for AGB and using conversion factor or ratio, BGB (or root) was estimated. Thus, three carbon pools have been considered, and the methods adopted for estimating them are discussed in the following section.
2.1.1 Baseline scenario.
The baseline for a project activity is the scenario that reasonably represents anthropogenic emissions by sources of GHGs and removal by sinks that would occur in the absence of a proposed project activity. The first step in determining a project’s additional GHG benefits is, therefore, development of a “without-project” baseline scenario against which changes in carbon stocks occurring in a project area over different time periods, say 5, 10 and 20 years, can be compared.
Sampling strategy: Sampling was focused on forest ranges where maximum area was brought under a particular afforestation model. Within the broad regions, districts and in these districts, forest ranges with maximum area covered under a scheme or plantation model, were chosen. The selection of Vana Samrakshana Samiti (VSS) – village-level forest management committees, within a range and location of plots for sampling and measurement within a category under baseline as well as mitigation scenario was done using the stratified random sampling procedure. In all, 62 VSSs were sampled across four districts of Andhra Pradesh, covering six forest divisions and seven forest ranges. In each sampled VSS, minimum five plots representing a plantation model and year of implementation was sampled.
Plot selection within a particular forest range was through a compilation of primary data on different models implemented in a range and identification of the major one, based on area covered. In each range, baseline or untreated control land categories (often untreated forests) were identified to represent the baseline situation for each model. The number of plots was determined, taking care that each model and each control sample was represented in at least five plots. Stratified random sampling approach was adopted, and the steps adopted for sampling are as follows:
Forest range was used as first-level stratification criteria as models differed across forest ranges, which provided a gradient with respect to forest ecosystem and other environmental conditions (including forest types typical of the region).
Range maps and afforestation roll out was mapped with the help of the implementing authorities (range forest officer and other field staff) to identify any further stratification required (for e.g. upstream/downstream, forest density gradient).
Post this, typical set of model or models implemented in the range were identified, and each such stratified unit was sampled with at least five plots.
Baseline forest was also identified to represent area without afforestation or treatment. These were proxy areas or patches of forest representing situations with no afforestation or treatment.
2.1.1.1 Above-ground biomass.
Among the methods for estimating AGB, the most commonly used method is the “Plot method”. In this study, quadrats were laid and all trees > 1.5 m in height or > 10 cm in girth were enumerated. Once the tree plots are laid, smaller sub-plots were marked and located within the larger tree plot to study the shrubs and regenerating seedlings. The parameters monitored include: the species name, height and girth (130 cm above the ground) of each tree, diameter of sapling or shrub (approximately 130 cm above ground). AGB was estimated using height and diameter at breast height (DBH) data in the following manner:
Step 1: Locations and plots representing baseline scenario land categories were selected.
Step 2: Quadrats were laid for enumerating trees.
Step 3: Girth/DBH of trees was measured using metallic tapes, and the diameter of the shrubs was measured using slide calipers. Visual approximation method was used to estimate the height of the tree.
Step 4: Basal area was estimated for the sample plots and per unit area (m2/ha-1).
Using DBH values, basal area was estimated for individual trees and aggregated across species within a plot. Cross-section area of sample plots of a vegetation type was aggregated and further projected per hectare.
Step 5: AGB was estimated using biomass equations.
Allometric equations were used to convert DBH and height values of trees into biomass in volume (m3/ha). Species-specific equations, obtained from the Forest Survey of India (FSI) (1996) and Andhra Pradesh Forest Inventory Report (2010) were used, where available along with generic equations. The volume estimates of biomass were converted to t/ha using wood density values. The AGB was then converted to tonnes of carbon/ha, using a value of 0.45 of biomass as carbon content, as per the IPCC (1996) Guidelines.
2.1.1.2 Below-ground biomass.
Based on estimates for AGB and using a conversion factor of 0.26, BGB was estimated (IPCC, 2003).
2.1.1.3 Soil carbon.
Soil samples were collected at two depths, 0-15 and 0-30 cm in quadrats laid for tree biomass measurements. The multiple soil samples collected were combined to give a composite sample. This sample was analyzed for SOC density in the laboratory using the Walkley–Black method.
2.1.2 Mitigation or project scenario.
The project or mitigation scenario represents estimation of carbon benefits or the changes in carbon stock due to project implementation. To understand the potential that could be achieved in terms of AGB, sites representing the dominant afforestation and reforestation (A&R) models implemented under the project were selected. Under the mitigation scenario also, three carbon pools – AGB, BGB and soil carbon – were estimated using methods identical to the baseline scenario (refer to Section 2.1.1).
3. IPCC three-tier approach to carbon mitigation estimation
The IPCC (2003) and 2006 Guidelines present three hierarchical tier methods that range from use of default emission factors and simple equations to the use of country-specific data and models to accommodate national circumstances. A tier represents a level of methodological complexity and shift from lower to higher tier is associated with increased complexity, data requirements and accuracy, ultimately reducing uncertainty of the estimates:
Tier 1 is the simplest and basic method to use, requiring minimal data. Estimates are made using global default values and are associated with high uncertainty.
In this study, carbon stocks are estimated by using default carbon density values from the IPCC for current land use and projected or land use systems.
Tier 2 uses the same methods or equations as those used in Tier 1, but country- or region-specific data.
Regional defaults obtained from literature from the region and the same used for estimating the carbon mitigation potential.
Tier 3 uses higher-order methods, including models. These higher-order methods provide estimates of greater certainty than those obtained from the lower tiers.
Combining the tiers – Although it is desirable to adopt higher tiers for all land categories and carbon pools, it may not be feasible due to data and resource limitations. The next best approach is to adopt a combination of tiers for increasing the accuracy of the estimates.
The biomass and SOC values were derived from project locations through cross-sectional field measurements. Areas subjected to different afforestation models are sampled, measured and carbon stocks estimated. Total carbon stocks for current and projected land-use systems and area are calculated.
Models for projecting carbon stocks of future years incorporating data gathered through cross-sectional field studies adopted.
3.1 Multi-model-based carbon stock projections
Models are simplified versions of a system used to estimate and project certain features or functions or outputs of a system. Models are used to make projections of carbon stocks in forests, plantations, grasslands and cropping systems. Models are often based on several assumptions about data and quantitative relationship between input variables and output values. Thus, model outputs are often characterized by uncertainty due to assumptions made about the relationships between variables.
3.1.1 Features of models used in this study.
Several models are used for estimating and projecting changes in carbon stocks and growth rates. These models vary in data requirements, process adopted, outputs generated and their application. In general, all the models can be used for determining the stocks of or growth rates of carbon pools. Three of the models already in use for such purposes and their features and applications are summarized in Table I.
3.1.2 Selection and steps in applying models.
The models estimate the change in C-stock annually under the baseline and mitigation scenarios. Adopting the C-stock change method to estimate the C-pool increment, mathematically, the change in carbon stocks attributable to a project (Δ Cnet) at any given time can be expressed as: Equation 1
where, ΔCnet (tCO2/ha)= Net anthropogenic GHG removals by sinks for the selected period and ΔCco2 = Net anthropogenic GHG removals by sinks at time “i” to “n”.
The broad steps adopted for estimating the carbon stock changes in the baseline and mitigation scenarios and the incremental carbon stocks are as follows:
Step 1: Define land use categories relevant to baseline as well as mitigation scenario.
Step 2: Define baseline area under different land categories for a selected base year and project the area under this category annually for future years up to, say, 2020 or 2030 or 2050.
Step 3: Identify and estimate the area brought under different afforestation or plantation models.
Step 4: Estimate carbon stocks in soil and vegetation under baseline scenario.
Step 5: Generate data needed for the model to project carbon stocks under the mitigation scenario for each afforestation model.
Step 6: Run the model and generate outputs.
In this analysis, the comparative estimates are made for three afforestation models implemented in the AP CFM area. They include teak, eucalyptus and Non-timber forest products (NTFP)/mixed species plantations.
3.1.3 Input data for analysis.
Input data based on default values (for carbon fraction, root:shoot ratio, wood density) used in the models is given in Table II.
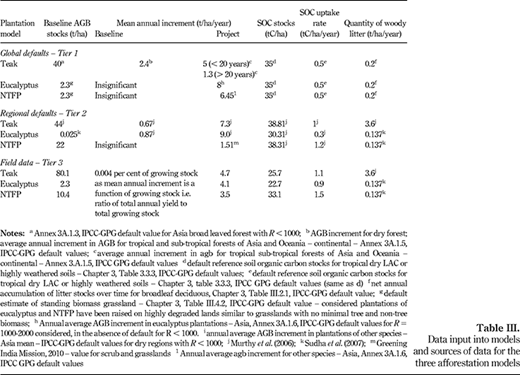
Specific data requirements for the three models discussed in Section 3.2.1 are varied, and Table III presents the same following the IPCC three-tier approach. As can be seen from Table III, there are some common data inputs, irrespective of the model used. They include data on strata, total area afforested, the phasing of planting and area planted during different years, the carbon density and root:shoot ratio. Data on wood density and biomass expansion factor are however needed as input only into TARAM and CATIE, while carbon pricing details are needed for the PROCOMAP model.
4. Comparison of multi-model estimates and lessons learnt
4.1 Estimates of mitigation potential
The mitigation potential estimates are made using the Tier-3 modeling approach of IPCC, but using a three-tier input data sources for the model. The three-tier data sources are identical to the IPCC three-tier approach. Three sets of outputs or mitigation potential estimates are presented in this section for the three models and they include:
global defaults as input data into models;
regional defaults as input data into models; and
field measurement (based on cross-sectional studies) data as input data into the models.
In this section, we compare the carbon mitigation estimates, as well as data input requirements, their availability and the various other parameters that determine the outputs from the models. The per hectare estimates based on default values – global and regional, as well cross sectional field studies, are presented in Figure 1. The net change is the difference between the baseline and project estimates. The mitigation potential per hectare of the different project activities, considering the different models and tiers adopted for estimation of carbon stocks are presented in this section.
4.1.1 Using global default values or Tier 1.
The mitigation potential of A&R activities is estimated using the AGB, BGB (estimated using default root:shoot ratio) and soil carbon values from IPCC GPG default values. The carbon stock change per hectare for the various project activities under baseline and mitigation scenario for 2030 is given in Figure 1.
The carbon increment under baseline for all eucalyptus and NTFP plantation models is insignificant (assumed at 0.001 tC/ha/year), as degraded lands are used, and for teak, it is 2.4 tC/ha, as improved practices are implemented in existing teak plantations. The mitigation potential per hectare for the 30-year period, as projected by the three mitigation models for teak, ranges from 257 tCO2/ha by TARAM to 284 tCO2/ha by CATIE. The estimates of PROCOMAP and TARAM using defaults are comparable while CATIE estimates are higher. The trends are similar for the other two plantation models.
4.1.2 Using regional default values or Tier 2.
The mitigation potential is estimated using regional values (largely from Andhra Pradesh) for stocks and increment of biomass and soil carbon stocks and defaults for root:shoot ratio and carbon density. The mitigation potential per hectare for the 30-year period for the three plantation models ranges from 438 to 517 for teak, 22-134 for eucalyptus and 27-152 for NTFP (Figure 1). The estimates of PROCOMAP as compared to TARAM are slightly higher for all the mitigation options with significant differences in estimates of TARAM and CATIE; for example, the carbon stock for 2030 for teak under TARAM is 428 tCO2/ha, and for CATIE, it is 517 tCO2/ha for the project scenario (PRJ).
4.1.3 Using cross-sectional field data or Tier 3.
The mitigation potential per hectare is highest for teak, followed by NTFP and finally eucalyptus across all three mitigation models. In this tier also, the estimates of PROCOMAP and TARAM per hectare are comparable for long rotation teak and NTFP models, while for Eucalyptus, the estimates are comparatively lower by TARAM and least by CATIE (Figure 1). There are significant differences between TARAM and CATIE estimates; for example, the C-stock for 2030 for teak under TARAM is 345 tCO2/ha and for CATIE it is 284 tCO2/ha for the PRJ, similarly for NTFP model also.
4.2 Lessons learnt
Climate mitigation through forest sector has several methodological and technical limitations and the uncertainty of estimates of carbon emissions are presumed to be high in this sector due to problems of definitions, biophysical variations that lead to varied estimates, limitations of methods or availability of multitude of methods to choose from, limitations of data and accounting issues involved. Here, we discuss some of these issues and lessons learnt during field studies and use of three mitigation estimation models:
Baseline development: establishment of a baseline scenario is critical to accurately estimate carbon benefits. Field visits provided information with regard to land categories taken up for different mitigation options or plantation models and cross-sectional field studies helped generate reliable information on baseline. However, there were limitations of non-availability of a baseline land category or an untreated area close to area sampled as representative for project area.
Leakage: leakage is not an issue for projects implemented in drier regions and in highly degraded forest lands or wastelands, with no or insignificant biomass.
Technical capacity needs: among the three models used in this study, CATIE is the lighter version with an inbuilt option of considering defaults in cases where national or project specific input data are unavailable. It is user-friendly and has drop-down menus with multiple options at every step to choose from. However, the choice of the right default is dependent on the knowledge of the ecological and climatic zonations, the growth pattern of species included in the afforestation model and several other factors. Thus, highly scientific expertise is needed for the use of CATIE for selecting the appropriate input values. PROCOMAP on the other end of the spectrum does not have pre-defined defaults available and it is the users’ discretion and knowledge that comes into use. TARAM has an option of including defaults for few parameters. However, PROCOMAP and TARAM have no drop-down lists available for selection of default parameters, depending on suitability to the region, climate and species under consideration.
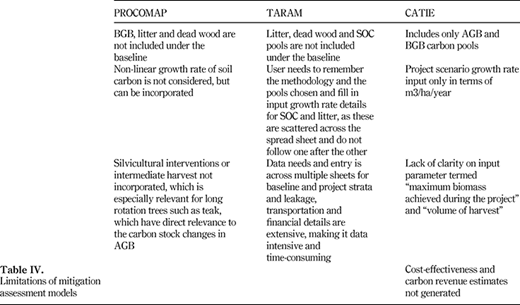
Model limitations: in estimating the carbon stocks and changes, there are limitations of the mitigation models used (given in Table IV below).
Growth rates of carbon pools: Long rotation species such as teak or NTFP models do not grow at the same rate all through its life span. Considering this, the long rotation module of PROCOMAP has the option of inputting dynamic growth rates. However, CATIE and TARAM models assume a linear or constant growth rates for the whole rotation period. Further, there are limitations with respect to availability of data on growth rates of different carbon pools for different mitigation options or forestry activities:
Tier 1: Global defaults available for Tier 1 estimates are for natural forests and monoculture plantations. There are no defaults available for inputting data on stocks and growth rates of biomass in baseline for degraded forest lands and wastelands. SOC stock and uptake rates for the same land categories are also lacking globally for baseline vegetation conditions.
Tier 2: The data on stocks and growth rates of biomass and particularly SOC are highly limited at the national and/or regional level for adoption of Tier 2 approach for carbon stock projection estimates. Growth rates, if available, are only for certain commercially or economically important forestry species, and data for non-commercial forest tree species and mixed species-forests/plantations and naturally regenerating forests are lacking. Further, there is no database available for BGB and woody litter and SOC. Even at the regional level, biomass and soil stocks and growth rates for degraded lands and wastelands are very limited and largely lacking for most regions of India.
Tier 3: Limitations of this tier involve accurate identification and selection of sample plots reflecting the baseline and project scenarios across a larger area that is varied in soil type, rainfall and other physiographic parameters. In addition, at times, non-availability of areas reflect baseline, as well as project scenario, in the same locations.
This study attempted to adopt the three-tier approach to mitigation potential assessment using multiple models. However, during the conduct of the study, it was evident that field ecological studies across several forest ranges, forest division and districts and climatic conditions are intensive and time-consuming. Data were provided by the State Forest Department on area brought under different models and the phasing of the same helped identify districts with large areas brought under a model. However, the following data limitation exists:
Information or data on district or range-wise extent of area brought under various plantation models was or were not available to the team.
At the forest range and village level, which was the smallest unit of sampling, selection of plot locations was limited by the non-availability of documentation on area, actual locations and phasing (year of planting) of different afforestation models.
Discrepancies in reference to afforestation model with different names at the state and forest range and village (VSS) level made it difficult for the field team to correlate the two.
Failure to locate baseline areas or plots for different models within the VSS sampled or in nearby VSS due to lack of understanding of the field staff about baseline and at times unavailability of area not brought under a plantation model or treatment.
Species identification with local experts was achieved. But reference to a single species by different local names across districts made it difficult while referring to local floras.
5. Conclusions
GPG2003 provides three methodological tiers for estimating GHG emissions/removal. Tiers correspond to a progression from use of simple equations or methods with default data to country-specific data in more complex national systems. The adoption of a multi-tier approach allows selection of a method best suited for specific capabilities and data availability, while simultaneously ensuring scientific transparency and environmental effectiveness.
Conducting field studies and modeling for estimating carbon benefits from forestry projects at the regional level, in this case, the state of Andhra Pradesh shows that there are challenges in moving from lower to higher tiers:
First, baseline scenario plots or locations are not most often not available and are not identified and maintained as control plots by project authorities for comparison.
Second, project authorities rarely measure or monitor and record data on carbon stocks under baseline conditions according to different pools, not even for AGB.
Third, biomass (allometric) equations are available only for a few commercially important species, often prompting use of generic equations for many species, which leads to high uncertainty.
Fourth, IPCC-GPG and IPCC-2006 guidelines do not provide default values for baseline scenario conditions for any carbon pool for degraded land, degraded forest or grass or cropland, forest under different stages of degradation, etc., often leasing to reliance on national default datasets, which, in this case, are unavailable.
Fifth, data on gain and loss of carbon stocks of different pools are required for mitigation assessment, but measuring the loss of biomass due to extraction, grazing and fire is complex.
Sixth, existing mitigation models have to be validated for local conditions.
Finally, all the input data required for a given model may not be available at the national/regional level, forcing the use of global defaults, thereby increasing the error or uncertainty, which is not provided by the models used in this study.
This study, thus, highlights the strength and weaknesses and/or limitations and advantages of adopting the different approaches and their applicability for estimating mitigation potential of a forestry project. The same could be adopted for a future REDD regime also, given countries may not have the necessary technical capacity and data needed during the post-2012 REDD scheme. While countries with advanced data, technical and research capabilities could use models or, in other words, adopt the Tier 3 approach, countries with data and technical limitations, as highlighted in the case of the AP CFM project in Andhra Pradesh, India could adopt a Tier 2 or Tier 1 approach and slowly transition to higher tiers as data becomes available.

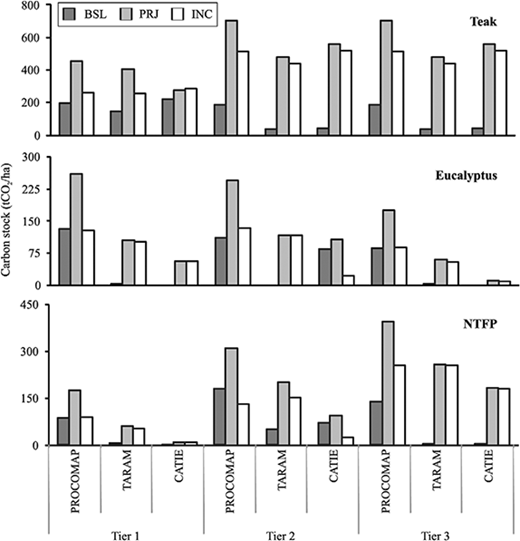
Baseline, mitigation and incremental carbon stock change per hectare for three plantation models using the IPCC three-tier approach for 2030
Baseline, mitigation and incremental carbon stock change per hectare for three plantation models using the IPCC three-tier approach for 2030
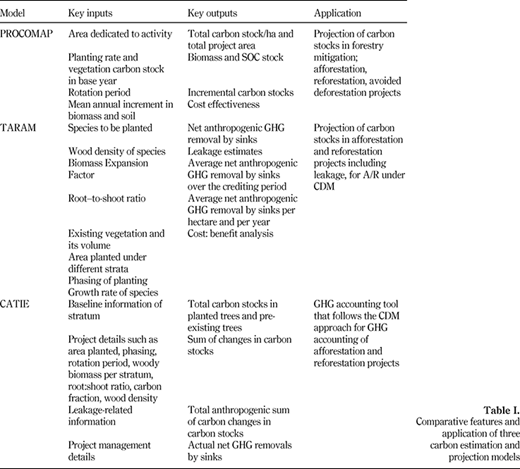
Comparative features and application of three carbon estimation and projection models
Comparative features and application of three carbon estimation and projection models

Details of area, phasing, rotation period and other parameters common to PROCOMAP, TARAM and CATIE models
Details of area, phasing, rotation period and other parameters common to PROCOMAP, TARAM and CATIE models
References
Further reading
About the authors
Indu K. Murthy is a research scientist at the Indian Institute of Science, Bangalore, India. She has been working on issues of climate change mitigation and adaptation in the forest sector for the past decade. She is also a field ecologist monitoring vegetation under a changing climate and under different management regimes in evergreen and moist deciduous forests of Western Ghats, India. She has been actively involved in coordination and field implementation of projects spanning community forest management and its implications for ecology and economy of forests and forest dependent communities, citizen science project on monitoring vegetation in long-term forest monitoring permanent plots and in vulnerability profiling and development of adaptation strategies increasing climate resilience in communities and systems exposed to current climate risks. Indu K. Murthy is the corresponding author and can be contacted at: indumurthyk@gmail.com
Rakesh Tiwari is working with Environment Defense Fund as Low Carbon Farming Specialist as part of the Fair Climate Network’s low carbon farming initiative in Southern India since three years. He is involved in developing methodology for small holder agriculture mitigation projects and is measuring nitrous oxide and methane abatement potential across major crops spanning three states. Earlier, Rakesh was part of Indian Institute of Science working on climate impacts and vulnerability assessment and natural resource management.
G.T. Hegde has worked extensively in the tropical forests of India. He is a field biologist with two decades of experience in the forests of Western Ghats, India.
M. Beerappa has a Masters in forestry and worked as a field ecologist on a citizen science project training bankers in vegetation monitoring in permanent vegetation plots in Western Ghats, India. He is currently under training to be a forest officer for the Government of Karnataka.
Kameswar Rao is a Professor at the Department of Environmental Science, Andhra University, Visakhapatnam, India. He has worked extensively on ecological aspects of community forestry in India and guided several students for their doctoral degree.
N.H. Ravindranath is a Professor at the Indian Institute of Science, Bangalore, India. His research interests include climate change – impacts, vulnerability and adaptation to climate change, mitigation options in forest sector, GHG inventory in AFOLU sector, Clean Development Mechanism and Reducing Deforestation and Forest Degradation. He is an author for eight books, out of which four books are on climate change. He has contributed to research on “Climate Change and Forests” at national and international levels. He is an author for ten IPCC Assessment Reports during the past 15 years, including the latest IPCC Report, 2014 (due for release).
The authors thank the World Bank for funding this project. They profusely thank the AP Forest Dept, in particular Mr Ramesh Kalghatgi (The PCCF), his colleagues in Hyderabad and, more importantly, his colleagues and field staff at the Forest Division and Range level. They also thank the staff of Vanasamakhya and CPF for assistance in field work. This work was carried out at the Centre for Sustainable Technologies, Indian Institute of Science, Bangalore, India.

