


– A current estimate of the cost of reducing the concentration of carbon dioxide in the atmosphere by Ocean Nourishment is provided. A scenario of fertilisation of the ocean in regions of excess phosphorous, carried out using a ship to distribute ammonium hydroxide, is examined.
– Ocean fertilisation could be deployed to draw down the carbon dioxide already in the atmosphere and store it for millennia in the deep ocean.
– The costs of fertilising the ocean with macronutrient depends mostly on the cost of producing the nutrient and the cost of its delivery. Macronutrient fertilisation has been calculated, for a particular scenario, to cost US$20 per tonne of carbon dioxide emission avoided for 100 years.
– There is a collateral benefit of increased fish stocks, which is not considered here. The ocean, plausibly, has the capacity to sequester more than one Gigatonne per year of carbon (∼3.7 Gt CO2/yr) via macronutrient fertilisation.
– This modest cost of reducing climate change justifies further research and development of ocean macronutrient fertilisation.
– The modest cost allows climate change to be addressed without serious economic disruption.
– The study reported is a contribution to mitigation of climate change.
1. Introduction
The dangers associated with climate change due to rising carbon dioxide concentration in the atmosphere is encouraging the search for low cost, low risk, large capacity technologies able to mitigate the causes of climate change. A large number of strategies to manage climate change have been reviewed in Jones (2011a), while ECOR (2011) has looked more narrowly at enhanced carbon storage in the ocean. They concluded that ocean fertilisation was the most promising of the ocean carbon storage options. The UK Royal Society (2009) examined what they called geoengineering, dividing the approaches into carbon dioxide removal techniques and solar radiation management techniques. In this paper, we look at the costs of macronutrient fertilisation of the ocean – a carbon dioxide removal technology. The concept of mitigating carbon dioxide in the atmosphere by adding the macronutrient nitrogen to those areas of the ocean with sufficient phosphorus but inadequate nitrogen to support phytoplankton growth was first mooted by Jones (1996). Later, the idea was generalised to the addition of both nitrogen and phosphorus. Also, recognition was given to the potential benefit to fish stocks that macronutrient fertilisation might provide.
Investment in research on any carbon mitigation technology has been low, in part, because the solutions were perceived to be too costly to be endorsed by the consumers of energy. It is valuable to provide realistic price estimates of mitigation technologies, as this provides an important element in the ranking of concepts worthy of further investment in research and development.
To distinguish macronutrient fertilisation from iron fertilisation, the injection of nitrogen into the upper ocean to sequester carbon away from the atmosphere has been termed Ocean Nourishment. The storage of carbon in the ocean comes about by supplementing the limiting nutrient of the surface ocean. This augments the production of organic carbon and increases the carbon cycle in the ocean. Solar radiation provides the energy needed by phytoplankton to utilise the ocean nutrients. Some phytoplankton are exported when they die and fall to the deep ocean, while some are remineralised in the surface ocean into ammonia and urea. These nutrients are reused in the surface ocean by new phytoplankton. Eventually, the exported carbon and nitrogen returns to the surface ocean where the carbon re-enters the atmosphere, and the nitrogen mostly stays in the water to again take up carbon and maintain the sequestration. Some nitrogen is lost and this allows some of the initially stored carbon dioxide to leak from the organic carbon cycle.
Reactive nitrogen, in the form of ammonia, if used to augment the organic carbon cycle, can be produced using air to supply the nitrogen, water to supply the hydrogen and energy to drive the reaction. Ships can then carry the nutrient to sites over deep water where the nitrogen is injected into the surface ocean. Deep water is chosen to avoid producing anaerobic conditions (discussed in Jones and Harrison, 2013). The nutrient is spread at low mass per square meter over the sea surface to reduce the risk that a micronutrient might become limiting and also to reduce the risk of encouraging harmful algal blooms. Satellites with colour sensors can detect the concentration of chlorophyll and, when combined with modelled or measured depth profiles of chlorophyll, be used to monitor the effectiveness of the nourishment process.
Ocean fertilisation has been of interest to the London Convention/London Protocol for ocean dumping, and in 2010, they asserted they had jurisdiction for ocean fertilisation and published a code of conduct and a methodology for assessing legitimate scientific experiments. This move towards governance of the fertilisation technology means that research into ocean fertilisation can proceed with confidence. However, before large sums of money are spent on research, some estimate of the cost and benefits of ocean fertilisation need to be undertaken.
Iron fertilisation has sparked public interest because of its perceived low cost. Harrison (2013) has examined the cost of iron fertilisation of high nutrient low chlorophyll regions of the ocean. This is some 30 per cent of the ocean surface with the largest region being the Southern Ocean. Harrison found the costs to be surprisingly high. Shoji and Jones (2001) costed macronutrient fertilisation for regions with unused phosphate in the surface ocean and found it was of the same order as suggested prices for the emission of carbon dioxide. This study is now more than a decade old and inflation has changed the costs, and a number of associated issues such as alternative delivery methods are now clearer. The process of macronutrient fertilisation compared with iron fertilisation has been reviewed by Jones (2011b), while the amount of carbon stored after 100 years as a result of macronutrient fertilisation can be estimated by the methodology presented by Lawrence (2013). Lawrence provides the carbon sequestration efficiency of the additional organic matter produced in the upper ocean as a result of adding nitrogen in the form of ammonia, urea or nitrate. These are all chemicals which occur naturally in the ocean during the remineralisation of phytoplankton in the surface ocean.
The rising concentration of carbon dioxide in the atmosphere is making the surface ocean more acidic. Fertilisation pumps carbon dioxide from the surface to the deep ocean, increasing the acidity in the thermocline, but decreasing the acidity in the surface ocean where most of the economic benefits are obtained from the ocean. The nutrients used in fertilisation also influence the pH of the surface ocean. We do not discuss further the impacts of decreasing the pH of the surface ocean. Nor do we discuss the perceived risks of ocean fertilisation with macronutrients other than to point out that the research community have experience with 13 iron (a micronutrient) experiments and also have experience with the frequent injection of macronutrients by coastal upwelling systems. These systems support the large pelagic fisheries of Peru and other places. Subtle changes influence the species within each trophic level; for instance, the anchovy/sardine populations off Peru alternate, while different nitrogen compounds may influence the species of phytoplankton that prosper, including harmful algal blooms, Glibert et al. (2008).
2. The scenario costed
We consider the case of injecting, as a source of nitrogen, ammonia hydroxide from a ship in a seawater solution containing 25 per cent by weight of nitrogen. We assume ammonia is produced at a coastal location where the cost of seawater is negligible. Inputs of natural gas and electricity are available at the ammonia factory gate. The nourishment of the surface ocean takes place 500 kilometres distant from the ammonia plant in an oligotrophic region of the temperate ocean. Fertilisation is restricted to regions of adequate phosphate. The ammonia hydroxide is sprayed in a swathe 100 m wide from a fire hose nozzle able to spray 50 m each side from the ship. It is assumed that diffusion widens the swathe to 400 m after a few days.
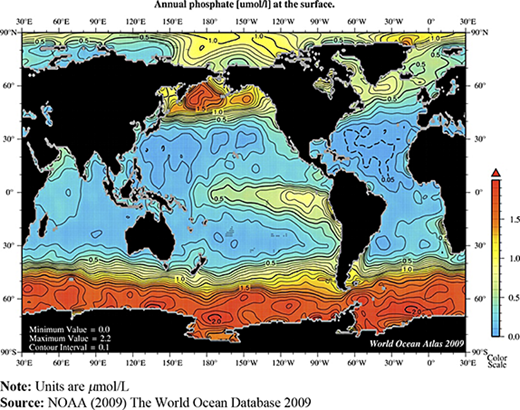
The desired amount of nitrogen per square kilometre to be sprayed on the ocean has been discussed by Judd et al. (2008). Too much ammonia will lead to a high concentration of phytoplankton before the nitrogen is exhausted, with consequent shading; too little ammonia leads to increases in phytoplankton too small to stand out from the natural variability of the unnourished water. We will see that the initial concentration chosen is an important variable in determining the cost of macronutrient delivery. The average composition of organic matter in the sea is remarkably constant. The ratio, known as the Redfield ratio, can be used as a guide to the amount of phosphate needed to be present in the surface mixed layer for phosphorus not to become the limiting nutrient before all the nitrogen added is consumed. The traditional stoichiometric ratio of C:N:P:O2 by moles is 106:16:1:−138. A target for injection is an “initial” concentration of 3.2 μmol/L of nitrogen. The Redfield ratio predicts greater than 0.2 μmol/L of P would also need to be present for P not to become limiting. If we confine ourselves to regions where P is 0.2 μmol/L or greater, we find large areas that are shown in Figure 1, are able to support the proposed level of fertilisation.
When one tonne of carbon is exported from the surface ocean, the impact on the atmosphere is the same as one tonne of carbon dioxide was not emitted to the atmosphere. The unit we will use to measure the storage of carbon is tonnes of CO2 emissions avoided. For unit of cost we will use year 2010 US dollars.
3. Sequestration efficiency
The ammonia hydroxide needs to be injected into a region of the ocean that has a negligible concentration of nitrogen in the upper ocean. We expect all the ammonia that remains in the photic zone to be converted to organic material, as the sharp gradient in density found at the base of the ocean surface mixed layer inhibits mixing.
In steady state Capone (1996) pointed out that remineralisation in the deep ocean should approximately equal new primary production. In other words, all the carbon converted in new primary production to organic matter in the photic zone is expected to be exported to the deep ocean after some period (Sarmiento and Gruber, 2006, p. 120). However, it does not stay there for ever. Lawrence (2013) has suggested that there are a number of mechanisms of loss of exported carbon dioxide, such as upwelling to the atmosphere in less than 100 years. These losses combine multiplicatively to a value less than 15.2 per cent of the exported carbon. Included in this value is the effect of nitrous oxide generated. This powerful greenhouse gas has been considered a loss before 100 years despite the long period before some of the nitrous oxide reaches the atmosphere.
We have taken the case where the phytoplankton assemblage produced contains 5 per cent coccolithophores. Such phytoplankton are less efficient at exporting carbon because, paradoxically, they contain calcium carbonate. Unlike the other losses, the fraction of the added nitrogen converted to coccolithophores can be measured for the new primary production. The global average fraction of new primary production in the form of coccolithophores is (Gregg and Casey, 2007) 1.5 Mt of CaCO3 per year or 1.5 × 12/100 = 0.18 Mt C/yr.
The combination of the carbon dioxide generated in forming the added nutrients and the CO2 generated in delivering the nutrient provide an additional 10.9 per cent loss (Lawrence, 2013). Overall, the efficiency is then 73.9 per cent, say 70 per cent. If, to recognise a measure of uncertainty, we increase the five factors that go to make up the losses identified by Lawrence (2013), each by 20 per cent, the 100-year storage efficiency becomes 53 per cent. We need to use the Redfield ratio of C:N:P of 106:16:1 by atoms to convert the carbon dioxide stored to the nitrogen added. It is recognised that there are variations of the Redfield ratio with location (e.g. Körtzinger et al., 2001). Generally, tropical waters have higher C to N ratio than the global average. The stoichiometric ratio of CO2:N by weight incorporated into organic carbon is 44 × 106:14 × 16 = 20.2:1. Using an efficiency of 70 per cent, 1 tonne of N sequesters 20.2 × 0.7 =14.1 t CO2 for more than 100 years. At an efficiency of 53 per cent, this provides the ratio CO2:N as 10.7:1.
The carbon dioxide generated in the ammonia manufacture has been considered by Lawrence (2013) and is similar for all modern ammonia plants, but the CO2 generated by the ship depends on a number of issues. Lawrence uses only a 1 per cent offset. A 4,000 tonne DWT chemical tanker burns about 7.5 t of fuel per day. Using data from the US Energy Information Administration (USEIA, 2011) to provide a value of 2.81 t CO2 per tonne of fuel consumed, the ship is expected to emit 21 t of CO2 per day compared with 14 × 100 t of CO2 mitigated by the ammonium hydroxide per day. It represents about 21/1400 = 1.5 per cent. This is a little greater than calculated by Lawrence (2013), and we will ignore this difference.
4. Transport costs
We will cost the option of transport of the nitrogen by chemical tanker from the coastal ammonia plant to the injection site. A tanker of 10,000 tonne capacity has an operating cost of about $30,000 per day, which can be deduced from the spot prices presented by ICIS pricing (Lester.Teo@icis.com, Feb 2012) and adjusted slightly for inflation from the year 2000. We will assume the costs of using the chemical tanker can be partitioned as crew $10,000, capital $10,000 and fuel $10,000. If the tanker travels at 20 km/hr, it can traverse a path of length 500 km in a day. If the nutrient is mixed to the base of the surface mixed layer by convective overturning (say 50 m) and if it provides ammonia hydroxide over a swathe 400 m wide, the volume is 10 km3 per day. For this volume, one needs 450 t of N per day to achieve a concentration of 3.2 μmol/L. We distribute 450 t N or 1,800 t of liquid per day. At this rate, the ship can empty its tanks in 5.5 days and with two days travel time and one day reloading giving a cycle time of 8.5 days.
In 8.5 days, our ship distributes 2,500 t of nitrogen, which, as shown above, sequesters 14 times its weight in CO2. One trip sequesters 2,500 × 14 = 35,000 t CO2. The trip from the ammonia plant costs 8.5 × 30,000 US dollars, giving a cost of 255,000/35,000 = $7.3 per tonne CO2.
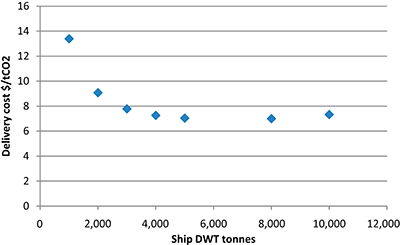
Would a smaller ship provide a lower cost per tonne of nitrogen delivered? To see the impact of ship capacity, we use the simple model that the crew costs the same regardless of dead weight tonnage (DWT) of the ship, the capital cost is proportional to the DWT and the fuel expenses are the 2/3 power of the DWT. As shown in Figure 2, which follows this model, there is a broad minimum cost of about $7 per tonne CO2 for chemical tankers of a few thousand DWT.
5. Ammonia cost
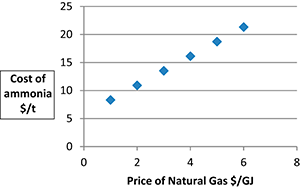
The spot market price of ammonia varies wildly and is much influenced by supply and demand. During 2009 the spot price varied from $100 per tonne of ammonia to $300 per tonne. Between 2010 and 2012, ammonia varied from $300 to $600 per tonne. For a long-term operation, spot price is not a suitable metric, as it more reflects scarcity than the cost of production. Instead, we follow Shoji and Jones (2001) who used the cost of manufacture to provide a cost estimate of the expense of using ammonia as an injected nutrient. They found the cost of producing a tonne of ammonia gas in US dollars 2,000 was 11.3 + 30 × NG, where NG is the cost of natural gas at the factory gate in $/GJ. With capital costs included this is 66 + 30 × NG in US dollars 2010. As ammonia contains 14/17 tonnes of nitrogen per tonne of ammonia, the nitrogen cost of manufacture becomes 80.1 + 36.4 × NG.
The cost of natural gases is very dependent on the location and fluctuates with demand. The impact of gas price is shown in Figure 3. The discovery of coal seam gas is putting a downward pressure on the market price in many locations.
If we take $2 per GJ for natural gas, ammonia hydroxide costs $152.9 per t N. With the above 70 per cent storage efficiency (1 t N stores 14 t CO2 at 100 per cent efficiency), we can estimate the cost of just the nitrogen to be equivalent to a carbon dioxide emission price of US$10.9. For the case in which each loss is increased by 20 per cent (storage efficiency reduced to 53 per cent), the corresponding emission price is US$14.4.
6. Overheads
As the operation of the ammonia plant and the management of the ship are included in the prices above, an overhead of 5 per cent may be suitable. There is need for managerial, technical and administrative staff.
If a Ocean Nourishment operation involved only one ship distributing 450 t N/day at a CO2 storage value of $20 per tonne, the income would be 450 × 14 × 20 = $126,000 per day. For about 250 days operation per year, the 5 per cent overhead is $126,00 × 250 × 0.05 = $1,575,000. This might not be enough to support the staff needed. However, the operation of a few ships would make an overhead of 5 per cent appropriate.
7. Fish stocks
Ocean Nourishment will have an impact on both the atmosphere and the ocean. In the atmosphere, fertilisation will draw down atmospheric CO2 as many iron fertilisation experiments have shown (de Baar et al., 2005).
In the surface ocean, concentrations of phytoplankton will rise after nourishment, and the extra organic carbon will flow through the marine food chain. Jones and Renilson (2011) speculated that some 0.3 tonnes of extra wet weight of small pelagic fish will be produced for each tonne of nitrogen distributed. By injecting the nitrogen over deep water adjacent to established upwelling regions, one expects the traditional fish stocks to colonise the adjacent waters that have been nourished. This potential benefit is not included in the income from nourishment calculated here.
8. Price per tonne
We are now in a position to calculate the cost before tax and profit per tonne of carbon dioxide avoided. We simply add production and transport costs and allow for efficiency. If natural gas is $2 per GJ at the factory gate and overheads are 5 per cent, the lowest cost is 1.05 (10.9 + 7) = $18.8 per tonne CO2 avoided. Making a small allowance for contingency, let us say a total cost of $20 per t CO2 avoided.
To provide a measure of the uncertainty in the cost, consider the case in which each loss is increased by 20 per cent. This results in a cost of 1.05 (14.4 + 7) = $22.5. Alternatively, doubling the initial concentration of ammonia hydroxide on the ship reduces the cost by approximatley 20 per cent. If required, the ammonium hydroxide can be diluted with seawater prior to distribution from the ship.
Australia is a country that has set a price on carbon dioxide emissions and is a large consumer per head of electricity. The cost of performing Ocean Nourishment of $20 per tonne of CO2 can be compared with the price of AUD$23 levied on greenhouse gas emissions in Australia from 1 July 2012 (de Baar et al., 2005).
9. Capacity
It was considered unlikely by Pacala and Socolow (2004) that a single technology could reduce carbon dioxide emissions to a level of acceptable climate change risk. They proposed multiple technologies each contributing one or more wedges of abatement, that is, mitigation starting at 0 GtC/yr and rising to 1 GtC/yr in 50 years. There appears to be no difficulty in producing the ammonia needed for one abatement wedge that stores 1 Gt C/yr by the year 2060. Jones (2001), in examining the impact of large-scale enrichment of the surface ocean, found that the natural gas needed was 5 per cent of the consumption in the year 2010. In 2012, there is a much larger reserve of natural gas available and the International Energy Agency suggests that 190,100 GJ of gas is available worldwide, enough to last 60 years at the present rate of consumption. Nor is the capital required to produce the 262 Mt N/yr very large.
Fischedick et al. (2011, p. 829) found the annual CO2 reduction potential of wind power in 2050 lies in the range of 0.4 Gt C/yr (lower case) to an optimistic 2.6 Gt C/yr, depending on the scenario examined. This is of the same order as can be achieved using Ocean Nourishment.
Phosphorous provides a different picture since 1 Gt C/yr of storage requires 6.6 Mt P/yr (by weight) if photosynthesis is in the Redfield Ratio. The surface mixed layer has a residence time of order ten years (Jones 2011a), while the upwelled excess phosphorous is estimated by Sarmiento and Gruber (2006) as 2.9/16 = 0.18 μmol/m3. That is to say that there is excess phosphorous to that needed to combine in the Redfield ratio with the nitrogen upwelled. Assuming upwelling of 38 Sv after Sarmiento and Gruber (2006, p. 13), there is 6,000 mol/sec of phosphorus brought to the surface ocean. This is 5.8 Mt/yr. Some of this phosphate is used by cyanobacteria, while rivers provide some new phosphorous. To be prudent, one might add mined phosphate as one moved up the greenhouse gas abatement wedge.
Another limitation to the amount of nourishment that it is prudent to undertake is its impact on ocean oxygen. In regions of large nutrient input, there are so-called dead zones where there are anoxic conditions. A consequence of increasing the new primary production is that oxygen will be consumed in the remineralisation process of the organic matter that rains down from the surface ocean. The remineralisation, which is concentrated in the permanent thermocline, consumes oxygen, which is in turn replenished as recently ventilated water replaces the oxygen reduced water. If the amount of ocean fertilisation followed one wedge, in 2060, the extra new production will consume 138 × 32/106 × 44 = 0.95 Gt O/yr. To assess the limitations that this might place on the amount of carbon stored in 2060, we can note that the oxygen below the oxygen minimum is according to Weyl (1992) 1.28 × 10³ Gt O2. Thus, for the year 2060, 0.07 per cent of the oxygen might be lost. This is small compared with the difference between the Pacific and Atlantic Ocean oxygen concentration, Hartmann (1994, p. 195).
10. Conclusion
Emissions of carbon dioxide to the atmosphere are rising. Abatement of carbon dioxide in the atmosphere is needed to lower the risk of harmful climate change. The cost of storing one abatement wedge of carbon in the ocean for longer than 100 years by macronutrient fertilisation has been reviewed. The price of macronutrient fertilisation of the ocean is low enough to justify a strong R&D program to reduce the uncertainties and lower the environmental risks of Ocean Nourishment. This could lead to a viable mechanism for reducing the level of climate change over the coming decades.
References
About the author
Dr Ian S.F. Jones is an Ocean Engineer with 40 years professional experience. He has written 90 papers with the more recent ones examining aspects of Ocean Nourishment. His most recent book Engineering Strategies for Greenhouse Gas Mitigation was published by Cambridge University Press in 2011. Ian S.F. Jones can be contacted at: ian.s.f.jones@hotmail.com
The author would like to thank Daniel Harrison and Martin Lawrence for their discussions.

