


– This paper aims to identify and analyze the factors contributing to the decision of organizations to disclose carbon information, as well as its transparency level.
– The Tobit regression is used to analyze the results of the Spanish companies that were invited in 2012 to respond to the Carbon Disclosure Project (CDP) questionnaire. The results of this study are interpreted according to the legitimacy and stakeholder theories.
– The results show that the probability of carbon disclosure and its transparency level are explained by the influence of pressures from society, markets, shareholders and international interactions. In the Spanish case, the factors that have shown a stronger influence are the size of the company, financial risk, their listing in the IBEX35 and FT500 indexes and the ownership concentration.
– One of the main contributions of this study to the previous literature lies in the used research method. Thus, while previous studies analyze the factors that can determine whether companies disclose carbon information, this paper has also considered the quantification and differentiation of the effect of these factors on the probability of supplying this information, as well as obtaining a higher score in the CDP questionnaire, representing a higher transparency level in the information provided. For this objective, the usefulness of the Tobit regression is to be highlighted.
1. Introduction
Many organizations started to provide information on greenhouse gas (GHG) emissions in the mid-2000s and on their goals and strategies to contribute to their reduction (Pinkse and Kolk, 2009), which has been called, generically, carbon disclosure. In this way, organizations have tried to respond to the increasing social concern regarding the problem of climate change and its consequences (Bebbington and Larrinaga, 2008; Wittneben et al., 2012).
The mainly voluntary nature of social and environmental disclosure, which includes carbon disclosure, has led the researchers to study the reasons and factors involved (Deegan, 2002; De Villiers and Van Staden, 2006; Rankin et al., 2011; Peters and Romi, 2014). Most of these studies have been based jointly on legitimacy theory and stakeholder theory (Reverte, 2009), due to its complementary character (Gray et al., 1995; Milne, 2002). Thus, although the main argument of legitimacy theory establishes that companies disclose information to show their adaptation to social expectations and thus obtain legitimacy, stakeholder theory states that different stakeholders can have different expectations and interests. Managers of organizations can therefore manage their relationships with those stakeholders by disclosing information (Deegan, 2002; Mobus, 2005; Dumay et al., 2015).
The Carbon Disclosure Project (CDP) has become the main global reference in regards to the carbon disclosure provided by organizations (Luo et al., 2012; Matisoff et al., 2012; Lee et al., 2015). This project included over 300 institutional investors that, jointly, account for over 40 trillion Euros in assets. The questionnaire is currently being responded by over 4,000 companies globally. Based on the information provided by companies regarding different aspects of their climate change management (corporate governance, risks and opportunities, strategies, emissions inventory, communication and transparency), they are qualified from 0 to 100. A score above 70 points is considered high, and it is representative of the strategic focus and commitment of the organization to the fight against climate change, as well as the transparency of the information provided (CDP, 2010).
Previous research has mainly focused on CDP as an appropriate measure to study carbon disclosure, as, among other reasons, this type of information is public and, therefore, broadly available and it allows comparison between companies and sectors (Reid and Toffel, 2009; Luo et al., 2012). More specifically, previous literature has considered the factors conditioning companies to respond or not to the CDP questionnaire (Stanny and Ely, 2008; Luo et al., 2013). However, these projects have not considered whether these factors affect the score, which may be higher or lower, of the companies responding to the CDP as an indicator of the transparency level of the information provided (Tang and Luo, 2011; Matisoff, 2013).
Furthermore, in the case of Spain, carbon disclosure presents certain characteristics worth analyzing. Thus, the response rate of Spanish companies to the CDP questionnaire was 40 per cent in 2012 compared to 80 per cent globally, indicative of a lesser tradition of carbon disclosure at the Spanish level (CDP, 2012). Also, the severe economic crisis that Spain has undergone has affected the fight against climate change in this country. For example, one of the first measures taken by Spain’s new government, elected at the end of 2011, was to abolish incentive payments for renewable energies from 2012 onwards, which increased regulatory uncertainty regarding the fight against climate change in the country (González et al., 2015). This uncertainty is reflected in the responses provided by those companies which replied to the CDP questionnaire (CDP, 2012). Hence, it is worth considering whether these characteristics specific to Spain have affected the influence of the determinants of CDP carbon disclosure, which has been demonstrated by other studies carried out in other countries. Also, from the research perspective, the severe lack of carbon disclosure studies on Spanish companies should be noted (Prado et al., 2009).
With the purpose of covering this gap in the previous research, this paper considers the following research question:
RQ1. Which factors determine voluntary carbon disclosure and its transparency in the case of Spanish companies, and to what extent?
This paper contributes to the literature in several aspects. First, it delves into the study of the transparency of the carbon disclosure of organizations, responding to the request of other papers that highlighted the lack of literature in this area (Lee et al., 2015). In contrast to former studies that mainly use the multiple linear regression research method or binary logistic regression, this paper uses the Tobit regression, which considers the existing censoring of observations and allows us to analyze whether companies disclose carbon information, as well as their level of transparency and the quality of the information. Second, the study of Spanish companies allows us to avoid the bias found in many studies that only focus on large companies, as formerly highlighted by Borghei and Leung (2013), while considering other non-Anglo-American contexts, which is predominant in the literature (Reverte, 2009). In this sense, the disclosure of environmental information depends on the country, as there are independent studies in different countries that have revealed very different results (Gray et al., 1995; De Villiers and Van Staden, 2006). This, in itself, is reason enough to focus our study on Spain.
Based on the study of the responses to the CDP questionnaire from Spanish companies in the year 2012, and their score, the results prove that the companies having a higher probability of participation in the questionnaire and those expected to reach a higher score are the larger ones, with a higher financial risk and that belong to the FT500 index. Although there is evidence of the effect of other variables, such as the economic profitability of the company, its listing in the IBEX35 or the ownership concentration (OC), the quantitative weight is substantially lower than the former variables. This paper not only provides evidence on the influence of these variables on the decision of voluntarily disclosing carbon information but also contributes to the methodological development of the research topic by allowing us to elucidate the extent of the effect of each variable, an aspect which has not been considered in former studies regarding the factors determining the disclosure of environmental and carbon information.
This paper has been structured as follows. Section 2 presents the theoretical framework used to analyze the empirical information. Section 3 exposes the factors that may determine carbon disclosure and its transparency in Spanish companies. Section 4 presents the design of our research, and the empirical results are included in Section 5. Finally, Section 6 includes the discussion of results and the conclusions of the study, highlighting the possible extensions for future research.
2. Theoretical background
The most extended definition of legitimacy was created by Suchman (1995, p. 574), who defined it as “a generalized perception or assumption that the actions of an entity are desirable, proper or appropriate within some socially constructed system of norms, values, beliefs, and definitions”. Legitimacy is considered as a key resource for the survival of companies, as it represents the degree of cultural support received from their environment (Meyer and Scott, 1983). In this sense, companies require legitimacy to have the approval of their goals by society and therefore develop their activities and have better access to other types of necessary resources (Deegan, 2002). Furthermore, legitimacy is a dynamic resource that can change over time, which can lead companies to develop different strategies to obtain, repair or maintain their legitimacy (Suchman, 1995).
As legitimacy resides in people’s minds and their perception has a significant influence (Breton and Cote, 2006), the revelation of information thus becomes an essential element in legitimacy strategies (Magness, 2006; Bebbington et al., 2008). In this sense, as Deegan (2002) states, disclosure of corporate information represents an important means through which managers can influence the external perceptions of the organization.
In the study relating to the disclosure of environmental information and legitimacy, it is patent that when the legitimacy of organizations is threatened, they tend to increase their level of disclosure (Patten, 1992; Deegan and Rankin, 1996; Cho et al., 2012). Likewise, even when companies adapt to the social expectations in regards to the environment, their legitimacy can be threatened if the companies fail to show their compliance through the disclosure of environmental information (Newson and Deegan, 2002; De Villiers and Van Staden, 2006; Deegan, 2007).
Climate change could be considered as a gap between the activities developed by the organization for society and the approval of their goals by society, thus implying an important threat to the legitimacy of the organization (Wittneben et al., 2012; Borghei and Leung, 2013). According to the legitimacy theory, disclosure of social and environmental information by organizations can be used by managers to face this threat to their legitimacy (Reverte, 2009; Prado et al., 2009; Cho et al., 2012). More specifically, carbon disclosure, through CDP, for example, can be used by the managers of the organizations to show their compliance to social expectations in regards to climate change and thus achieve legitimacy or avoid threats to it (Borghei and Leung, 2013; Luo et al., 2012).
Jointly using the legitimacy and stakeholder theories has been key to the success of the study on the disclosure of social and environmental information (Reverte, 2009), as both theories are complementary (Gray et al., 1995; Milne, 2002). As highlighted by Deegan (2002, p. 295), while the legitimacy theory deals with society’s expectations in general, the stakeholder theory provides a more refined resolution by referring to specific groups within society.
Stakeholder theory sustains that organizations receive different demands and pressures from their stakeholders, who – in turn – have different visions or expectations regarding the desired behavior of organizations, which can influence their decision-making (Freeman, 1984; Banerjee, 2007). Although, initially shareholders were identified as the most relevant stakeholders for organizations, the stakeholder concept has also come to include clients, suppliers, competitors, institutional investors, public authorities, non-governmental organizations, industrial associations, etc. (Gray et al., 1996). Given the different nature of the stakeholders, organizations tend to focus on the demands of those with a higher degree of power, legitimacy and authority, to thus gain their support and guarantee their survival (Banerjee and Bonnefous, 2011). Thus, disclosure of social and environmental information can become a tool in the hands of managers to “manage (or manipulate) stakeholders to gain their support and approval, or to distract their opposition and disapproval” (Gray et al., 1996, p. 45).
Climate change is a social concern today, and stakeholders have different expectations in this regard, exerting pressure on organizations for these to disclose relevant information (Prado et al., 2009; Tang and Luo, 2011; Luo et al., 2013). Carbon disclosure through CDP allows organizations to respond to the demands for information of over 300 institutional investors, among others, that are integrated in this project, which may grant them access in the future to resources with improved terms and conditions (Borghei and Leung, 2013). As Deegan (2002) pointed out, disclosure of environmental information for stakeholders, and the disclosure of information through CDP, is strategic for organizations.
3. Factors influencing carbon disclosure
This paper considers the possible influence of several factors on the voluntary carbon disclosure, and its transparency, by the organizations, grouping these according to the relevant pressure: social, market, international interactions and shareholders.
3.1 Social pressure
Social pressure refers to the pressure exerted by the public opinion of the environment of organizations. As larger companies are subject to higher levels of social scrutiny and coverage from the media (Patten, 2002; Al-Tuwaijri et al., 2004), the expectations of the public in terms of the fight against climate change will lead these companies to disclose carbon information so that their legitimacy is not questioned (Mobus, 2005). On the contrary, public opinion may consider that the company is not fighting against climate change, putting its legitimacy at risk. Similarly, from the stakeholder theory, it can be considered that larger companies, which have a greater impact on their environment, are subject to stakeholders that exert more pressure on their organizational behavior (Knox et al., 2006). In this sense, voluntary carbon disclosure could be a means used by larger organizations to respond to this pressure, thus avoiding possible measures from the stakeholders, such as the establishment of a stricter regulation by the government or the retrieval of funds from investors (Pinkse and Kolk, 2009). Similarly, Clarkson et al. (2008) indicate that larger companies tend to disclose more information as a result of obtaining economies of scale in terms of costs of producing the information.
Several studies have shown the existence of a positive relationship between the size of the company and carbon disclosure (Stanny and Ely, 2008; Prado et al., 2009; Luo et al., 2012; Borghei and Leung, 2013; Luo et al., 2013; Peng et al., 2014). Therefore, we can consider the following hypothesis:
H1. There is a significant and positive relation between the size of the company and carbon disclosure.
3.2 Market pressure
This pressure refers to that which is exerted by investors and creditors on managers of companies (Tang and Luo, 2011; Luo et al., 2012; Lee et al., 2015). The fight against climate change implies for organizations a demand of the emissions reduction, which they will have to respond to in order to maintain their legitimacy (Deegan, 2002), as well as to comply with the requirements of these stakeholders (Gray et al., 1996). Given that investors and creditors require information regarding the achievements of organizations in their fight against climate change to assess their decisions for investment or for the granting of financial resources, respectively, and that this information may be provided by the managers of said organizations, emissions disclosure through the CDP helps reduce the information asymmetry between investors and creditors on the one hand, and company managers on the other (Verrecchia, 2001). Thus, if organizations do not provide this information, they may be penalized by the market. Similarly, the reduction of this information asymmetry may result in a decrease in the cost of financing obtained by organizations in the markets (Barry and Brown, 1986; Lang and Lundholm, 2000; Healy and Palepu, 2001; Cormier et al., 2005; Francis et al., 2005).
In this paper, we have used leverage, financial risk, profitability and TobinQ as the variables representing this pressure (Luo et al., 2012). Therefore, companies with greater liabilities will be subject to higher pressure to disclose carbon information (Prado et al., 2009; Borghei and Leung, 2013), as this will result in a reduction of the information asymmetry required by the suppliers of capital when making their decisions (Lang and Lundholm, 2000). Similarly, Stanny and Ely (2008) argue that companies with higher levels of debt, given their more limited financial flexibility, will find themselves subject to greater scrutiny by investors and creditors, with it being more likely said companies will disclose carbon information to comply with the demands of these stakeholders.
In this same sense, we can understand that companies with higher financial risk have a greater tendency to disclose carbon information (Luo et al., 2012), as it will provide investors with a more precise assessment of the company. As established by Tang and Luo (2011), in the case of companies with a high business risk, their managers are more likely to disclose carbon information so as to enable investors to assess the value of the company more accurately.
On the other hand, companies with higher profitability levels will be in a better position to face the costs related to the reduction of emissions and the subsequent disclosure of information (Bewley and Li, 2000; Cormier et al., 2004). With regard to the disclosure of environmental information, Magness’ (2006) study relies on legitimacy theory to suggest that society in general has higher expectations regarding the activities of more profitable companies. Meanwhile, Stanny and Ely (2008) argue that more profitable companies are in a better position to meet the costs of climate change and are thus able to provide investors with positive information, which will facilitate their securing of resources. It is also worth noting that there are several studies based on stakeholder theory which point to a positive relationship between the disclosure of social and environmental information and profitability (Roberts, 1992; Ismail and Chandler, 2005).
Finally, TobinQ includes, among other aspects, the company’s current levels of intangible assets, as well as future growth opportunities (Clarkson et al., 2008). More specifically, a high TobinQ may mean that the company has a higher level of intangibles and/or future growth opportunities (Stanny and Ely, 2008). Thus, companies with a higher TobinQ will tend to disclose more information so as to enable investors and creditors to better assess the market value of the company’s intangible assets and its prospects for growth. In this sense, the CDP represents a means by which managers can deliver information to these stakeholders which will support their decision-making regarding the company (Tang and Luo, 2011).
Based on the aforementioned arguments, the following hypotheses may be considered:
H2a. There is a significant and positive relation between leverage and carbon disclosure.
H2b. There is a significant and positive relation between financial risk and carbon disclosure.
H2c. There is a significant and positive relation between profitability and carbon disclosure.
H2d. There is a significant and positive relation between TobinQ and carbon disclosure.
3.3 Pressure of international interactions
This pressure refers to that exerted by the international environment in which the company develops commercial operations. Thus, companies developing a large part of their sales on the international level will be subject to higher scrutiny from these countries regarding their GHG emissions, especially if the latter have signed the Kyoto Protocol (Prado et al., 2009; Stanny, 2010) (which is the case of most industrialized countries). As companies that fail to respond to these demands of information can see their legitimacy threatened, as well as their access to needed resources (Deegan, 2002; Al-Tuwaijri et al., 2004), one can expect that those companies with a higher percentage of international sales will have a higher probability of providing environmental information regarding the GHG emissions through the CDP. This positive correlation was established by Stanny and Ely (2008) in the case of US companies included in the S&P 500 Index. Therefore, we can consider the following hypothesis:
H3. There is a significant and positive relation between the percentage of international sales of the company and carbon disclosure.
3.4 Shareholder pressure
Shareholders can exert pressure on managers of companies so that they disclose information (Lee et al., 2015). The listing in indexes such as IBEX35 (where the Spanish companies with higher share capitalization are listed), FT500 or DJSI (Dow Jones Sustainability Index), which refers specifically to sustainability information, provides these organizations with higher visibility, bringing them closer to possible investors. Likewise, listing in these indexes implies higher transparency demands in terms of the disclosed information (Cooke, 1989). Shareholders of companies listed in these indexes can exert pressure on them so they continue to be visible, comply with information transparency requirements (including environmental information) and therefore not question the legitimacy of the organization, which can damage the profitability of shareholders and the value of their investments (Lee et al., 2015). In this line, several studies conclude that being listed on this kind of index is a significant determinant of the level of companies’ voluntary disclosure (Cooke, 1989; Hossain et al., 1994, 1995; Robb et al., 2001). Specifically, former studies have considered the relationship between the disclosure of environmental information, including GHG emissions, and their listing in IBEX35 (Archel, 2003; Reverte, 2009), FT500 (Stanny and Ely, 2008; Kim and Lyon, 2011) and DJSI (Prado et al., 2009; Cho et al., 2012; González and Zamora, 2013). In this regard, the following hypotheses can be proposed:
H4a. There is a significant and positive relation between participation in IBEX35 and carbon disclosure.
H4b. There is a significant and positive relation between belonging to FT500 and carbon disclosure.
H4c. There is a significant and positive relation between belonging to DJSI and carbon disclosure.
Previous literature also has considered OC, understood as the possession of capital stock of the company by a reduced group of shareholders, as a determining factor in voluntary disclosure (Roberts, 1992; Baek et al., 2009; Borghei and Leung, 2013). Thus, as companies with a lower OC have a higher number of shareholders, organizations will be subject to increased pressure by their shareholders so that the information asymmetry between them is reduced (Cullen and Christopher, 2002; Prencipe, 2004), i.e. company managers disclose information which may be taken into consideration by the shareholders to better inform their decision-making, as stakeholder theory establishes (Cormier et al., 2005). Similarly, Reverte (2009) argues that in the case of those companies with a lower OC, voluntary disclosure can act as a monitoring tool, which may help to reduce potential agency problems between the managers of the company and its shareholders.
This relation between OC and information disclosure is also patent for the specific case of environmental information (Brammer and Pavelin, 2008). Thus, this last hypothesis can be considered:
H4d. There is a significant and negative relation between OC and carbon disclosure.
4. Research design
4.1 Sample
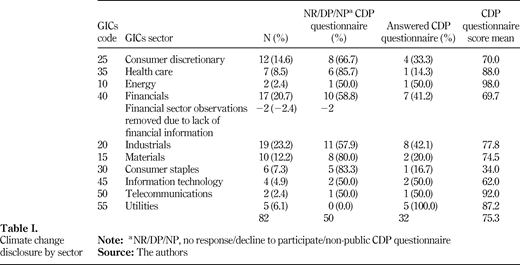
Eighty-four Spanish companies were required to answer the CDP (2012) questionnaire, which is available on the CDP Web site. As it is shown in Table I, two of them were excluded due to the lack of financial information: they disappeared that year and did not respond the CDP questionnaire. We also used the Global Industry Classification Standard (GICS) to control sector fixed effects.
4.2 Data source
The CDP score, the dependent variable, was collected from the CDP (2012) report because it was the most recent report when we started the project. Furthermore, 2012 is one of the years in which the total sample and company participation in the CDP has been at its highest. Additionally, the questionnaire has a more solid structure in 2012, as it has undergone significant changes since its inception (Kolk et al., 2008).
Financial data (e.g. return on assets, sales, leverage, TobinQ and foreign sales) were collected directly, or prepared, from the Datastream database. The OC and other data were collected from financial reports when they were not available in Datastream.
4.3 Theoretical model
According to our theoretical framework, the discretionary decision of management about the level of disclosure on climate change is a function of a set of pressures, as given in equation (1): Equation 1
To test our hypotheses, that form adopts the following econometric model (equation 2): Equation 2
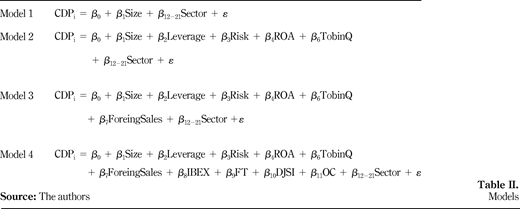
Several models were tested to analyze whether each group of independent variables contributes to improve the variance explained, as shown in Table II. Sector are dummy variables for each GICS code sector to control industry fixed effects with the purpose of controlling unidentified factors that might vary by industry.
Previous research has developed logit models to test influencing factors on climate change disclosure decisions (Stanny and Ely, 2008; Reid and Toffel, 2009; Luo et al., 2012, 2013; Borghei and Leung, 2013; Wegener et al., 2013). However, the decision to disclose carbon reporting does not imply a decision to develop a good reporting. Previous studies have obviated the level of disclosure as a variable of interest. This study explores several decision influence factors, on the one hand, and the level of disclosure when the decision to report has been taken, on the other hand. To do this, the regressions have been estimated using a Tobit analysis, because the dependent variable is a censored variable (from below) at zero[1] level. Table I shows that of 82 companies in the sample, 32 answered the CDP questionnaire; therefore, the rest of companies obtained a zero in their CDP score because they did not respond. Therefore, disclosure level is a variable with a constrained range. In Tobit analysis, regressions are estimated by maximum likelihood. If the proposed model was estimated using ordinary least squares, the coefficients were biased and inconsistent (Wooldridge, 2012). Besides, factors influencing the environmental disclosure have been already studied using Tobit regression (Cormier and Magnan, 1999; Cormier et al., 2005; Clarkson et al., 2008), but not specifically on the issue of carbon disclosure.
To develop the Tobit model[2], we take y as the dependent variable (in our case, CDP) and x as the regressor (as a vector of our independent variables), as presented in equation (3): Equation 3 where ɛ is assumed to be a normal (0, σ) and independent of x. However, the Tobit function has two parts, as presented in equation (4): Equation 4
Coefficients β give the marginal impact of regressors on the latent variable y* and they represent two effects: first, the effect on the dependent variable due to a specific independent variable, and second, the effect of an independent variable on the probability of being uncensored. Thus, Tobit coefficients cannot be interpreted as if they were estimates from a linear regression. They should be discomposed to assess the magnitude of the regressor in each of the two effects.
Therefore, in the first place, the marginal effect on the observed variable, uncensored, should be expressed as equation (5): Equation 5
where σ is the standard deviation of the error term in the Tobit model.
The expression in brackets is known as adjustment factor[3], and it must be below zero. When there are few censored observations, this term tends to one.
In the second place, the marginal effect on the probability of being uncensored should be expressed as equation (6), where it can be identified another adjustment factor of β: Equation 6
4.4 Measures
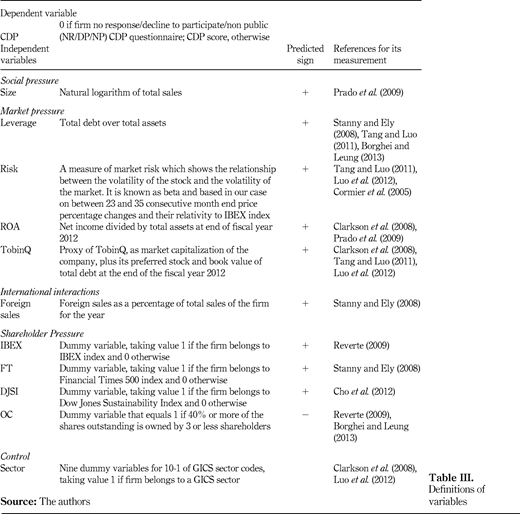
Table III shows the variables used in the test, describing how they are measured and their expected sign based on the hypotheses.
5. Empirical results
5.1 Descriptive analyses
Table I shows carbon disclosure by sector. Of the sample of 82 companies invited to participate in the CDP in 2012, 23.2 per cent of them belong to the industrial sector and 20.7 per cent to the financial sector, followed by the consumer discretionary and materials sector. Among them, 32 have responded to the CDP questionnaire and 50 declined to participate, did not respond or have not made their responses public; therefore, they have been assigned a zero in the CDP variable. The sectors whose companies have participated and published this questionnaire are the supply industry, with 100 per cent participation, and information technologies, telecommunications and energy, with 50 per cent participation. Most of the average scores of CDP have been obtained from energy and telecommunications companies. In general, the averages by sector in the CDP almost equal or exceed 70 points, except for basic consumer industries, that have an average of 34.
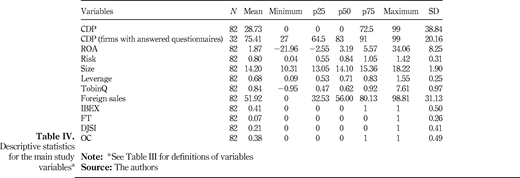
Table IV shows the average, minimum, maximum, standard deviation and percentiles (25, 50 and 75) for each of the variables of the study. As it can be observed, the score obtained in the CDP questionnaire is rather high, above 83 points, for half of the companies in the sample that replied to the questionnaire. Also, it is important to highlight that in 50 per cent of the companies, their foreign sales account for more than 56 per cent. In regards to the variables regarding the questionnaire, 41 per cent of the companies are listed in IBEX35, 7 per cent are part of FT500, 21 per cent are included in DJSI and 38 per cent of the companies have less than 40 per cent of their shares in the hands of three shareholders or less.
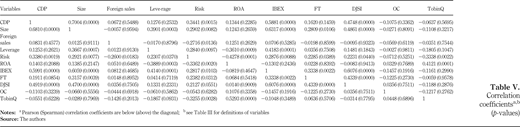
On the other hand, Table V shows the Pearson correlation coefficients, as well as the Spearman correlation coefficients, given the use of dummies in the study. As we can observe in Table V, there are no elevated or significant correlations among pairs of independent variables that could indicate multicollinearity problems.
5.2 Multivariate analyses
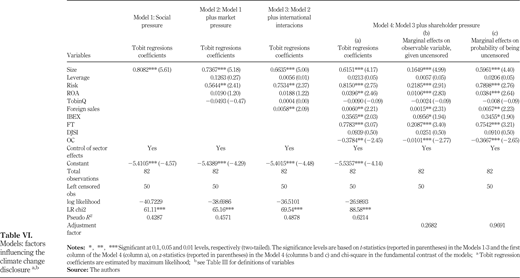
Table VI shows the results of the Tobit analysis in our study. The different columns correspond to models built aggregating the former model of the variables (in order: social pressure, market pressure, international interactions and shareholder pressure) until the last model, where we tested all the independent variables in this set. This procedure allows to observe whether the set of variables provides explanatory power to the model, observing the variation of pseudo-R2, which happens in all models. In the fourth model, we achieved a pseudo-R2 above 0.62, thus highlighting the explanatory power reached in the final model, which is uncommon in former studies (Clarkson et al., 2008; Luo et al., 2012, 2013).
The fundamental contrast in the Tobit model is developed observing the chi-square. In all the models of our study, the value indicates a joint significance of more than 99 per cent.
The measurement of the effect on the dependent variable of the different tested variables should be developed observing the last two columns of Table VI, as, as we mentioned in the previous section, the coefficients of each explanatory variable of the Tobit model collect the marginal aggregated effect on the latent variable, as the marginal effect of the probability that those companies that did not reply to the questionnaire respond (companies with a dependent variable in the censorship level).
As we indicated, each of the referred effects can be isolated through the application of an adjustment factor[4]. As it can be observed in Table VI, approximately 27 per cent (0.2682) of the coefficient gives way to a variation in the CDP score level in the companies responding to the questionnaire. On the other hand, almost 97 per cent (0.9691) of the value of these coefficients implies an increase of the probability level that a company that does not respond to the questionnaire, responds.
The effect of the size on the environmental disclosure has been broadly studied in former papers, figuring as a relevant variable in all of them, which also happens in our models. In Model 4, the size appears like one of the variables with a higher incidence in terms of the probability of responding, and the CDP score obtained. Thus, an increase in a unit in the natural sales logarithm of a company that does not respond to the questionnaire implies an increase of almost 60 per cent (0.5961) of their probabilities to responding. On the other hand, for companies that have responded, it would imply an increase of almost 16 points in their CDP score.
In regards to the pressure of the financial market so that the company participates and obtains a higher CDP score, the variable with a higher incidence and with a significant and positive coefficient is market risk, measured by means of the company’s Beta. Its coefficient is significant at 99 per cent, the variable has an impact of 2.1 points in the CDP questionnaire revelation score, as well as a 7.9 per cent increase in the probability of responding for each increase of 0.1 in the value of this variable. The return on assets (ROA) is a variable that presents a positive and significant coefficient, but the impact is much reduced. On the contrary, the leverage and the TobinQ do not present significant coefficients.
In relation to the effect of foreign sales, it has a positive and significant coefficient, as shown in previous papers. However, its weight in the degree and probability of response of the CDP is low.
Social pressure is another influencing factor, specifically through the participation in the indexes IBEX35 and FT500, as well as the concentration of the shareholders. Participation in IBEX35 implies an increase of almost 10 points in the CDP response level, as well as a 35 per cent in the probability to respond to the questionnaire. FT500 is a variable that also has a high weight level in both components, but this result must be valued cautiously, as only 7 per cent of companies are included in this index. Surprisingly, participation in DJSI does not show any effect. On the other hand, shareholder concentration does have a significant and negative effect on the dependent variable. Although its effect is reduced in the response level, the probability of response is reduced in almost a 37 per cent when the company shows an OC.
5.3 Robustness checks
We formulated an additional model with those variables that did not present a statistical significance: leverage, TobinQ and DJSI. The log likelihood of the model reached the value of −27.1225, which implies a difference of 0.1322 in regards to Model 4 presented in Table VI. This difference would result in three variables that jointly are insignificant in the model and can be discarded, as they will not have effect on the fundamental contrast of the model (chi-square, 88.31) or the explanatory power of the model (R2, 0.6195). The significance and the signs of the rest of the variables are identical in Model 4, and the coefficients do not present variations of significant value.
Other complementary tests were developed to contrast the robustness of the data. Thus, to ensure that the coefficients obtained in our studies were not under the influence of normality problems of the sample, we developed non-parametric Mann–Whitney tests of mean differences. These tests presented significant differences at 99 per cent between the group of companies that responded to the questionnaire and those that did not respond, in the variables Size, Risk, FT, DJSI and IBEX35. Basically, this test confirms the influence of the variables of higher weight by their coefficients in the Tobit regression; therefore, the fact that we do not obtain in this test an acceptable significance of the OC and profitability (ROA) does not affect the core of our results. Moreover, in the Tobit model, we replaced the size indicator (Size), natural logarithm of sales, for the natural logarithm of total assets of the companies, providing similar results to those appearing in this study.
The order of introduction of these models has been developed to improve the presentation of the results and the observation of the incremental effect of each group of variables on the explanatory power of each of the regressions. However, we contrasted other alternatives in the order of variables, which did not result in appreciable variations in the significance and value of the coefficients.
Finally, we considered Model 4 as a regression by minimal ordinary squares and the variables presented identical significance levels. We did not appreciate significant values in the waste eliminated in each of the companies in the t test at 95 per cent, which could be indicative of the existence of outliers and observations. Also, we did not identify influential observations in the D-Cook statistical study of each element of the sample.
6. Discussion and conclusions
This paper aims to identify those factors that not only increase the probability of companies voluntarily disclosing carbon information, as in most of the former studies, but also to determine the level of transparency of the provided information. For this purpose, based on the legitimacy and the stakeholder theories, this paper considers the factors that could affect the degree of response and the score obtained by the Spanish companies that were invited to respond to the CDP (2012) questionnaire, subsequently applying the Tobit regression for the analysis of results.
The results obtained show that the probability of carbon disclosure as well as its transparency level are explained by the influence of social, market, shareholder and international interactions pressures, although the latter is reduced. Specifically, the multivariate analysis developed confirms H1, H2b, H2c, H3, H4a, H4b and H4d, by obtaining an elevated explanatory power (pseudo-R2 higher than 0.62) with the aggregation of the models. Thus, larger companies, as they are subject to higher social scrutiny (Al-Tuwaijri et al., 2004) and higher pressure from their stakeholders (Knox et al., 2006), will tend to disclose carbon information, which will also be more transparent, thus maintaining legitimacy in their environment. This same behavior extends to companies presenting a higher financial risk, as the carbon disclosure will contribute to investors developing an increasingly precise assessment of the company, thus responding to their pressure (Luo et al., 2012). Similarly, the listing of companies in IBEX35 and FT500 implies a higher probability to carbon disclosure with higher transparency levels, as shareholders will try not to harm the legitimacy of companies and ensure that it is still visible, to thus maintain the profitability and value of their investments (Cooke, 1989; Reverte, 2009; Lee et al., 2015). Finally, companies with a lower OC will also tend to carbon disclosure with a higher transparency level, as it contributes to the reduction of the information asymmetry between the company and its shareholders, thus responding to their pressure (Prencipe, 2004; Cormier et al., 2005).
Although profitability and foreign sales have also appeared as determining factors for the carbon disclosure, as well as their transparency level, the incidence is much lower in comparison with the previously analyzed factors. In the case of profitability, it can provide higher resources to companies to respond to climate change and the demands of relevant information (Cormier et al., 2004). However, some authors also point out that the response to climate change implies a cost for companies, which can displace more productive investments and leave the company in an economic disadvantage (Palmer et al., 1995; Hsu and Wang, 2012), which could justify a lower incidence of this factor. On the other hand, the positive correlation between the participation in the CDP questionnaire and the percentage of foreign sales corroborates the results obtained by Stanny and Ely (2008) for the case of companies included in US S&P 500.
A relevant result of this study was belonging to the DJSI, which has not shown to be a determining factor in the probability of the carbon disclosure and its transparency. In this regard, while the study of Cho et al. (2012) found a positive relation between belonging to DJSI and the voluntary environmental disclosure, in the studies developed by Prado et al. (2009) and González and Zamora (2013), this factor has not appeared as clearly differentiated between companies that disclose and do not disclose carbon-specific information. This fact leads us to question the measure in which DJSI can be considered as relevant for the study of the aspects related to the carbon emissions, in particular.
Given that in the case of Spain, the year 2012 was characterized by the low response rate to the CDP questionnaire (CDP, 2012) and by regulatory uncertainty in the fight against climate change, further compounded by certain measures taken by the country’s new government in that same year (González et al., 2015), such as the abolition of incentive payments for renewable energies, the results suggest that Spanish companies with greater public and external visibility (whether due to their larger size, their volume of overseas sales or their listing on indexes such as FT500 or IBEX 35) have counteracted the potential influence of these aspects, which could support the conduct of companies that choose not to disclose carbon information.
Together with the results analyzed, one of the main contributions of this study to the previous literature lies in the research method used. Thus, while previous studies analyze the factors that can determine whether companies disclose carbon information, this paper has also considered the quantification and differentiation of the effect of these factors on the probability of supplying this information, as well as obtaining a higher score in the CDP questionnaire, representing a higher transparency level in the information provided. For this reason, we understand that using the Tobit regression model for this type of studies is very appropriate and can contribute to the further development of the literature.
One of the main limitations of the study resides in having exclusively considered the response of Spanish companies to the CDP questionnaire; therefore, the results cannot be generalized in other contexts. However, precisely the aim of this paper is to consider the Spanish context, as, as mentioned in the Introduction, environmental disclosure depends on the country under consideration (Gray et al., 1995). Furthermore, the characteristics of the case of Spain prevented carbon performance being included as a control variable in the study, as the number of companies by sector is very limited (Table I), and a carbon performance measurement specific to the sector to which the company belongs is required (Clarkson et al., 2013).
Having carried out this study, we consider that a future line of research could be the analysis of factors in those contexts that present specific characteristics, as in the case of the developing countries (De Villiers and Van Staden, 2006). This research line is of greater importance even when the effects of climate change can greatly affect most of these countries (especially in African countries), which also have less resources and infrastructures to adapt and mitigate climate change.






References
About the authors
José María González-González is a Doctor Contracted in Management Accounting at the University of Seville (Spain) as well as a Visiting Research Fellow at Sheffield Hallam University, UK. His specific research interests include management accounting change and social aspects of accounting. He has published in international journals on the adoption, implementation and diffusion of business practices such as business process re-engineering, total quality management, corporate social responsibility and carbon emissions control. Jose Maria Gonzalez-Gonzalez is the corresponding author and can be contacted at: jgonzalez@us.es
Constancio Zamora-Ramírez is a Senior Lecturer in Financial Accounting at the University of Seville (Spain) and he is currently the Director of the Research Group on Financial Economics and Accounting of the University of Seville. His specific research interests include International Accounting Standards, financial instruments, carbon finance and carbon markets. He has published about these topics in both national and international journals.
Notes
Following Wooldridge (2012), specifically our regress is a corner variable.
For further statistical details, refer to Wooldridge (2012) and Verbeek (2004).
The adjustment factor is the same for all variables in the same study, but if some of them are discrete variables, this factor could be something different.
The coefficients and their statistical relevance are obtained directly through commands of the STATA program. These adjustment factors were obtained later through the relation between the coefficients of the marginal effects obtained and those corresponding to the Tobit model.

