


Climate change negatively affects agricultural crop production in the dry zone region of Myanmar. This paper aims to examine climate change adaptation strategies of farmers in the dry zone region. Farmers’ choice for adaptation strategies is influenced by many factors such as the practical availability and by socioeconomic conditions of the farmers. They are moreover influenced by the perception about climate change and by the specific problems prevailing in the farming systems.
This research is carried out in Magwe district in the dry zone region of Myanmar using a random selection of 212 farmers from three Townships (Magwe, Yenanchaung and Chauk). A multinomial logistic regression (MLR) was applied to assess the factors affecting the choice by farmers for adaptation strategies.
The study found that in the past, farmers used to apply locally available indigenous climate change adaptation strategies. However, recently, most farmers seem to have shifted to introduced adaptation strategies. The most popular adaptation strategy is to adjust the planting dates and sowing method (56.1 per cent). Furthermore, farmers identified a number of barriers that limit the adoption of adaptation methods. Risk is found to be an important driver of crop diversification. Finally, the MLR model showed that information from radio, access to seeds and extension services affect the choice of adaptation strategies.
The study shows that adoption of locally available indigenous climate change adaptation methods is gradually decreasing, and there is a shift to introduced adaptation strategies. The study can assist public and private organizations to obtain insight in the determinants of climate change adaptation in the dry zone region of Myanmar.
1. Background
Many scientists have confirmed the occurrence of climate change, and it is believed that the impact of climate change will be largest in developing countries (IPCC, 2001, 2007; World Bank, 2012, 2013, 2014). This is because developing countries often have agricultural-based economies, and agricultural production highly depends on weather conditions and natural resources. On average, about 43 per cent of the gross domestic product of developing countries is generated by agriculture and related activities (Yohe and Tol, 2002; Norton et al., 2010; IFAD, 2010). On global level, climate change is projected to decrease agricultural productivity (Parry et al., 2004; Parry, 2007; Cline, 2007; FAO, 2013). Analyzing the impacts of extreme weather events and associated socio-economic data of the past two decades, there are nine developing countries in the top ten of nations most prone to climate change and extreme weather events. Myanmar ranks second in this list and therefore is one of the most affected countries in the past 20 years (Kerft et al., 2014). Myanmar is highly vulnerable to climate change and extreme weather events because of its low level of social development, inadequate infrastructure and high dependency on a natural resource-based economy (Yi, 2004; UNDP, 2007; UNCT, 2011; WFP, 2013).
As a consequence of climate change, the precipitation patterns in Myanmar are reported to be changing. Annual rainfall is decreasing, while the temperature is increasing (Yi, 2004; Yi et al., 2012; HPM, 2009). In the past decades, phenomena such as late monsoon occurrence, early monsoon withdrawal, a shorter duration of the monsoon and retardation of monsoon advancement have frequently occurred. Yi et al. (2012) furthermore reported that drought risks are increasing in Myanmar. The drought risks are believed to be “high” for the dry zone regions, and they have adverse effects on crop and livestock production and drinking water availability (HPM, 2009; RIMES, 2011; RCCAKP, 2011; Yi et al., 2012). Under water scarcity conditions, farmers also incur additional costs for water supply (Yi, 2004; WFP, 2011). Considering the century-long rainfall records, it is observed that the drought vulnerability and the variability in rainfall in the wet season are particularly high in the central part of the dry zone. For example, Magwe district received around 240 mm in May 2000, but only 80-90 mm in May 2011 (McCartney et al., 2013). Yi (2004) estimates that the temperature in Myanmar will increase throughout the twenty-first century, on average about 0.5°C, but in the dry zone region for example, the temperature is likely to increase between 0.7 and 1.2°C. Furthermore, over the same period, annual rainfall quantity in the dry zone region is predicted to decrease with 45 per cent. This is a challenge for poorer farmers because their livelihood relies on crop production and thus on rainfall. While dry periods also frequently occurred in the past, the occurrence is projected to increase in the region due to the changing climate (Dai, 2011; Miyan, 2015). Therefore, especially in the dry zone region of Myanmar, the water scarcity and yield reductions caused by climate change will severely affect the regional economy, food security and food availability (ASIS, 2005; Ra, 2011; RIMES, 2011; RCCAKP, 2011).
The central dry zone region accounts for about 22 per cent of the paddy production, 89 per cent of the sesame production, 69 per cent of the groundnut production and 70 per cent of sunflower production (McCartney et al., 2013). In this region, water shortages and deficiencies in rainfall in the early and late monsoon seasons reduce crop yields or cause failure of major crops such as sesame, groundnut and pigeon peas. This resulted in high levels of food insecurity even in the post-monsoon and post-harvest periods (ASIS, 2005; WFP, 2013). Climate change therefore is a major challenge for the farmers in dry zone region. Farmers in these areas therefore have already started to adapt to climate change by changing crop mixes, using water conservation measures and adopting risk management techniques to lessen the consequence of, for example, the increased drought frequency (Norton et al., 2010; IPCC, 2001, 2007; World Bank, 2012). Two types of adaptation can be distinguished: indigenous adaptation and system or introduced adaptation (START, 2012). Adaptation encompasses both “hard” and “soft” technologies and not only new technologies but also indigenous or locally developed technologies (Glatzel et al., 2012). According to Reid et al. (2006), indigenous knowledge becomes a part of a shared learning effort to address the impacts of climate change. Therefore, Howden et al. (2007) argued that assessing the effectiveness of adaptation options, enhancing existing climate risk management, understanding likely adoption rates and developing more resilient agricultural systems are urgently needed. Nevertheless, literature on climate change adaptation in the dry zone region of Myanmar is scarce.
At farm level, adaptation consists of two stages:
perceiving the change in climate and deciding whether to adapt; and
deciding which climate adaptation measures to choose (Maddison, 2007).
Moreover, the acceptance of climate change adaptation strategies is determined by numerous demographic, socioeconomic and organization or institutional characteristics (Deressa et al., 2009; Hassan and Nhemachena, 2008; Yesuf et al., 2008; Shongwe et al., 2014). Howden et al. (2007) argued that achieving increased adaptation would require integration of climate change-related issues with other risk factors. Therefore, it is necessary to address farmers’ perception of the impact of climate change.
In most cases, simple and feasible adaptation measures such as altering varieties and planting times to avoid drought and heat stress can have significant negative impacts on crops (Tubiello et al., 2002). However, adaptation involves harms and opportunities, as well as failures and successes, as the effect of climate change occurs over a span of time (WICCI, 2011). Therefore, adaptation should react to further changes in the climate in the future. A better understanding of climate change adaptation choices and adoption of adaptation strategies to address the increasing water scarcity over time is becoming a great concern for policy makers to comprehend the tendency of adaptation changes, and the barriers to adaptation. Farmers’ adaptation decisions might evolve. To capture this, it is therefore necessary to compare information related to farmers’ choice of climate change adaptation strategies of the past with current measures. After that, the perceptions about the risks introduced by climate change and the barriers related to adaptation strategies are considered. Finally, the determinants of adaptation decisions are examined.
2. Methodology
2.1 Study areas, sampling procedure and data collection
In the dry zone region of Myanmar, there are 54 townships spread over 13 districts. Roughly, 35 per cent of the arable land in Myanmar is situated in the dry zone region. With a dry season of more than six months, wind erosion is a major problem. But also water erosion is occurring mainly at the beginning of the monsoon season. This due to heavy showers combined with the removal of the natural vegetation and the susceptible soils (HPM, 2009). This study was carried out in Magwe district which is located between north latitude 18° 50′ to 22° 47′ and east longitude 93° 47′ to 95° 55′. It is situated in the center of dry zone region and is composed of 5 districts and 25 administrative townships. Magwe is one of the largest regions of Myanmar with an area of 17,306 square miles (44,820 km2). The total population is around 3,917,000 inhabitants. Of these, 15 per cent of the populations live in urban areas and about 85 per cent live in rural areas (MPHC, 2015). In Magwe, lack of water availability due to the drought is the main constraint to farming (WFP, 2009). Following several reports, the climate patterns are gradually deteriorating in the dry zone region. As a consequence, the agricultural production becomes unstable, and livelihoods that rely on agriculture are endangered (HPM, 2009; ASIS, 2005; WFP, 2009, 2011) (Figure 1).
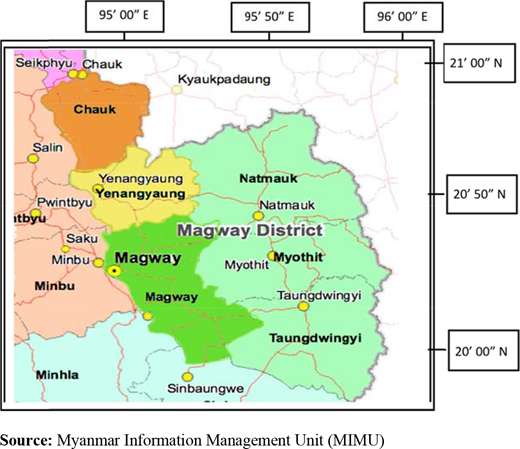
Map showing the study areas, Magwe District, dry zone region of Myanmar
Map showing the study areas, Magwe District, dry zone region of Myanmar
Data were collected in Magwe district in 2014-2015 using multi-stage sampling. At the first stage, three local townships (Magwe, Yenanchaung and Chauk) in Magwe district were selected. Within these, 25 village tracts (VT) or wards were randomly selected. At the VT level, villages were selected proportionately to the size of the selected VTs. In the final stage, respondents from each village were randomly chosen. In total, 212 farmers were interviewed. In addition to the surveys, several stakeholders were gathered in focus groups to discover the different cropping patterns and climate conditions and to explore a practical overview of different adaptation methods in the study areas. Participants in these discussions consisted of representatives of different administrative departments, key farmers or farm leaders and officers of development agencies. The focus group discussions dealt with the application of past and present climate change adaptation measures and the possible barriers to the choice of adaptation measures. The enumerators for the surveys were also involved as listeners in the focus groups to gain understanding on climate change issues in the region and on regional climate adaptation strategies and to familiarize themselves with the importance of this research. Before conducting interviews with individual farmers, a pilot survey was tested with ten farmers. The questionnaires considered socioeconomic characteristics of farmers, perceptions on climate risks barriers to adoption and current and past uptake of adaptation measures. The enumerators were trained for a day to familiarize them with the basic concepts of sampling, interviewing and processing data. The pilot survey data were excluded and not used as data to test our hypothesis. Next to this primary data, secondary data were also collected to get insight in the climate change impacts in the region.
2.2 Climatic information
Magwe region receives the lowest amount of rainfall in the country: ranging from 500 to 1,000 mm. Other parts of the country receive between 3,000 and 5,000 mm per year. In the study area, the hottest months are March, April and May, with temperatures above 43°C (Figure 2). Moreover, several reports indicate that the amount of rainfall and its frequency have reduced over the past decades. Because Magwe is a part of the dry zone, a slight decrease in the rainfall or delayed rainfall has a large effect on the vegetation index and the crop production of the farmers (WFP, 2009, 2011, 2013).
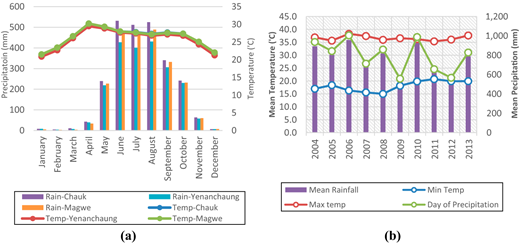
Average monthly rainfall and temperature (a): 1990-2012[1]) and mean temperature and rainfall (b): 2004-2013[2]) of Magwe District, dry zone area of Myanmar
Average monthly rainfall and temperature (a): 1990-2012[1]) and mean temperature and rainfall (b): 2004-2013[2]) of Magwe District, dry zone area of Myanmar
2.3 Empirical specification of the model variables
In general, farmers try to reduce the effect of climate variations and to stabilize yields. Adaptation to climate change is important for two main reasons: it can decrease exposure and vulnerability (Howden et al., 2007; Schmidhuber and Tubiello, 2007; Falco et al., 2011). Although human and natural systems have a certain capacity to cope with adverse circumstances, adaptation will be needed to maintain this capacity with continuing climate change (IPCC, 2012). In this context, farmers’ choice of adaptation strategies is determined by demographic characteristics, socioeconomic characteristics at household level, organizational or institutional characteristics and by the agro-ecological settings (Deressa et al., 2009; Hassan and Nhemachena, 2008; Yesuf et al., 2008; Shongwe et al., 2014; Tessema et al., 2013). In this study, the dependent variable consists of the farmers’ choice for adaptation strategies which might be one adaptation strategy or more than one strategy at a time. In the following section, the independent variables are presented and the hypothesized factors are discussed.
2.3.1 Gender.
Research has shown that male-headed households are more likely to adopt climate change adaptation strategies (Deressa et al., 2009). De Graaff and Hella (2004) found that female-headed households may have a lower adoption because women may have limited access to information and other resources due to traditional social barriers. On the contrary, Nhemachena and Hassan (2007) and Jianjun et al. (2015) argue that women are more risk adverse and therefore more likely to adopt climate change adaptation strategies. However, the authors explain that in their study, females are engaged in more farm activities and have better farming experience. In this study, however, it is expected that female-headed households are less likely to adopt adaptation strategies at the farm level.
2.3.2 Education and farming experiences.
In this study, a positive relationship between adaptation decisions and the level of education is expected. It is assumed that higher educated farmers are more capable of assessing the available technologies and climate information (Gbetibouo, 2009) because there is a major difference with less-educated farmers in terms of access to assets, credit, technology and input supply (Hassan and Nhemachena, 2008). Nevertheless, some studies also found that education was negatively correlated with adoption decisions (Okeye, 1998; Gould et al., 1989). However, education is still widely considered as an important policy measure to improve the awareness of the potential benefits of adaptation (Hassan and Nhemachena, 2008; Tazeze et al., 2012; ATPS, 2013). The empirical literature on adaptation furthermore shows that experienced farmers have an increased probability of taking up climate change adaptation strategies (Deressa et al., 2009; Tazeze et al., 2012). Jianjun et al. (2015), for example, highlighted that in China, farmers with more farming experience are more likely to take up insurance. In this study, it is expected that farmers with more years of farming experience are more likely to adopt climate change adaptation strategies than those with less experience.
2.3.3 Distance to the market, access to seeds and livestock.
The distance to the market is assumed to be an important determining factor for the adoption of climate change adaptation strategies. Farmers with better access to the market and good transportation roads have a higher uptake of farm level adaptation measures (Tazeze et al., 2012, 2013). Better access to the market improves access to seeds; climate information and the distance to the market place determine access to extension services (Deressa et al., 2009; Maddison, 2007; Tazeze et al., 2012). It is hypothesized that a shorter distance to the market center increases the probability that farmers adopt climate change adaptation strategies. Farmers obtain seeds from the market and from retailers or brokers. Some farmers store good seeds in their house for two to three years. It is also assumed that farmers who receive seeds from the same sources in time have a higher adoption of climate change adaptation strategies at the farm level. In the study areas, livestock such as draught cattle plays a major role in the cultivation and production of crops. Deressa et al. (2009), Obayelu et al. (2014) and Tazeze et al. (2012) highlighted that the ownership of livestock is positively related to most of the adaptation options. This study hypothesizes that farmers who owned draught cattle (at least an oxen) are more likely to adopt climate change adaptation methods.
2.3.4 Extension services and farm assets.
As a barrier to the adaptation to climate change, lack of extension services was identified by ATPS (2013). Several empirical findings highlighted that wealth, access to extension services and climate information influenced farmers’ adaptation to climate change (Bryan et al., 2013; ATPS, 2013). It is assumed that farmers that receive extension services are more likely to take adaptation measures at the farm level than the others. On the other hand, shortage of land is also one of the barriers to adopt climate change adaptation methods (Bryan et al., 2009; Maddison, 2007), and farm size (land size) has been mentioned as a factor affecting adaptation to climate change (ATPS, 2013; Tessema et al., 2013). Therefore, in this study, farmers with smaller land sizes (> 10 ac or 4.05 ha) were hypothesized to be less likely to take climate change adaptation measures.
2.3.5 Farmers’ perception.
Much theoretical research has focused on the relationship between farmers’ perception about climate change and climate change adaptation. In the dry zone region, a preliminary survey revealed that a large number of farmers already perceive that the rainfall is decreasing, that the climate is becoming hotter and that the availability of water for agriculture is reducing. Therefore, it is expected here that farmers who foresee higher annual yield losses due to the climate change have a higher probability to adopt climate change adaptation strategies at the farm level.
2.4 Analytical framework and empirical specification of multinomial logistic regression model
First, the study performed a descriptive analysis on the perceptions about climate change, the risks introduced by climate change and the barriers farmers face with the application of different adaptation methods. Next, a multinomial logistic regression (MLR) was used to analyze the determinants of farmers’ choice of adaptation methods. The MLR model, a discrete choice model in climate change adaption research, is based on the theory of adoption decision (Ndah et al., 2010). Deressa (2010) highlighted that this approach is based on the conceptual similarities between agricultural technology adoption, climate change adaptation and other related models involving decisions whether to adopt. This method was previously used by Bryan et al. (2009), Deressa et al. (2009), START (2012), Tazeze et al. (2012) and Obayelu et al. (2014). Following this model among the set of adaptation options, the probability that a farmer (i) will choose an adaptation alternative (j) from the options could be defined as:
where, “x” is a vector of explanatory variables. Uij and Uik are the perceived utilities for farmer (i) of adaptation (j) and (k), respectively. The response probabilities of the multinomial logit model are:
where is a vector of coefficients on each of the independent variables “x”. The above equation can be normalized to remove indeterminacy in the model by assuming that β0 = 0, and the probabilities of making a choice from a set of alternatives can be estimated as:
The J log-odds ratio of the model is given as:
For this model, the independence of irrelevant alternatives (IIA) assumption should hold. Two basic types of tests can be used to see whether the IIA assumption is violated, a choice set partitioning test and a model-based test (Cheng and Long, 2007). Possibilities include the McFadden, Train and Tye Test (McFadden et al., 1981), Small and Hsiao test (Small and Hsiao, 1985) and the Hausman and McFadden Test (Hausman and McFadden, 1984).
The marginal effects of changes in the explanatory variables are usually derived as:
The MLR model was also presented as follows:
where, Yj are the different adaptation strategies applied by the respondents, and Xi are the different independent or explanatory variables in the model. The explanatory variables used in the model are listed in Table I. In the MLR analysis, the estimation of the model was performed by normalizing one category. In the analysis, “no adaptation” is used as the normalized category or “base category”. In the initial run, age, access to credit services and water sources were added into the model, but they did not have a significant effect on the adaptation choices and thus they were dropped.
Description of the independent variables
| Variable | Description of variables | No. of respondent | Variables | Description of variables | No. of respondent | ||
|---|---|---|---|---|---|---|---|
| 1 = yes | 0 = No | 1 = yes | 0 = No | ||||
| Gender | Male-headed households | 187 | 25 | Farm land (ha) | Farmers who owned land below 10 ac (>4.05 ha) | 93 | 119 |
| Education | Farmers’ level of education above the secondary school | 128 | 84 | Experience | Farmers who have less than 15 years of farming experiences | 38 | 174 |
| Seed | Farmers who received enough seeds from the regular sources such as public or private organizations | 108 | 104 | Distance to market | Farmers’ households that could reach market center within 13 km (about 8 miles) | 62 | 150 |
| Off/Non-farm income | Farmers’ households that received off/non-farm incomes | 99 | 113 | Information from radio | Farmers who received climate information via radio | 159 | 53 |
| F-to-F extension | Farmer-to-Farmer extension and sharing knowledge | 173 | 39 | Livestock holding | Farmers’ households owned draught cattle for crop production | 183 | 29 |
| Public extension | Farmers who received extension service from government organizations | 162 | 50 | Perception to yield | Farmers’ perception to the impact of climate change on crops yield losses | 187 | 25 |
3. Results and discussion
3.1 Farm characteristics and cropping patterns
Combining information obtained from the focus group discussions and the surveys, a good picture is obtained of the farm characteristics and the cropping patterns. In this sample, the mean age of the farmers was about 52 years (±11), while the average farming experience of the farmers was 28 (±12). The land ownership is highly variable ranging from less than 2 acres to more than 15. Figure 3 gives an overview of the acreage of different types of crops produced in the study areas in two different cropping seasons (2010 and 2014). Oil crops such as groundnut, sesame and peas and beans are found to be the main crops, while cash crops such as cotton and sunflower are also produced. The survey data reveal that the cropping pattern preferences of farmers evolved over time. Compared to 10 years ago, the majority of the farmers introduced cash crops and diversified their cropping patterns (Table II). Five typical cropping patterns were distinguished. While over a decade ago, the majority of the farmers were cultivating oil crops as their main income crop. Now cropping patterns and cropping systems are more diversified. Farmers are generally risk-adverse, and risk is an important driver for crop diversification. Farmers’ reported that cultivation of a mixture of crops was important for their households, as they have experienced failure of some crops due to the extreme climatic events. Therefore, the inclusion of cash crops and the diversification in the cropping patterns can be seen as a climate change adaptation measure at farm level. Diversification and rotation of crops are strategies to reduce impacts of climatic events or other biological constraints such as pest and diseases impact (Dorjee et al., 2007; Bowman and Zilberman 2013). As mentioned above, all farming is risky business. However, inclusion of cash crops in farming is reported to have a positive effect on farm incomes and mitigates seasonal or temporary risks of food availability and access (Negash and Swinnen, 2012; Achterbosch et al., 2014).
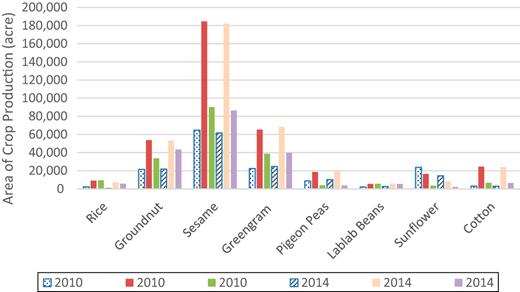
Comparison of crop production areas of major crops for the period of 2010 and 2014 in the study areas[3]
Comparison of crop production areas of major crops for the period of 2010 and 2014 in the study areas[3]
Cropping patterns of farmers in the study areas (10 years ago and currently)
| Cropping patterns | No. of observations | (%) |
|---|---|---|
| Cropping patterns (10 years ago) | ||
| (Main crop = MC) – Groundnut (G) and Sesame (S) | 99 | 46.7 |
| MC – Groundnut (G) and Peas and Beans (PB) | 20 | 9.4 |
| MC – Groundnut (G) and Other cash crops (C) | 36 | 17.0 |
| Rice (R) and Peas and Beans (PB) | 19 | 9.0 |
| Mix of crops – (G + S + PB + C) | 38 | 17.9 |
| Total number of observations | 212 | 100 |
| Cropping patterns (currently) | ||
| (Main crop = MC) – Groundnut (G) and Sesame (S) | 79 | 37.3 |
| MC – Groundnut (G) and Peas and Beans (PB) | 16 | 7.5 |
| MC – G and PB (or) Onion (O) and Peas and Beans | 27 | 12.7 |
| Rice (R) and Peas and Beans (PB) | 19 | 9.0 |
| Mix of crops – (G + S + PB + C + O) | 71 | 33.5 |
| Total number of observations | 212 | 100 |
3.2 Perception about climate change
Perception of farmers about climate change and its effects was captured with a number of questions using a five-point Likert scale. The questions explore the level of agreement with a number of statements on climate change impacts. This is presented in Figure 4. In total, 23.1 per cent of the farmers agreed and 65.1 per cent of farmers strongly agreed that water availability is decreasing and that this is a serious problem for crop production. A majority of the farmers agreed that climate change has an impact on the regional agriculture (60.8 per cent) and on individual farming (80.2 per cent). In all, 50.9 per cent of farmers agreed and 39.6 per cent of farmers strongly agreed that climate change affects yields. Furthermore, the majority of the farmers believe that in the future, their livelihoods and agricultural production will be impacted due to the changing climate. Thus, in the present situation, the regional agriculture and individual farms are severely affected by the increasing water scarcity, something nearly 90 per cent of farmers agrees with, and all the farmers agree on rainfall deficit. The findings of the study are in line with Bryan et al. (2009), Deressa et al. (2009) and Falco et al. (2011) on farmers’ perception to climate change. ATPS (2013) indicates that unless local specific adaptation interventions are made, farming community would continue to use the existing adaptation strategies despite the increasing effects of climate change in the future.
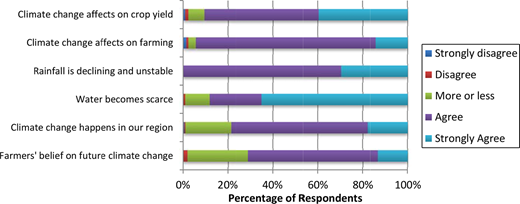
Farmers’ perception about the impact of climate change
Farmers’ perception about the impact of climate change
3.3 Comparison of past and current climate change adaptation strategies
At the farm level, the adaptation to climate change includes many possible responses. Basically, indigenous adaptation strategies available at the farm level are adjustment of planting date, crop diversification, culture-related strategies (e.g. plant protection, fumigation, cleaning bushes, etc.), soil-related strategies (e.g. changes in tillage practices, soil management practices), crop- and livestock-related strategies (e.g. crop varieties, livestock produced). These climate adaptation strategies were already present 10 years ago. The focus group discussion revealed that at present, following adaptation strategies are practiced by the farmers in the region:
use of improved varieties (e.g. drought resistant varieties, high yielding varieties, short duration varieties);
advancements in soil and plant health (e.g. organic manure application, plant pest protection, mulching, weeding introduced by public organizations);
recommended agricultural strategies (e.g. Good Agricultural Practices introduced by public organization);
crop diversification and rotation (e.g. a mix of crops, and rotating crops year after year);
adjustment of planting dates and cultivation methods (e.g. adjusting sowing dates with broadcasting methods or different forms of seedling methods); and
a combination of improved varieties and the good agricultural practices methods.
The results in Figure 5 show that most farmers use adaptation measures. However, the measures taken are different among farmers. The adoption of climate change adaptation varies across different plots given the different plot characteristics (Deressa, 2010). In the past, changing the planting date and crop diversification were applied by a large proportion of farmers, 33 and 27.4 per cent, respectively, followed by soil-related adaptation measures (14.6 per cent). However, the farmers’ adaptation strategies have changed over time. In recent years, the adjustment of the planting date has remained important, but this is now combined with an adjustment of the cropping system because only changing the planting date could no longer ensure crop yield stability. The second most popular method was focusing on soil and plant health (10.8 per cent) and crop diversification and rotation methods (9.4 per cent). It can be noted that soil deterioration and pest infestation are becoming a challenging problem in the light of climate change. The decrease precipitation and the intensity of rainfall make it difficult to raise seedlings. Therefore, the farmers adjusted the planting dates and cultivation method. This method also includes harvesting crops ahead of water deficit condition at the end of growing season. Varying the planting and harvesting dates and shortening the length of the growing season was perceived by farmers as an appropriate adaptation strategy (Hassan and Nhemachena, 2008).
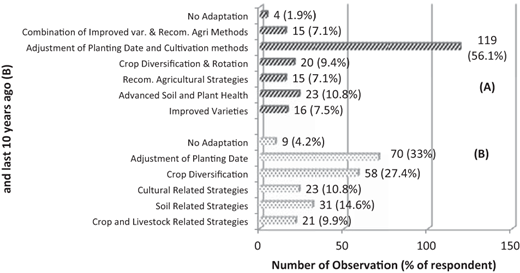
Comparison of past (a) and current (b) climate change adaptation strategies (The y-axis shows the different adaptation strategies taken by farmers)
Comparison of past (a) and current (b) climate change adaptation strategies (The y-axis shows the different adaptation strategies taken by farmers)
3.4 Model results and discussions
3.4.1 Determinant of adaptation.
Table III presents the estimated coefficients, estimated marginal effects and p-values from the MLR analyzing the determinants of the adaptation strategies. In the analysis, the likelihood ratio statistics as indicated by the chi-square statistics were found to be highly significant. Before running the model, all the explanatory variables were checked for multicollinearity using variance inflation factor. This was less than 10 (ranges between 1.076 and 2.120), which means that multicollinearity is not a serious problem in the model estimation. The model was also tested for the validity of the IIA assumptions by using the Hausman test, and it was found that the odds of any two outcomes are independent of the remaining outcomes. Therefore, the probability of using a certain adaptation method by a given household is assumed independent from the probability of taking another adaptation method. Moreover, the classification matrix was checked for evaluating the accuracy of the model. The predicted value was found to be 72.2 per cent, which is the percentage of cases for which our model predicts accurately. The marginal effects or odds ratios of MLR output are also reported and discussed as the expected change in the probability of a particular adapted strategy or method due to a unit change in an independent variable in the model. The chi-square results show that likelihood ratio statistics are highly significant (p < 0.00001) indicating that the model has a strong explanatory power.
Parameter estimates of the multinomial logit regression model for climate change adaptation decisions (n = 212)
| Explanatory variables | Improved varieties and breeds (n = 16) | Advanced soil and plant health (n = 23) | Recommended agricultural practices (n = 15) | Crop diversification and rotation (n = 20) | Adjustment of planting date and system of planting (n= 119) | Combination of improved varieties and recommended agricultural practices (n = 15) | ||||||||||||
|---|---|---|---|---|---|---|---|---|---|---|---|---|---|---|---|---|---|---|
| Coefficient | Exp (B) | p-value | Coefficient | Exp (B) | p-value | Coefficient | Exp (B) | p-value | Coefficient | Exp (B) | p-value | Coefficient | Exp (B) | p-value | Coefficient | Exp (B) | p-value | |
| Sex | 3.807 | 0.022 | 0.014** | 2.657 | 0.070 | 0.038** | 2.485 | 0.0833 | 0.060* | 4.043 | 0.018 | 0.009*** | 3.383 | 0.034 | 0.005*** | 2.970 | 0.051 | 0.032** |
| Education | 1.466 | 0.231 | 0.217 | −1.041 | 2.833 | 0.347 | 1.012 | 0.364 | 0.382 | 0.619 | 0.538 | 0.575 | 0.332 | 0.725 | 0.751 | 2.639 | 0.071 | 0.067* |
| Experience | 3.807 | 0.022 | 0.014** | 2.657 | 0.070 | 0.038** | 2.485 | 0.083 | 0.060** | 3.296 | 0.037 | 0.016** | 2.582 | 0.076 | 0.028** | 2.485 | 0.083 | 0.060* |
| Farm size (ha) | 0.368 | 0.692 | 0.781 | −2.380 | 10.80 | 0.059** | 0.773 | 0.462 | 0.575 | 0.636 | 0.529 | 0.628 | −1.28 | 3.611 | 0.272 | 1.540 | 0.214 | 0.321 |
| Information- Radio | 2.708 | 0.067 | 0.060* | −1.041 | 2.833 | 0.347 | 0.693 | 0.500 | 0.543 | 0.847 | 0.429 | 0.466 | 1.862 | 0.155 | 0.072* | 0.405 | 0.667 | 0.720 |
| Seed | 2.708 | 0.067 | 0.060* | −0.442 | 1.566 | 0.685 | 0.693 | 2.00 | 0.543 | −0.201 | 1.222 | 0.855 | −0.18 | 1.204 | 0.855 | 2.639 | 0.071 | 0.067* |
| F-to-F extension | −0.511 | 1.667 | 0.650 | 1.558 | 0.211 | 0.172 | 2.639 | 0.071 | 0.067 | 1.113 | 0.429 | 0.466 | 1.037 | 0.144 | 0.062 | 1.439 | 0.071 | 0.067* |
| Public extension | 1.466 | 0.231 | 0.217 | −0.262 | 1.300 | 0.809 | 1.872 | 0.154 | 0.136 | 2.197 | 0.111 | 0.078* | 1.275 | 0.280 | 0.213 | 1.386 | 0.250 | 0.244 |
| Nonfarm income | 1.466 | 0.231 | 0.217 | −0.629 | 1.875 | 0.565 | 2.639 | 0.071 | 0.067* | −0.619 | 1.857 | 0.575 | −0.57 | 1.767 | 0.576 | 1.386 | 0.250 | 0.244 |
| Livestock | 3.807 | 0.022 | 0.014** | 2.380 | 0.093 | 0.059** | 2.485 | 0.083 | 0.060** | 2.833 | 0.059 | 0.031** | 3.487 | 0.031 | 0.004*** | 2.110 | 0.121 | 0.103 |
| Distance to market | −1.099 | 3.000 | 0.341 | −1.041 | 2.833 | 0.347 | −2.639 | 14.00 | 0.067 | 0.201 | 0.818 | 0.855 | −0.87 | 2.400 | 0.391 | −1.386 | 4.00 | 0.244 |
| Perception-yield | 3.045 | 0.048 | 0.027** | 2.657 | 0.070 | 0.038** | 3.738 | 0.024 | 0.016** | 2.833 | 0.059 | 0.031** | 3.485 | 0.031 | 0.000** | 2.970 | 0.051 | 0.032** |
| Diagnostics | Base category (ref.) | No adaptation | No. of observations | 212 | Multicollinearity estimation (VIF) | 1.055-1.226 | ||||||||||||
| Log likelihood | −565.390 | LR χ2 | 242.58 | Prob > R2 | 0.0000 | Predicted | 72.2% | |||||||||||
Notes:
= Values statistically significant at 0.01 probability level;
= values statistically significant at 0.05 probability level;
= values statistically significant at 0.10 probability level
3.4.1.1 Gender, seed and farm size.
The results show that gender of the household head significantly affected the choice for adaptation strategies. As was expected, female-headed households are less likely to take up adaptation strategies. Farmers with access to seeds have a higher probability to adopt the following adaptation methods:
improved varieties and breeding methods; and
combination of varieties and recommended agricultural practices methods.
For most of the adaptation methods except soil and plant health methods, owning more than 4.05 ha of farmland does not significantly affect the probability of adaptation, although the coefficient on the adaptation options has a positive sign. Nevertheless, farmers with less than 4 ha were more likely to adopt advanced soil and plant health methods. This result is similar to Nyangena (2007) that states that farmers with a small land area were more likely to invest in soil conservation than farmers with a large area.
3.4.1.2 Education, farming experience, non-farm incomes and information from radio.
The results show that education of the household head increases the probability of adapting to climate change, except from adopting soil and plant health method. As was hypothesized, farmers with lower education levels are less likely to adapt than farmers with higher levels of education. In addition, the more experienced farmers are more probable to take adaptation measures than the less experienced farmers. A positive and significant effect of farming experience was observed. The study further found that farmers that had more access to weather and climate information over the radio increased the use of improved varieties (p = 0.060) and the adjustment of planting date and cultivation methods (p = 0.072). Opposite to what was hypothesized, off/non-farm incomes were negatively related to the adoption of climate change adaptation measures. However, a positive and significant relationship between off/non-farm incomes and the adoption of recommended agricultural practices was observed.
3.4.1.3 Livestock assets, distance to the market and farmers’ perceptions on yield.
As expected, the result also indicated that farmers who owned draught cattle have a significantly higher probability of taking up adaptation strategies. Only for the combination of improved varieties and good agricultural methods, this effect was found to be insignificant. As hypothesized, the distance to the market negatively affected adoption probability. Farmers’ perceptions about the impact of climate change on regional and individual farming were asked in the study. The farmers’ perception on yield losses was included as a variable in the model, and it was found that it positively and significantly increased adoption of climate change adaptation strategies.
3.4.1.4 Farmer-to-farmer extension and public extension services.
Access to farmer-to-farmer extension services increased adoption of recommended agricultural practices methods (p = 0.067), adjustment of planting date and sowing methods (p = 0.062) and the combination of improved varieties and recommended agricultural methods (p = 0.067). Also, public extension services had a positive effect on uptake of some climate change adaptation strategies; this was significant for recommended agricultural practices methods (p = 0.067), and for crop diversification and rotation methods (p = 0.078).
3.5 Barrier to climate change adaptation
A number of studies have looked into the constraints and limitations to climate change adaptation (Deressa et al., 2009, 2011; Bryan et al., 2009; Maddison, 2007; Tessema et al., 2013). In this study, farmers’ perceptions with respect to barriers to adopt climate change adaptation strategies were investigated. In Figure 6, a number of barriers are presented. During the survey, farmers claimed that these barriers hamper their adoption of adaptation measures. All farmers agreed that the intensity of rainfall is decreasing and that rainfall is unreliable. This makes it very difficult to raise seedlings and to cultivate crops. Overall, 95 per cent of the farmers agreed that there is a lack of farmland and a shortage of farm labor. In addition, the majority of the farmers are worried about the decreasing fertility of the soil and the infestation of crops by pests and diseases. In the study, farmers believed that introducing adaptation strategies need good care and management together with improving soil fertility and plant protection. Thus, farmers perceived that these are the factors hampering their decisions to adopt introduced adaptation strategies.
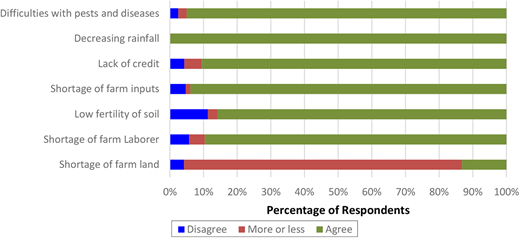
Barrier to climate change adaptation (The y-axis shows the different barriers to climate change adaptation faced by farmers)
Barrier to climate change adaptation (The y-axis shows the different barriers to climate change adaptation faced by farmers)
Moreover, farmers noticed the depletion in soil quality depletion and the occurrence of soil erosion. Furthermore, farmers face high input costs such as fertilizers and pesticides. Consequently, nearly 95 per cent of farmers reported that they do not have enough credit for farming. In some cases, farmers reported that they were paid less and not received in time, where the farmers normally need credit in busy periods such as before the start of monsoon season and at the harvesting times. Therefore, the majority of farmers mentioned that their planned adaptation strategies are altered and sometimes impeded by these barriers.
4. Conclusions and policy recommendation
The research was performed in the Magwe district in the dry zone region of Myanmar where 212 randomly chosen farm households from three townships were asked whether they have observed changes in the climate (temperature, rainfall and occurrence of droughts) and whether they adopted climate change adaptation strategies. The study not only analyzed the factors determining the farmers’ choice of adaptation methods to climate change based on the data collected during the 2014/2015 agricultural production years but also looked at adoption of adaptation strategies in the past. Ten years ago, the majority of the farmers used to apply traditional adaptation strategies and methods to counter the impact of weather events on agriculture. However, farmers noticed that the impact of climate change on regional and individual crop production became larger and started to adopt introduced adaptation strategies. In the study, some farmers have the adaptive capacity to cope with the changing climate but the majority of farmers not. While 10 years ago, the main share of the farmers was cultivating oil crops as their main income crop, presently, cropping patterns and cropping systems are more diversified. The inclusion of cash crops in the cropping patterns ensures income and food for the households.
The majority of the farmers agree that there is an impact of climate change on farming and yields. They are trying to minimize this impact by adopting adaptation strategies. The majority of the farmers adjusted the planting and system method (56.1 per cent). Only 1.9 per cent did not use any adaptation strategy. When comparing current adoption and the one 10 years ago, the study reveals that the locally available indigenous climate change adaptation methods are becoming less popular, while on the contrary, interest in introduced climate change adaptation strategies is increasing. Using an MLR model, the factors affecting the probability of taking up climate change adaptation strategies were estimated. Education of the household head and farming experience increases the probability of adoption. Therefore, it is recommended to keep investing in the education system. In addition, when farmers have to travel further to input or output markets, this decreased the probability of adopting adaptation measures in the region. The development of rural road infrastructure, improving the accessibility of market places, could therefore be a regional intervention improving farmers adaptation to climate change. This would give farmers access to inputs like seeds and may enhance the exchange of goods, services, various technologies and information with other farmers.
Looking at the marginal effects of the different independent variables in the MLR model, it can be observed that the institutional factors such as access to seeds, information access from radio, farmer-to-farmer extension service and public extension services increased the probability of uptake of introduced adaptation strategies. A better access to seeds is necessary for the farmers. Regional governments and public or private organizations should be encouraged to supply locally adapted high yielding seeds for the farmers. Farmers who received public extension services are more likely to adopt climate change adaptation strategies. Therefore, more extension services should be provided to the farmers, and formal or informal training programs or workshops should be conducted more frequently. Not only farmer-to-farmer extension activities as a proxy of social capital but also information sharing and extension services by different stakeholders as a welfare of whole communities should be carried out in the study region so that adaptive capacity of farmers will improve and the uptake of adaptation practices will be stimulated. Moreover formal training programs by public and private organization in Myanmar should focus on key farmers, or experienced farmers, to enhance rapid rural development through social and community networks. In the study, farmers reported access to credit problems. Therefore, public and private organizations should aim to give timely credit and to effectively increase the access to agricultural credits. Furthermore, government associated with agricultural organizations should facilitate access to agricultural inputs such as fertilizers and seeds. The development of public funding and rural credits markets should be carried out as an important climate adaptation policy because access to credit of farm’ households increased adoption of climate change adaptation measures.
With increasing temperature and varying precipitation patterns in the whole dry zone region, farmers’ perception clearly shows that they experience effects of climate change and that the adoption of introduced adaptation measures is increasing. However, the study highlighted some barriers to the uptake such as shortage of farmland, shortage of farm inputs, shortage of farm laborers and lack of credits. Policy makers and development planners should give priority not only to address the factors identified affecting the adoption of introduced adaptation measures but also to look at the barriers. At this moment, the government and Ministry of Agriculture and Irrigation (MOAI) in Myanmar are implementing several reform processes for the development of the agricultural sector and rural areas. The enhancement of farmers’ adaptation to climate change should be included in these reforms through providing affordable seeds and credits, providing information on climate and weather changes and stimulating better production techniques through extension at different agricultural sectors or organizations. Moreover, the government should articulate high concerns about the effects of climate change on the agricultural sector and should empower the capacity building and training, generating preparedness for improved climate change adaptation and mitigation processes.
Notes
World Bank Group: Climate Change Knowledge Portal (Verified data on Geoba.se) Geoba.se is updated in real-time from the US Census Bureau and other statistical databases worldwide.
Department of Agricultural (DOA), Magwe district, Dry zone region of Myanmar.
Department of Agriculture (DoA), Magwe District (31/12/2014).
The authors are grateful for the comments from anonymous reviewers and also extend gratitude to the editors. Aung Tun Oo is highly thankful to WWF and Russell E. Train Education for Nature Program (EFN) for the financial support to enhance capacity for conservation in Myanmar and also owe a gratitude to the Ghent University for giving him an admission to the PhD program. All remaining errors should be attributed to the authors.

