


This study investigates the impact of smart supply chain construction (SSCC) on corporate performance (CP) in European firms from 2015 to 2023. It examines how resilience and dynamic capabilities contribute to enhancing CP through improved operational efficiency and adaptability.
A mixed-methods approach was adopted, combining Difference-in-Differences (DID), necessity condition analysis (NCA) and fuzzy-set qualitative comparative analysis (fsQCA). The analysis draws on a comprehensive dataset of publicly listed European companies, identifying causal relationships and critical configurations influencing CP.
The findings reveal that SSCC significantly enhances CP by strengthening operational resilience, fostering dynamic capabilities, and optimizing resource allocation. Key drivers include proactive and reactive resilience capabilities, R&D investments and robust resource utilization. Configurations involving smart technologies and effective resource management emerged as essential enablers of superior performance.
This study uses a rarely applied multi-method empirical framework to examine SSCC’s transformative potential and integrates the resource based view (RBV) and dynamic capabilities theory. It highlights the interplay of resilience, innovation and resource management in boosting CP while addressing critical gaps in smart supply chain research. It provides empirical insights and actionable strategies for businesses and policymakers to enhance resilience and corporate performance in dynamic markets.
1. Introduction
Recognizing the critical importance of robust industrial and supply chain operations in maintaining national and global economic stability, there is growing momentum to strengthen supply chain resilience. This is essential for preserving the integrity and uninterrupted operation of industries worldwide (Quayson et al., 2023). Traditional supply chains encounter various challenges, including instability, heightened risks, emergency responses, and functional degradation, which can substantially impede industrial development and elevate enterprises’ vulnerability to disruptive events (Wu et al., 2023). In response to these challenges, this paper promotes the adoption of smart supply chains. These represent a paradigm shift, employing advanced digital technologies such as the Internet of Things (IoT), big data analytics, and intelligent hardware to revolutionize the integration of logistics, capital flows, and information systems (Ning and Yao, 2023; Liu et al., 2024; Xie and Chen, 2024).
This transformative approach aims to alleviate traditional inefficiencies and equip enterprises with the capabilities to turn potential crises into opportunities for substantial performance enhancement. Grounded in the foundational theories of the Resource-Based View (RBV) and Dynamic Capabilities Theory, this study focuses intently on enhancing supply chain resilience. These theoretical frameworks highlight the capacity of supply chain systems to adeptly integrate essential resources and dynamic capabilities, thereby equipping them to proactively anticipate, effectively manage, and swiftly recover from disruptions (Gupta et al., 2024; Song et al., 2024; Stadtfeld and Gruchmann, 2024). The RBV posits that a firm’s competitive edge is derived from owning scarce, valuable, and difficult-to-imitate heterogeneous resources such as technical expertise, patents, brand equity, and supply chain networks—assets critical for reshaping supply chain resilience. For instance, research conducted by Stentoft and Mikkelsen (2024) has shown that cross-organizational governance enhances the recovery of supply chain resilience, emphasizing the crucial roles played by supply chain collaboration and institutional environments as mediators and moderators. Further research indicates that merely possessing these resources is inadequate in environments characterized by rapid changes and unpredictability; companies must also cultivate dynamic capabilities to effectively replicate, integrate, and reallocate these resources (Han, 2024; Pattanayak et al., 2024). Despite the widespread recognition of the importance of these resources and capabilities in enhancing supply chain resilience, theoretical research in this area still needs to be developed. A notable gap exists concerning the dynamic capabilities cultivated through optimizing supply chain resilience and the specific types of heterogeneous resources obtained (Pal et al., 2024).
In this context, advancing a smart supply chain system with enhanced capabilities is crucial for enterprises aiming to overcome the limitations of traditional supply chains. Such a system can leverage the dynamic capabilities and resource advantages inherent in resilient supply chains, empowering companies to turn crises into opportunities for substantial performance gains in challenging conditions (Belhadi et al., 2024). The European Union’s implementation of policies like the Digital Transport and Logistics Forum (DTLF) represents a milestone in smart supply chain construction. This initiative seeks to harness digital technologies—such as IoT, big data, and intelligent automation—to facilitate the seamless integration of logistics, capital, and information flows, propelling supply chains toward greater intelligence, automation, and efficiency. This transformation is expected to strengthen supply chain resilience while simultaneously enhancing corporate performance significantly, positioning European enterprises to remain competitive and adaptable in a volatile global landscape.
Numerous scholars have explored the relationship between supply chains and company performance due to its significant practical implications (Alsheyadi et al., 2024; Li et al., 2024a; Singh and Joshi, 2024). Studies on supply chain disruptions reveal that unexpected crises can disrupt the normal flow of goods within the supply chain, thereby posing financial and operational risks to firms (An et al., 2024; Zhao et al., 2024). Disruptions in supply chains are commonly caused by equipment failures, shortages of raw materials, transportation issues, and supplier disruptions, like the challenges faced globally. Internationally, disruptions often stem from cross-border shipping complications, interruptions from international suppliers, and restrictive trade policies. For example, geopolitical tensions such as Brexit have compelled companies to revaluate their supplier and production bases, negatively impacting the performance of export-oriented firms. On the flip side, supply chain governance, encompassing relationally driven and contractually based governance, can mitigate the risks associated with supply chain disruptions and positively affect corporate performance. These governance mechanisms facilitate the breakdown of information barriers through formal and informal communications between firms, continuously optimizing supply chain structures (Marttinen et al., 2023; Nurhayati et al., 2023).
Despite the recognized importance of resources and capabilities for enhancing supply chain resilience, empirical research in this area remains limited. Specifically, there is a need to investigate how dynamic capabilities and key resources, within a unified analytical framework, contribute to resilience and corporate performance. The existing literature often emphasizes the adverse impacts of supply chain disruptions while overlooking the proactive role that smart supply chains play in resilience optimization and performance enhancement (Deiva Ganesh and Kalpana, 2022; Espahbod et al., 2024; Zhao et al., 2023). Existing studies also lack robust empirical frameworks, often relying on descriptive surveys or meta-analyses that may introduce subjectivity and fail to establish causality.
In this context, developing a smart supply chain system with enhanced functionalities is essential for enterprises seeking to overcome the limitations of traditional supply chains. Such systems leverage digital technologies to build resilience, proactively manage risks, and transform disruptions into opportunities for growth (Belhadi et al., 2024; Tian et al., 2024). The European Union’s Digital Transport and Logistics Forum (DTLF) represents a landmark initiative in the development of smart supply chains. This policy seeks to harness digital technologies—including IoT, big data, and intelligent automation—to drive seamless integration across logistics, capital flows, and information systems, thus facilitating a comprehensive, intelligent, and automated upgrade of supply chains. The resulting transformation is expected to bolster both supply chain resilience and corporate performance, equipping European enterprises to remain competitive in an increasingly unpredictable global market. Given this context, this paper addresses the following core questions:
How does SSCC influence and enhance CP in dynamic and competitive market environments?
What role do supply chain resilience and other critical factors play in strengthening and sustaining the effect of SSCC on CP?
To address these questions, this study integrates the Resource-Based View (RBV) and Dynamic Capabilities Theory (DCT) to unpack how SSCC translates into improved corporate performance. While prior research has emphasized either digital transformation or resilience independently, few studies have examined how resilience optimization serves as a strategic conduit through which smart supply chains foster dynamic capability development and enable more effective resource orchestration. By conceptualizing resilience as a composite of proactive capability, reactive capability, and supply chain design quality, this study introduces a novel mechanism-based perspective to explain performance heterogeneity among firms adopting SSCC. In doing so, it advances theoretical understanding and provides actionable insights for aligning smart supply chain strategies with organizational capabilities and contextual readiness, informing more targeted and adaptive policy and managerial interventions.
The remainder of the paper is organized as follows. Section 2 reviews the relevant literature and develops the study’s theoretical framework and hypotheses. Section 3 details the empirical methodology, including data, models, and analytical strategies. Section 4 presents the results from the multi-method analysis. Section 5 offers a discussion of theoretical and managerial implications, along with directions for future research. Section 6 concludes with a summary of the key contributions and policy relevance.
2. Literature review and hypotheses development
2.1 Policy background
In recent decades, the global push for more resilient, efficient, and technologically advanced supply chains has intensified, with countries around the world implementing strategic initiatives to enhance supply chain performance and competitive advantage (Junaid et al., 2023). This trend, particularly prominent in Western economies since the late 1990s, has emphasized the role of digital technology in overcoming the inefficiencies of traditional supply chains and building smarter, more adaptable systems (Mak and Max Shen, 2021; Michel et al., 2024). The European Union has responded to these developments with significant policy efforts aimed at fostering smart supply chain construction as a foundation for economic resilience and sustainable growth. A significant policy initiative spearheading the transformation within the European Union is the Digital Transport and Logistics Forum (DTLF). Implemented in two phases, DTLF I (2015–2018) and DTLF II (2018–2023)—this initiative was launched to advance the digitalization of the logistics and transport sectors while fostering the development of integrated and intelligent supply chain systems across Europe. The DTLF framework underscores the importance of digital interoperability and seamless data exchange to strengthen coordination, boost operational efficiency, and enhance resilience both within and across supply chain networks. This vision aligns with global strategic movements such as the United States’ reindustrialization efforts, Germany’s Industry 4.0 agenda, and Japan’s Future Investment strategy, all of which highlight the pivotal role of smart technologies such as the Internet of Things (IoT), big data analytics, and cloud computing in shaping the future of supply chain management (Kassa et al., 2023; Lee et al., 2023; Zhang et al., 2023).
The DTLF policy seeks to create a unified, digital framework across member states, facilitating seamless data flow between supply chain participants. By leveraging technologies such as IoT and real-time analytics, the EU aims to foster a digital ecosystem that enhances supply chain visibility, traceability, and response capacity, ultimately driving sustainable, intelligent, and automated upgrades in supply chain management. These improvements are expected to reduce delays, lower costs, and mitigate risks associated with supply chain disruptions, thus improving corporate performance and industry resilience (Shekarian and Mellat Parast, 2021; Sudan et al., 2023). In the context of increasing global uncertainties—from geopolitical shifts to environmental disruptions—smart supply chain policies like the DTLF serve as strategic “safety nets” and “stabilizers” for the European economy. They aim to position European industries to proactively manage risks and maintain operational continuity even in adverse conditions (Britsche and Fekete, 2024; De Giovanni, 2021; Wang, 2024). Research shows that companies leveraging digital supply chain technologies can better anticipate market changes, manage cross-border logistics, and reduce vulnerabilities, giving them a distinct competitive edge in volatile environments (Nayal et al., 2024; Sun et al., 2024a).
Although Smart Supply Chain Construction (SSCC) builds upon the foundations of digital supply chain management and Industry 4.0, it goes significantly further in its strategic orientation and systemic integration. Traditional digital supply chain strategies typically focus on adopting specific technologies such as IoT sensors, cloud computing, or automation to improve operational efficiency. In contrast, SSCC involves the orchestration of these technologies into an adaptive, learning-oriented architecture that enables real-time responsiveness, strategic agility, and end-to-end visibility. For example, rather than merely digitizing procurement or logistics, an SSCC-enabled firm uses advanced analytics to simulate supplier disruptions, reconfigure sourcing strategies dynamically, and automate mitigation responses across global networks. This higher-order integration redefines digital transformation from a tool-centric upgrade to a capability-driven framework for navigating uncertainty and complexity. As such, SSCC can be understood as a meta-capability that operationalizes dynamic capabilities through digitally intelligent infrastructure and decision-making processes (Madhavaram et al., 2022; Mueller-Saegebrecht and Walter, 2025).
By integrating smart technologies, the DTLF policy supports Europe’s commitment to sustainable and resilient supply chain practices contributing to long-term economic stability. It aligns with broader EU goals, such as the European Green Deal, which emphasizes carbon reduction and resource efficiency across industries. Through smart supply chain initiatives, the EU is not only enhancing operational resilience but also encouraging environmentally sustainable practices, helping companies reduce waste, optimize resource use, and limit environmental impacts (Bechtsis et al., 2022; Demir et al., 2023). The DTLF policy represents a significant milestone in the EU’s effort to establish a resilient, sustainable, and competitive supply chain ecosystem. By fostering digital collaboration and innovation within supply chain management, the DTLF aligns the EU’s industrial strategies with global trends while positioning Europe as a leader in sustainable and smart supply chain transformation. As technological advancements continue to evolve, policies like the DTLF are instrumental in shaping resilient supply chains that support corporate performance and contribute to a stable and sustainable global economy (Hassanein et al., 2023; Sharma et al., 2024).
2.2 Technological innovations in SSCM
Smart technologies have transformed traditional logistics operations into highly responsive, efficient, and proactive systems. This shift is predominantly driven by integrating the Internet of Things (IoT), artificial intelligence (AI), big data analytics, and other digital innovations. These technologies facilitate real-time monitoring, predictive maintenance, and efficient resource management, significantly enhancing the adaptability of supply chains to disruptions. Sun et al. (2024a, b, c) and Zhang et al. (2023) emphasized the crucial role of IoT in achieving greater transparency and faster response times, which is essential for maintaining continuous operations amidst disruptions. Similarly, Belhadi et al. (2024) and de Vass et al. (2021) discussed how cloud computing complements IoT by providing the necessary infrastructure for data integration and real-time analytics, further enhancing operational efficiency.
The integration of AI and machine learning into supply chains has been a focus of extensive research. Pasupuleti et al. (2024) demonstrated how these technologies optimize inventory management and improve demand forecasting, crucial for minimizing overstock and stockouts. Liu et al. (2022) and Belhadi et al. (2022) highlighted the pivotal role of big data analytics in decoding complex supply chain dynamics and facilitating strategic decision-making, thus enhancing responsiveness to market changes and disruptions. Additionally, Dong et al. (2024), Li et al. (2022), and Feng et al. (2020) explored how blockchain technology could add a layer of security and transparency, particularly in tracking and tracing product provenance, which is vital for industries like pharmaceuticals and high-value electronics.
Effective governance in smart supply chains necessitates sophisticated interactions across various stakeholders to ensure seamless operation and compliance. Ben Yahia et al. (2021) stressed the importance of robust governance structures that support effective collaboration across global networks. Khan et al. (2024) investigated the impacts of relational and contractual governance on maintaining stable and reliable operations, which is essential for minimizing risks associated with global sourcing and production. Additionally, Fan and He (2023) and Zhao et al. (2023) explored how digital platforms could facilitate better communication and cooperation among supply chain partners, thereby enhancing the overall agility and resilience of the network.
Dynamic capabilities within supply chains refer to the organization’s ability to adapt, integrate, build, and reconfigure internal and external competencies in response to external changes and disruptions. Ramos et al. (2023) highlighted that these capabilities are crucial for firms operating in volatile environments, enabling them to swiftly adapt and maintain a competitive edge. Tian et al. (2024) delved deeper into how these capabilities facilitate the integration of innovative technologies and sustainable practices into core supply chain processes, promoting a more agile and responsive framework.
Incorporating sustainability into supply chain practices is increasingly recognized as vital for enhancing resilience. Shen et al. (2023) argued that sustainable practices address environmental and ethical concerns and bolster overall resilience and stability. These practices, including green sourcing and adherence to fair labor standards, help firms mitigate risks and enhance their reputations, crucial in a market that highly values corporate responsibility. Furthermore, Sun et al. (2024a, b, c) examined how sustainability initiatives could reduce carbon footprints and improve supply chain efficiency by minimizing waste and optimizing resource use.
Table 1 provides a summary of key literature on smart supply chains, showcasing critical advancements in areas such as technological innovations, governance frameworks, dynamic capabilities, and sustainability practices. Beyond summarizing these contributions, the table identifies notable research gaps, including the need for contextual adaptation of smart technologies, deeper insights into operational-level implementations, and the scalability of innovations across diverse supply chain environments. These gaps underscore the necessity for future research to develop more integrated, adaptive, and resilient supply chain frameworks, aligning with the demands of rapidly evolving technological landscapes and market complexities.
Summary of key literature
| Study reference | Methods used | Focus area | Key findings | Practical implications | Identified gaps |
|---|---|---|---|---|---|
| Sharma et al. (2024) | Survey (267 firms), SEM | AI capabilities and digital divide in supply chain performance | Exploitative AI improves efficiency but reduces resilience | Balance AI strategies for resilience-efficiency trade-offs | Limited exploration of AI in different contexts and digital divide effects |
| Tian et al. (2024) | PLS-SEM, Survey (311 firms) | Datafication, IoT, and AI in supply chain performance | Datafication boosts resilience and innovativeness | Leverage Industry 4.0 technologies to enhance resilience | Need for focus on datafication in developing countries |
| Sharma et al. (2025) | Survey (234 firms), SEM, ANN | IGRASS framework (I4.0, Green, Resilient, Agile, Smart, Sustainable SC) | Smart and green practices foster resilience and agility, enhancing sustainable business performance. Resilience had the strongest effect | Firms should invest in digital-green capabilities and focus on resilience and agility for sustainability | Limited empirical studies integrating IGRASS elements and exploring their dynamic links |
| Ghomi et al. (2023) | Mixed-integer linear programming | Flexibility, innovation, and resilience under disruption risk | Flexibility and innovation reduce disruption impacts | Invest in flexibility and innovation for resilience | Limited empirical validation of strategies |
| Al Mamun et al. (2025) | Survey (355 firms), PLS-SEM | Big data analytics (BDA) ‘s impact on agility, adaptability, GRSC, and firm performance | BDA boosts agility, adaptability, and GRSC, which together enhance performance. GRSC mediates these relationships | Invest in BDA to drive ambidexterity and green practices for better performance | Few studies integrate BDA, ambidexterity, and GRSC in a unified framework |
| Shen et al. (2023) | Meta-analysis, MASEM | Resilience, integration, and performance in supply chains | Integration mediates the resilience-performance relationship | Highlight integration’s role in resilience strategies | Address heterogeneity in industries and national contexts |
| Yang et al. (2024) | Smart-PLS, Survey | Emerging IT, vigilance, and supply chain resilience | IT vigilance and capabilities enhance resilience and sustainability | Bridge survival and development adaptations | Single-country data limits generalizability |
| Yan et al. (2023) | Stackelberg game model | Decision-making in supply chain resilience strategies | Centralized decision-making enhances resilience | Promote centralized investments for SC resilience | Narrow focus on supplier-side investments |
| Gao et al. (2025) | Secondary data (2010–2021), survey of 511 firms, chain mediation analysis | AI adoption’s impact on innovation via digital adaptability and market perception | AI improves innovation capability through adaptability and perception | Firms should boost adaptability and market awareness to fully leverage AI for innovation | Few studies link AI, dynamic capabilities, and innovation through mediators |
| Kassa et al. (2023) | Bayesian networks analysis | AI’s role in supply chain resilience | AI improves readiness, response, and recovery phases | Use AI frameworks to enhance resilience strategies | Lack of focus on the growth phase of supply chain resilience |
| Sun et al. (2024b) | Bootstrap analysis with Questionnaire survey | Supply chain learning and sustainability | Learning improves sustainability through innovation | Foster innovation and knowledge acquisition in SC | Discuss implementation challenges |
| Liu et al. (2022) | Multi-case study (Chinese firms) | Smart tech and supply chain innovation | Smart technologies enhance supply chain innovation and collaboration | Link digital transformation to supply chain performance | Limited cross-industry analysis |
| Zhao et al. (2023) | Survey, Multi-mediation analysis | Digitalization’s effect on supply chain resilience and performance | Digitalization improves supply chain resilience and performance | Promote digitalization to strengthen supply chain capabilities | Insufficient focus on moderating effects and industries |
| Belhadi et al. (2022) | SEM, Survey (279 firms) | AI’s impact on supply chain resilience and performance | AI enhances short-term performance and long-term resilience | Leverage AI for resilience and sustainable performance | Insufficient exploration of supply chain dynamism effects |
| Fan and He (2023) | Panel data, FE/RE Models | Digital transformation and supply chain concentration | Digital transformation boosts performance | Integrate SC concentration strategies in transformation | Mechanisms of transformation need exploration |
| Li et al. (2022) | Blockchain-supported business models | Blockchain’s role in resilience and performance | Blockchain improves resilience through business model design | Adopt blockchain for strategic resilience | Empirical validation across broader contexts is needed |
| Khan et al. (2024) | Interpretive structural modeling | Critical factors in digital supply chains | Identified 15 critical factors for digital SC adoption | Guide managers in implementing digital SC strategies | Limited focus on operational-level decision-making |
| Sun et al. (2024c) | Panel simultaneous equation model | AI transformation and supply chain risk management | AI transformation improves risk-taking capacity | Enhance risk management through centralized supply chain strategies | Need for clarity on AI’s role in supply chain risk-taking |
| Dong et al. (2024) | Model evaluation for blockchain | Blockchain’s benefits in supply chain management | Blockchain enhances traceability, transparency, and decentralization | Incorporate blockchain for improved supply chain transparency | Limited research on blockchain’s impact on smart supply chain |
| Ning and Yao (2023) | SEM, Survey | Digital transformation’s impact on supply chain capabilities | Digital transformation enhances supply chain capabilities and performance | Strengthen supply chain capabilities via digital transformation | Insufficient focus on transformation antecedents |
| Liu et al. (2024) | Event study (174 announcements) | Digital supply chain (DSC) announcements and stock market performance | DSC announcements positively impact market performance | Leverage DSC announcements for market confidence | Focus is limited to short-term market reactions |
2.3 Theoretical background and framework
The theoretical foundation of this study integrates two widely recognized perspectives: Dynamic Capabilities Theory (DCT) and the Resource-Based View (RBV). Both frameworks offer insights into how Smart Supply Chain Management (SSCM) enhances resilience and improves Corporate Performance (CP).
Building on the principles of DCT, as articulated by Teece et al. (1997) and further refined by Teece (2018) and Loureiro et al. (2021), supply chain resilience is a firm’s ability to anticipate, adapt, and recover from disruptions. Resilience is characterized by a combination of proactive capabilities (anticipating and mitigating risks), reactive capabilities (rapid recovery from disruptions), and supply chain design quality (building flexibility and adaptability). These capabilities allow firms to respond effectively to external shocks and maintain operational continuity, crucial for sustaining competitive advantage in dynamic environments (Ghomi et al., 2023). The capacity to continuously reconfigure resources and adapt processes is central to supply chain resilience, enabling firms to thrive despite uncertainty (Yan et al., 2023; Cinti et al., 2025; Singh and Modgil, 2025).
Resilience, conceptualized here as an emergent outcome of dynamic capabilities, specifically emerges from a firm’s proactive and reactive capabilities and adaptive supply chain design. Drawing on DCT, resilience represents the firm’s meta-capability to sense disruptions, seize opportunities swiftly, and reconfigure resources effectively (Teece, 2007; Stadtfeld and Gruchmann, 2023; Bouguerra et al., 2023). Thus, resilience is not a static trait but a strategic capability dynamically shaped by continuous managerial interventions, learning, and resource reconfiguration processes. Under the DCT lens, resilience materializes when firms consistently realign their internal processes and external relationships in response to disruptions.
The Resource-Based View (RBV), initially formulated by Barney (1991) and further expanded by Lockett et al. (2009), underscores the importance of leveraging valuable, rare, and inimitable resources to achieve competitive advantage. In the context of SSCM, the RBV highlights how the integration of SSCM into supply chain operations enables firms to optimize resources such as skilled labor, cost management systems, financial support, and innovation networks. These integrated resources create a foundation for sustained performance improvement, allowing firms to manage external shocks better and capitalize on strategic partnerships for innovation. Recent research by Tiwari (2024) and Pattanayak et al. (2024) emphasizes that the alignment of SSCM with RBV enhances a firm’s ability to exploit its resources efficiently and effectively in the face of external pressures.
More recent studies also expand on the synergy between DCT and RBV in SSCM. Ning and Yao (2023) emphasizes the role of digital supply chain technologies in enhancing dynamic capabilities, while (Dwaikat et al., 2022) demonstrate how SSCM can transform supply chain resilience by enabling faster recovery and resource reallocation after disruptions. Additionally, Yang et al. (2024) underscores the importance of advanced analytics and AI in improving both resilience and resource utilization, aligning with both DCT and RBV. In combining Dynamic Capabilities Theory and the Resource-Based View, this study posits that SSCM not only strengthens supply chain resilience but also acts as a platform for integrating and optimizing critical resources. This study positions Smart Supply Chain Construction (SSCC) as a next-generation meta-capability that enables firms to synchronize digital technologies, operational intelligence, and adaptive coordination under high uncertainty. Rather than simply applying established theories such as the RBV and DCT, this research refines and expands them in several key directions. First, SSCC is framed not as a conventional digital solution or Industry 4.0 toolset but as a transformational orchestration system that reconfigures interfirm networks in volatile and disrupted markets. Second, resilience is conceptualized not as an isolated capability but as an emergent outcome of embedded dynamic capabilities, particularly those supported by real-time traceability, automated responsiveness, and predictive analytics. Third, the paper introduces a theory-informed set of boundary conditions, including digital maturity, absorptive capacity, institutional alignment, and capital constraints, which shape when and where SSCC succeeds or underperforms. In contexts lacking foundational readiness, SSCC may become a source of inefficiency or even disruption amplification. These conceptual refinements sharpen the theoretical distinction between SSCC and traditional digital supply chain strategies, offering a more differentiated and conditional understanding of how dynamic and resource-based mechanisms influence corporate performance.
The framework presented in Figure 1 positions Smart Supply Chain Management (SSCM) is a critical driver of improved Corporate Performance (CP), working through several interconnected mechanisms. By optimizing supply chain resilience, fostering the development of dynamic capabilities and being influenced by essential moderating factors such as R&D expenditure, GDP, and employment, SSCM helps organizations navigate complex environments and enhance operational effectiveness. This logical framework encapsulates these processes into four key components: SSCM Implementation, Supply Chain Resilience Optimization, Dynamic Capabilities Development, and Moderating Factors, all of which collectively contribute to significant improvements in cost reduction, profitability, and sustainability.
 The flowchart begins at the top with a dashed box labeled “S S C M Implementation.” An arrow leads down to a box labeled “Supply Chain Resilience Optimization.” Three arrows branch down from this box. The left arrow leads to a box labeled “Proactive Capabilities: Predictive risk management and mitigation.” The middle arrow leads to “Reactive Capabilities: Speed of recovery from disruptions.” The right arrow leads to “Supply Chain Design Quality: Flexibility and adaptability in network design.” An arrow goes down from “Supply Chain Design Quality” to “Dynamic Capabilities Development.” Two arrows lead downward from “Dynamic Capabilities Development.” The short downward arrow on the right leads to “Moderating Factors: R and D Expenditure, G D P and Employment.” The long downward arrow on the left from “Dynamic Capabilities Development” leads to a dashed box labeled “Corporate Performance.” A short downward arrow from “Moderating Factors:“ also points to “Corporate Performance.” Three downward arrows emerge from “Corporate Performance” to boxes labeled “Cost Reduction,” “Profitability,” and “Sustainability”.
Framework for SSCM implementation and corporate performance outcomes. Source(s): Authors’ own work
The flowchart begins at the top with a dashed box labeled “S S C M Implementation.” An arrow leads down to a box labeled “Supply Chain Resilience Optimization.” Three arrows branch down from this box. The left arrow leads to a box labeled “Proactive Capabilities: Predictive risk management and mitigation.” The middle arrow leads to “Reactive Capabilities: Speed of recovery from disruptions.” The right arrow leads to “Supply Chain Design Quality: Flexibility and adaptability in network design.” An arrow goes down from “Supply Chain Design Quality” to “Dynamic Capabilities Development.” Two arrows lead downward from “Dynamic Capabilities Development.” The short downward arrow on the right leads to “Moderating Factors: R and D Expenditure, G D P and Employment.” The long downward arrow on the left from “Dynamic Capabilities Development” leads to a dashed box labeled “Corporate Performance.” A short downward arrow from “Moderating Factors:“ also points to “Corporate Performance.” Three downward arrows emerge from “Corporate Performance” to boxes labeled “Cost Reduction,” “Profitability,” and “Sustainability”.Framework for SSCM implementation and corporate performance outcomes. Source(s): Authors’ own work
2.3.1 SSCM implementation
Smart Supply Chain Construction (SSCC) marks a shift from traditional digital supply chain strategies by emphasizing adaptability, learning, and strategic transformation rather than solely automation and process integration. While conventional digitalization focuses on improving operational efficiency through technologies such as ERP systems, RFID, and real-time visibility tools, SSCC reflects a more comprehensive and capability-oriented approach. It embeds intelligent technologies into the firm’s core routines and decision processes, allowing organizations to sense disruptions, interpret complex signals, and adjust operations in near real-time (Ivanov et al., 2019; Vieira Barcelos et al., 2024).
In this study, we adopt SSCC as more than a technological upgrade; it is treated as a strategic enabler that advances both resource orchestration and organizational adaptability. Drawing upon RBV and DCT, we move beyond traditional static interpretations of firm resources. Instead, SSCC is framed as an evolving architecture that supports the development and renewal of internal capabilities. Resilience is conceptualized not as a reactive buffer to external shocks but as a dynamic capability that enables proactive sensing, rapid response, and continuous recovery. Predictive analytics, modular supply chain design, and digitally connected ecosystems contribute to this capability development (Teece, 2007; Brandon-Jones et al., 2014; Chandrakant Kandarkar and Ravi, 2024).
However, the performance impact of SSCC is not uniform across contexts. The effectiveness of implementation depends on several organizational and institutional conditions, such as a firm’s absorptive capacity, the alignment between digital initiatives and corporate strategy, and the level of institutional support available. In their absence, SSCC initiatives may result in fragmented execution, poor integration, or limited return on investment (Shao et al., 2021; Shoomal et al., 2024). These contingencies highlight the need for a more nuanced understanding of the factors that enable or constrain SSCC’s potential. This perspective brings together technology, organizational strategy, and capability development to offer a comprehensive view of how SSCC contributes to corporate performance. It also lays the conceptual groundwork for the empirical analysis that follows, where we investigate how SSCC interacts with firm-specific and contextual conditions to shape outcomes.
2.3.2 Supply chain resilience optimization
Supply chain resilience, which is essential for maintaining operational stability in dynamic and volatile environments, is greatly improved through Smart Supply Chain Management (SSCM) by addressing three critical dimensions. First, proactive capabilities empower firms to foresee and mitigate risks before they manifest. By using predictive analytics, SSCM enables companies to monitor patterns and detect potential threats such as natural disasters, geopolitical risks, market volatility, or supplier interruptions. With this foresight, businesses can develop comprehensive contingency plans, pre-emptively addressing these risks to minimize their impact and bolster resilience. This forward-thinking approach ensures that potential disruptions are met with preparedness, reducing the likelihood of severe operational consequences. Second, reactive capabilities come into play when unforeseen disruptions do occur. SSCM facilitates real-time information sharing across the supply chain, enabling firms to quickly respond to changes in supply and demand. This rapid adjustment allows companies to minimize downtime caused by transportation delays, production halts, or supply shortages. The ability to react swiftly to disruptions ensures that operations are restored efficiently, preventing extended lapses that could negatively affect profitability and customer satisfaction. Lastly, adaptive supply chain design is another element that SSCM enhances, allowing firms to build more flexible and agile supply chains. By strategically diversifying suppliers, establishing alternative logistics channels, and maintaining flexible production systems, companies are better equipped to handle sudden changes in the environment. The agility gained through SSCM means that companies can reroute operations or shift resources more effectively when unexpected disruptions arise, ensuring continuity of operations. Together, these dimensions of supply chain resilience—proactive risk management, efficient reactive responses, and adaptive design—equip firms with the capabilities to thrive even in uncertain market conditions, safeguarding both operational stability and profitability.
2.3.3 Supply chain design quality
In discussing adaptive supply chain design, it is essential to highlight the optimization of supply chain networks, which SSCM enables through innovations like multi-tier supplier diversification and the use of digital twins. By diversifying suppliers across multiple tiers, companies reduce their dependency on any single supplier, thereby enhancing their ability to adapt to disruptions. This creates a more resilient network capable of withstanding unexpected changes in supply availability. Additionally, digital twins—virtual simulations of physical supply chains—allow firms to model various disruption scenarios, evaluate potential outcomes, and optimize their operations proactively. This technology enables more informed decision-making regarding route optimization, inventory management, and contingency planning. These improvements in supply chain design quality bolster overall resilience, ensuring companies can not only respond effectively to disruptions but also maintain operational continuity and profitability.
2.3.4 Dynamic capabilities development
Dynamic Capabilities Development is crucial for maintaining a competitive edge in rapidly changing markets. Once supply chain resilience is optimized through SSCM, firms can leverage dynamic capabilities to continuously adapt and reconfigure resources. SSCM enables firms to identify opportunities, address challenges, and innovate by integrating real-time data and insights from across the supply chain. Key aspects of dynamic capabilities include continuous innovation, where SSCM fosters ongoing improvements in operations, allowing firms to respond quickly to market shifts and technological advances. Additionally, collaboration is enhanced through SSCM, enabling seamless communication with supply chain partners, facilitating co-innovation and joint problem-solving.
The flexibility provided by SSCM also ensures that firms can adapt to new technologies and changing customer demands, allowing them to stay competitive. Lastly, process improvement is continuous, as SSCM allows companies to monitor performance and refine operations, ensuring efficiency and responsiveness in the face of evolving market conditions. In summary, SSCM empowers firms to develop dynamic capabilities, fostering agility, innovation, and sustained performance in an ever-changing environment.
2.3.5 Moderating factors
The positive impact of SSCM on corporate performance is largely influenced by key external factors, particularly R&D expenditure and macroeconomic conditions like GDP growth and employment levels. Firms that invest heavily in research and development are better positioned to fully leverage the potential of SSCM. By adopting cutting-edge technologies and embracing innovative practices, these companies continuously enhance their supply chain operations, maintaining a competitive edge in dynamic and rapidly evolving markets. The more substantial the R&D investment, the better equipped firms are to drive technological advancements, improve operational efficiency, and elevate overall performance through SSCM.
Furthermore, favorable macroeconomic conditions, such as robust GDP growth and high employment rates, create a fertile environment for maximizing the benefits of SSCM. In periods of economic expansion, rising demand allows companies to capitalize on SSCM’s enhanced capabilities, such as improved forecasting, streamlined operations, and more effective resource management. Greater access to resources, including skilled labor and financial capital, also facilitates the smoother implementation of SSCM strategies. Conversely, during times of economic downturn or declining demand, the advantages of SSCM may be constrained by limited resources and reduced market opportunities. In such challenging economic conditions, even advanced supply chain systems may struggle to achieve optimal performance, highlighting the critical role that external economic factors play in determining the overall success of SSCM initiatives.
2.3.6 Corporate performance (CP) outcomes
The primary objective of SSCM is to enhance Corporate Performance (CP), which is achieved through three key outcomes: cost reduction, profitability, and sustainability. SSCM plays a crucial role in driving cost reduction by optimizing resource utilization, improving operational efficiency, and minimizing the impact of disruptions. Through proactive planning, predictive analytics, and real-time data visibility, firms can avoid unnecessary expenditures, streamline operations, reduce lead times, and effectively manage inventory, ultimately lowering overall costs across the supply chain. In terms of profitability, SSCM enables firms to be more agile and responsive to market fluctuations, better meeting customer demands and capitalizing on new opportunities. The improved flexibility and responsiveness allow businesses to enhance customer satisfaction, offer faster service, and capture a greater share of the market, all of which contribute to increased sales and higher profit margins.
Furthermore, SSCM plays a pivotal role in advancing sustainability by embedding environmentally responsible practices into supply chain operations—such as reducing carbon emissions, minimizing waste, and implementing green logistics. Firms that adopt such practices not only align with evolving regulatory standards but also enhance brand equity and customer loyalty, thereby reinforcing long-term strategic viability. These sustainability initiatives can also create competitive advantages, as markets and stakeholders increasingly value ethical and eco-conscious business conduct. Taken together, these insights underscore SSCM’s value as a holistic strategy for enhancing corporate performance across environmental, operational, and reputational dimensions. Based on this conceptual foundation, the following research hypotheses are proposed:
SSCM positively impacts CP by enhancing supply chain resilience and operational efficiency.
The positive relationship between SSCM and CP is further enhanced by internal organizational factors such as R&D expenditure and total assets.
External conditions, including employment levels and GDP, moderate the relationship between SSCM and CP, influencing its overall effectiveness.
3. Data sources and methodology
3.1 Data sources
This study evaluates the influence of the Digital Transport and Logistics Forum (DTLF) policy, a landmark initiative in Smart Supply Chain Construction (SSCC), on Corporate Performance (CP). To ensure a comprehensive analysis, data was meticulously gathered from publicly listed European companies operating across major stock exchanges, including Euronext and the Deutsche Börse, particularly those with significant operations or supply chain linkages within the European Union (EU). The dataset covers the years 2015–2023 and incorporates a treatment group (companies directly impacted by the DTLF policy) and a control group (companies with limited or no exposure to the policy). Data from 80 publicly listed companies on major European Stock Exchanges has been used. In this study, 80 selected publicly listed companies are divided into two categories: those exposed to the SSCC policy (60 companies) and those not exposed (20 companies). Companies those exposed to the SSCC policy are classified as the treatment group, while those not exposed are classified as the control group, thus forming the foundation for a Difference-in-Differences (DD) model. In the study, SSCC exposure is measured based on whether a company is subject to SSCC policy requirements, including SSCC-related disclosures. Companies disclosing information in their reports regarding adherence to SSCC regulations are considered “exposed” and are included in the treatment group, while those that fail to meet these criteria are included in the control group. This design facilitates a balanced and robust comparative analysis, ensuring the findings are meaningful and applicable.
Building on this classification, we further tested the robustness of our results by conducting a placebo-adjusted Difference-in-Differences (DiD) analysis. This approach involved randomly assigning placebo treatment status to firms originally categorized as non-adopters and re-estimating our DiD models. The results consistently showed no significant treatment effects, suggesting that the observed outcomes are unlikely to be influenced by potential misclassification of firms that may have adopted SSCC without formal disclosure. This reinforces the validity of our classification strategy and supports the parallel trends assumption that underpins causal inference in DiD designs. The robustness of this approach is supported by established econometric literature, including Roth (2022), Goodman-Bacon (2021), and Bertrand et al. (2004), who provide strong guidance on ensuring identification integrity in DiD estimation frameworks.
The selection of companies was guided by the availability of relevant data on corporate performance metrics and supply chain capabilities during the study period. Reliable and extensive data sources, including Bloomberg and Eurostat, were utilized to compile financial, operational, and macroeconomic information.
3.2 Empirical model
We first employ the Difference-in-Differences (DID) approach to assess the impact of Smart Supply Chain Construction (SSCC) on Corporate Performance (CP), considering significant time trend differences between the treatment and control groups. The DID model is widely used for evaluating policy impacts by comparing outcomes across treatment and control groups over time, particularly in assessing government policies (Athey and Imbens, 2002; Kang et al., 2020; Xu and Li, 2020; Zhou et al., 2021). By controlling for time trends affecting both groups, DID isolates the causal impact of SSCC on CP. The research design for the DID approach in this study is illustrated in Table 2, which outlines the setup for both the treatment and control groups before and after the policy implementation. This design allows for isolating the Average Treatment Effect on the Treated (ATET) through the interaction term.
The Difference-In-Differences (DID) research design
| Group | Before treatment | After treatment | After-before |
|---|---|---|---|
| Treatment group | + | + + + | + |
| Control group | + | ||
| Treatment- control | + |
DID is suitable for SSCC evaluation as it accounts for temporal influences on CP that may otherwise bias results (Bertrand et al., 2004). The DID model is formulated as:
Where represents corporate performance for the firm at time , is a time dummy for post-SSCC implementation periods (1 for 2018 onward, 0 otherwise), distinguishes treatment from control groups (1 for SSCC-exposed firms, 0 otherwise), and , the interaction term , measures the Average Treatment Effect on the Treated (ATET), isolating SSCC’s impact on CP. includes control variables like firm size and R&D expenditure (Hassanein et al., 2023), is a constant, and is the error term.
To improve robustness, firm and time fixed effects are added to control for unobserved firm-specific characteristics and time-based shocks:
Additionally, to evaluate the moderating effects of R&D Expenditure and GDP on SSCC’s impact, interaction terms are introduced:
Where, and capture the amplifying effects of R&D and GDP on SSCC’s impact. Positive coefficients for these terms would suggest that firms with higher R&D investments or operating in favorable economic conditions see enhanced CP benefits from SSCC. The DID model also relies on the parallel trend assumption, which posits that in the absence of SSCC, both treatment and control groups would follow similar CP trends. A pre-treatment trend analysis confirms this assumption:
Where denotes pre-policy period indicators. Insignificant coefficients support the assumption, validating the DID’s causal inference.
To validate the DID design, we performed a visual inspection of pre-treatment trends and applied Granger causality tests, both of which supported the parallel trends assumption. To further enhance causal inference and address potential selection bias, we implemented a placebo test as a robustness check to assess whether any treatment effect appeared prior to the policy’s implementation. The placebo-adjusted Difference-in-Differences (DID) estimates revealed no significant pre-treatment effects, reinforcing the credibility of our main findings. Additionally, although we considered using instrumental variable (IV) methods to address potential endogeneity, the lack of valid exogenous instruments led us to rely on fixed effects and robust standard errors as a more feasible and reliable approach.
Next, we incorporate Necessity Condition Analysis (NCA) to examine the indispensable factors required to achieve high CP outcomes under SSCC. Unlike DID, which focuses on causality, NCA assesses essential conditions that must be present to yield benefits from SSCC, such as supply chain infrastructure and digital resources (Dul, 2016a; Vis and Dul, 2018). NCA employs ceiling lines—specifically, the Ceiling Envelope Free Disposal Hull (CE-FDH) and Ceiling Regression Free Disposal Hull (CR-FDH)—to calculate effect size and quantify constraints on CP outcomes, where lower ceiling lines indicate stronger constraints. Additionally, NCA produces a bottleneck table that defines minimum levels of crucial variables like R&D, resource allocation, and supplier partnerships, which firms need to meet to ensure SSCC-driven improvements (Dul, 2016b). This identification of essential conditions aligns with research on critical success factors in sustainable supply chains (Teece et al., 1997).
Furthermore, we employ fuzzy-set Qualitative Comparative Analysis (fsQCA) to uncover combinations of factors that drive successful CP outcomes under SSCC. fsQCA identifies “causal recipes” or combinations of conditions—such as technological readiness, R&D investment, and flexibility in resource management—that lead to desirable CP outcomes, addressing complex causal dependencies within supply chain settings (Ragin, 2008; Schneider and Wagemann, 2010). Through the calibration process, variables are transformed into fuzzy sets representing membership levels across conditions, enabling the identification of both sufficient and necessary conditions. This approach is particularly useful in supply chain studies where non-linear interactions frequently occur (Huarng et al., 2018; Richter et al., 2022).
The rationale for combining NCA and fsQCA with DID lies in their ability to capture complex, non-linear, and configurational relationships that traditional regression models cannot fully uncover. While DID identifies the average treatment effect of SSCC, NCA helps identify non-compensatory bottlenecks—that is, conditions that must be met for performance improvements to occur, such as minimum levels of digital readiness or R&D intensity. fsQCA further complements the analysis by revealing multiple causal pathways or “causal recipes” that lead to high or low CP (Fiss, 2011). These methods provide richer insights into the contextual and combinatorial dynamics of SSCC, offering valuable managerial implications. For instance, while some firms may benefit from SSCC only when R&D and organizational scale are high, others may achieve similar performance through alternate pathways involving employment capacity and external economic conditions.
4. Results and discussion
This section presents the results from the study’s three methodologies—Difference-in-Differences (DID), Necessity Condition Analysis (NCA), and fuzzy-set Qualitative Comparative Analysis (fsQCA)—which together provide a comprehensive analysis of the impact of Smart Supply Chain Construction (SSCC) on Corporate Performance (CP). The discussion is structured to explain each methodology’s findings thoroughly, highlighting key insights and interpretations.
4.1 DID analysis
The Difference-in-Differences (DID) approach evaluates the causal impact of SSCC on CP by comparing changes between the treatment group, exposed to SSCC, and the control group, which is not. Table 3 provides the regression results from the DID analysis.
Difference-in-differences regression results
| Variable | Coefficient | Standard error | t-Statistic | p-value |
|---|---|---|---|---|
| Treatment | 0.753 | 0.294 | Feb.56 | 0.043** |
| Time | −0.062 | 0.045 | −1.37 | 0.171 |
| Treatment × Time | 1.551 | 0.443 | Mär.50 | 0.013** |
| Constant | 0.465 | 0.202 | Feb.30 | 0.061 |
Note(s): **Significant at 5% level
The findings in Table 3 indicate a significant increase in corporate performance (CP) for firms in the treatment group following SSCC policy implementation. Specifically, the treatment group shows a positive coefficient of 0.753 (p = 0.043), suggesting that SSCC adoption has a meaningful impact on CP. This improvement can be attributed to several factors, including automation and digitization, which lead to superior operational efficiency and cost reductions. These results are consistent with previous literature that highlights the positive influence of supply chain digitalization on corporate outcomes (Li et al., 2025; Soria, 2024; Hamed et al., 2024; Zhou et al., 2021; Kang et al., 2020). The result is also aligned with Resource-Based View (RBV) (Barney, 1991; Lockett et al., 2009), and Dynamic Capabilities Theory (Teece et al., 1997; Teece, 2018; Loureiro et al., 2021).
Furthermore, the interaction term (Treatment × Time) has a coefficient of 1.551 (p = 0.013), suggesting that the positive impact of SSCC on CP strengthens over time. This indicates that longer exposure to the SSCC policy results in increasingly significant improvements in corporate performance. The sustained engagement allows companies to adapt their operations more effectively, respond to market changes swiftly, and capitalize on new opportunities, thus enhancing overall performance. The finding is consistent with Zhou et al. (2025), Li et al. (2024a, b), and Chen et al. (2020).
The validity of the DID model depends on the parallel trends assumption, which requires that the treatment and control groups follow similar trends before the policy intervention. Figure 2 illustrates a graphical diagnostic for this assumption, showing parallel trends between the groups before SSCC implementation.
 The figure is titled “Graphical Diagnostics for Parallel Trends,” and shows two horizontally arranged line graphs. The details of the graphs are as follows: The left graph is labeled “Observed Means.” The vertical axis is labeled “C P” and ranges from 1.40 to 1.65 in increments of 0.05. The horizontal axis is labeled “Year” and displays years from 2015 to 2023, in yearly increments. Two lines are shown, one blue for “Control” and one red for “Treatment.” A vertical dashed line is placed at 2017. The details of the line are as follows: The line for “Control” starts at (2015, 1.46), moves with fluctuations, showing peaks at (2017, 1.49), (2020, 1.48), dips to (2021, 1.43), and climbs to end at (2023, 1.54). The line for “Treatment” starts at (2015, 1.44), moves with fluctuations, showing peaks at (2017, 1.53), (2019, 1.51), dips to (2020, 1.47), and climbs to (2022, 1.55), and slightly decreases to end at (2023, 1.54). The right graph is labeled “Linear-Trends Model.” The vertical axis is labeled “C P” and ranges from 1.40 to 1.65 in increments of 0.05. The horizontal axis is labeled “Year” and displays years from 2015 to 2023. There are two trend lines: a blue dashed line for “Control” and a red dashed line for “Treatment.” A vertical dashed line is placed at 2017. The details of the line are as follows: The line for “Control” starts at (2015, 1.48), remains almost constant, and is parallel to the horizontal axis, and ends at (2023, 1.49). The line for “Treatment” starts at (2015, 1.45), increases with a positive slope passing through (2019, 1.49), and ends at (2023, 1.54). The two lines intersect at (2018, 1.48). Note: All the numerical values are approximated.
Graphical diagnostics for parallel trends. Source(s): Authors’ own work
The figure is titled “Graphical Diagnostics for Parallel Trends,” and shows two horizontally arranged line graphs. The details of the graphs are as follows: The left graph is labeled “Observed Means.” The vertical axis is labeled “C P” and ranges from 1.40 to 1.65 in increments of 0.05. The horizontal axis is labeled “Year” and displays years from 2015 to 2023, in yearly increments. Two lines are shown, one blue for “Control” and one red for “Treatment.” A vertical dashed line is placed at 2017. The details of the line are as follows: The line for “Control” starts at (2015, 1.46), moves with fluctuations, showing peaks at (2017, 1.49), (2020, 1.48), dips to (2021, 1.43), and climbs to end at (2023, 1.54). The line for “Treatment” starts at (2015, 1.44), moves with fluctuations, showing peaks at (2017, 1.53), (2019, 1.51), dips to (2020, 1.47), and climbs to (2022, 1.55), and slightly decreases to end at (2023, 1.54). The right graph is labeled “Linear-Trends Model.” The vertical axis is labeled “C P” and ranges from 1.40 to 1.65 in increments of 0.05. The horizontal axis is labeled “Year” and displays years from 2015 to 2023. There are two trend lines: a blue dashed line for “Control” and a red dashed line for “Treatment.” A vertical dashed line is placed at 2017. The details of the line are as follows: The line for “Control” starts at (2015, 1.48), remains almost constant, and is parallel to the horizontal axis, and ends at (2023, 1.49). The line for “Treatment” starts at (2015, 1.45), increases with a positive slope passing through (2019, 1.49), and ends at (2023, 1.54). The two lines intersect at (2018, 1.48). Note: All the numerical values are approximated.Graphical diagnostics for parallel trends. Source(s): Authors’ own work
To further validate the parallel trends assumption, a statistical test was conducted. As shown in ( Appendix 2 Table A2), the p-value of 0.2594 indicates no significant difference in pre-treatment trends between the groups, aligning with existing research. Thus, the DID model is robust, and the estimated impact of SSCC on CP is reliable.
For Robustness check, Placebo test has been used for checking if the policy had an influence before it was implemented. In this regard, the placebo variables, Pseudo-Time Indicator (Time ≥ 2015) and Placebo DiD (Treatment * Pseudo-Time Indicator), have been used.
The Placebo test results ( Appendix 1 Table A1), concluded that both the variables Pseudo-Time Indicator (p = 0.234) and Placebo DiD (p = 0.491) are not statistically significant, highlighting that there are no significant differences in trends between the treatment group and control group before the intervention. This indicates that the assumption of parallel trends holds. This supports the soundness of the Difference-in-Differences (DD) analysis, suggesting that any observed impacts after 2018 could be attributed to the policy itself.
Appendix 3 Table A3 presents the Granger causality test results, which strengthen the robustness of the DID analysis by assessing whether SSCC adoption influences corporate performance through anticipatory trends, pre-existing conditions, or feedback effects. Specifically, failing to reject the null hypotheses for anticipatory effects, pre-existing trends, and feedback from corporate performance to SSCC reinforces the reliability of our causal interpretation. These results suggest that SSCC adoption is independently associated with corporate performance improvements, aligning with best practices for causal analysis by ensuring that DID estimations are unaffected by external biases or reverse causality.
This robust verification approach strengthens confidence in the conclusion that SSCC plays a meaningful role in enhancing corporate performance, consistent with established guidance for rigorous causal inference (Athey and Imbens, 2002). In summary, the DID results confirm a significant and increasingly positive impact of SSCC over time, reinforcing the theoretical propositions of both the RBV and DCT. However, the heterogeneous effects across firms suggest that benefits are not uniformly distributed. This finding supports the view that SSCC effectiveness depends on absorptive capacity and strategic alignment. While the robustness checks validate the credibility of the causal relationship, the results also highlight that implementation costs, integration complexity, and sectoral readiness may constrain the realization of SSCC benefits in some firms. These contextual factors emphasize the need for a more differentiated approach to digital supply chain adoption.
4.2 NCA analysis
The Necessity Condition Analysis (NCA) conducted in this study complements the fsQCA by examining necessary conditions for corporate performance (CP) and identifying essential variables that place constraints on achieving desired CP levels. This dual approach provides deeper insights into how each variable uniquely contributes to CP outcomes, beyond merely observing correlations or associations (Dul, 2016a). NCA’s unique capability of analyzing both calibrated and raw data offers additional rigor to our findings (Dul, 2016b).
Appendix 4 Table A4 provides the fuzzy set calibration parameters for each construct, setting boundaries that define each variable’s fuzzy membership values. This calibration ensures that each variable is evaluated consistently, allowing for meaningful interpretations within the NCA framework. By setting these calibration points, we can interpret changes in corporate performance more precisely, as shifts within these thresholds indicate substantive variations in CP.
The results highlight that different variables, such as Employment, GDP, R&D Expenditure, and Smart Supply Chain Construction (SSCC), contribute to corporate performance (CP) in varying ways. Rather than any single factor driving CP on its own, the findings suggest that specific combinations of these elements have a stronger impact. For example, some configurations of these variables show higher consistency and coverage, which means that these combinations are more effective in boosting CP. Table 4 compares these configurations, showing how each variable interacts with others in high and low CP outcomes. This underscores the idea that enhancing CP is best achieved through a balanced mix of factors, rather than relying on isolated elements.
NCA results by fsQCA analysis
| Configurational constructs | High CP | ∼ Low CP | ||
|---|---|---|---|---|
| Consistency | Coverage | Consistency | Coverage | |
| Employment | 0.667 | 0.628 | 0.663 | 0.646 |
| ∼ Employment | 0.625 | 0.641 | 0.619 | 0.658 |
| GDP | 0.673 | 0.652 | 0.599 | 0.601 |
| ∼ GDP | 0.588 | 0.586 | 0.653 | 0.674 |
| R&D Expenditure | 0.650 | 0.644 | 0.657 | 0.674 |
| ∼ R&D Expenditure | 0.671 | 0.654 | 0.653 | 0.659 |
| SSCC | 0.603 | 0.474 | 0.645 | 0.525 |
| ∼ SSCC | 0.396 | 0.519 | 0.354 | 0.481 |
| Total Assets | 0.691 | 0.656 | 0.633 | 0.622 |
| ∼ Total Assets | 0.601 | 0.613 | 0.649 | 0.685 |
| Total Liabilities | 0.653 | 0.632 | 0.627 | 0.629 |
| ∼ Total Liabilities | 0.617 | 0.615 | 0.634 | 0.654 |
The importance of these configurations is further underscored by the medium effect sizes observed in Table 5. According to Dul (2016a, b), an effect size greater than 0.1 denotes a medium effect, while scores below 0.1 are considered small. SSCC and Total Liabilities show medium effect sizes (above 0.1), reinforcing their essential roles as necessary conditions for higher CP. This finding underscores the critical nature of SSCC and Total Liabilities in improving CP outcomes, suggesting that these factors impose meaningful constraints that organizations must address to achieve enhanced performance. Constructs such as GDP and R&D Expenditure, while showing smaller effect sizes, still contribute to CP and indicate a foundational impact on corporate outcomes.
NCA effect sizes
| Causal condition | Method | Accuracy | Effect size |
|---|---|---|---|
| Employment | CE-FDH | 100% | 0.15 |
| CR-FDH | 100% | 0.146 | |
| GDP | CE-FDH | 100% | 0.025 |
| CR-FDH | 100% | 0.017 | |
| R&D Expenditure | CE-FDH | 100% | 0.059 |
| CR-FDH | 100% | 0.039 | |
| SSCC | CE-FDH | 100% | 0.269 |
| CR-FDH | 100% | 0.134 | |
| Total Assets | CE-FDH | 100% | 0.113 |
| CR-FDH | 100% | 0.077 | |
| Total Liabilities | CE-FDH | 100% | 0.209 |
| CR-FDH | 100% | 0.146 |
The NCA Ceiling Line Charts (Figure 3) provide a clear and insightful depiction of the essential constraints that each construct places on CP. For instance, the charts for Employment Rate and GDP show a significant clustering of observations below the ceiling line, particularly within shaded regions. These shaded areas signify CP levels that cannot be achieved without reaching minimum thresholds for these constructs, visually confirming the necessity of conditions like Employment Rate and GDP. This illustration highlights that lacking these critical conditions can substantially hinder CP, establishing them as fundamental prerequisites for attaining optimal performance.
 The figure shows six scatter plots arranged in a 2 by 3 grid. Each plot contains a gray background for “C R-F D H,” a yellow background section for “C E-F D H,” and dots labeled “Observations” as indicated by the common legend at the top. All plots have the vertical axis labeled “E P.” Each graph contains various small dots for “Observations” distributed throughout the plots. The dots are spread across both the gray and yellow regions in all six charts. The description for all the graphs is as follows: The graph on the top left is labeled “N C A Ceiling Line Chart: Employment Rate.” The vertical axis ranges from 0.5 to 2.5 in increments of 0.25. The horizontal axis is labeled “EmploymentRate,” and ranges from 86 to 100 in increments of 2. The gray area covers most of the plot, ranging from an employment rate of 85 to 93, and the yellow area forms a vertical band from 93 to 100 on the right. The graph on the top right is labeled “N C A Ceiling Line Chart: G D P.” The vertical axis ranges from 0.5 to 2.5 in increments of 0.25. The horizontal axis is labeled “GDP,” and ranges from 2000000 to 10,000,000. The gray area spans from 0 to approximately 9,400,000, while the yellow area is a strip from about 9,400,000 to 10,000,000 on the right. The graph on the middle left is labeled “N C A Ceiling Line Chart: R and D Expenditure.” The vertical axis ranges from 0.5 to 2.5 in increments of 0.25. The horizontal axis is labeled “R and D Expenditure,” and ranges from 100000 to 500,000. The gray region extends from 0 to around 475,000, and the yellow region covers about 475,000 to 500,000 on the right. The graph on the middle right is labeled “N C A Ceiling Line Chart: S S C C ” The vertical axis ranges from 0.5 to 2.5 in increments of 0.25. The horizontal axis is labeled “SSCC,” and ranges from 0 to 1 in increments of 0.2. The gray area spans from 0 to about 0.95, and the yellow area forms a vertical band from 0.95 to 1 on the right. The graph on the bottom left is labeled “N C A Ceiling Line Chart: Total Assets.” The vertical axis ranges from 0.5 to 2.5 in increments of 0.25. The horizontal axis is labeled “TotalAssets,” and ranges from 2000000 to 10,000,000. The gray area spans from 0 to around 9,400,000, and the yellow area is a strip from about 9,400,000 to 10,000,000 on the right. The graph on the bottom right is labeled “N C A Ceiling Line Chart: Total Liabilities.” The vertical axis ranges from 0.5 to 2.5 in increments of 0.25. The horizontal axis is labeled “TotalLiabilities,” and ranges from 0 to 5,000,000. The gray area spans from 0 to about 4,700,000, and the yellow area forms a vertical band from 4,700,000 to 5,000,000 on the right. Note: All the numerical values are approximated.
NCA Ceiling Line Charts. Source(s): Authors’ own work
The figure shows six scatter plots arranged in a 2 by 3 grid. Each plot contains a gray background for “C R-F D H,” a yellow background section for “C E-F D H,” and dots labeled “Observations” as indicated by the common legend at the top. All plots have the vertical axis labeled “E P.” Each graph contains various small dots for “Observations” distributed throughout the plots. The dots are spread across both the gray and yellow regions in all six charts. The description for all the graphs is as follows: The graph on the top left is labeled “N C A Ceiling Line Chart: Employment Rate.” The vertical axis ranges from 0.5 to 2.5 in increments of 0.25. The horizontal axis is labeled “EmploymentRate,” and ranges from 86 to 100 in increments of 2. The gray area covers most of the plot, ranging from an employment rate of 85 to 93, and the yellow area forms a vertical band from 93 to 100 on the right. The graph on the top right is labeled “N C A Ceiling Line Chart: G D P.” The vertical axis ranges from 0.5 to 2.5 in increments of 0.25. The horizontal axis is labeled “GDP,” and ranges from 2000000 to 10,000,000. The gray area spans from 0 to approximately 9,400,000, while the yellow area is a strip from about 9,400,000 to 10,000,000 on the right. The graph on the middle left is labeled “N C A Ceiling Line Chart: R and D Expenditure.” The vertical axis ranges from 0.5 to 2.5 in increments of 0.25. The horizontal axis is labeled “R and D Expenditure,” and ranges from 100000 to 500,000. The gray region extends from 0 to around 475,000, and the yellow region covers about 475,000 to 500,000 on the right. The graph on the middle right is labeled “N C A Ceiling Line Chart: S S C C ” The vertical axis ranges from 0.5 to 2.5 in increments of 0.25. The horizontal axis is labeled “SSCC,” and ranges from 0 to 1 in increments of 0.2. The gray area spans from 0 to about 0.95, and the yellow area forms a vertical band from 0.95 to 1 on the right. The graph on the bottom left is labeled “N C A Ceiling Line Chart: Total Assets.” The vertical axis ranges from 0.5 to 2.5 in increments of 0.25. The horizontal axis is labeled “TotalAssets,” and ranges from 2000000 to 10,000,000. The gray area spans from 0 to around 9,400,000, and the yellow area is a strip from about 9,400,000 to 10,000,000 on the right. The graph on the bottom right is labeled “N C A Ceiling Line Chart: Total Liabilities.” The vertical axis ranges from 0.5 to 2.5 in increments of 0.25. The horizontal axis is labeled “TotalLiabilities,” and ranges from 0 to 5,000,000. The gray area spans from 0 to about 4,700,000, and the yellow area forms a vertical band from 4,700,000 to 5,000,000 on the right. Note: All the numerical values are approximated.NCA Ceiling Line Charts. Source(s): Authors’ own work
The analysis reveals the minimum levels required for each construct to achieve specific CP targets, as detailed in Table 6. For lower CP levels (up to 30%), stringent conditions are generally unnecessary, implying that basic organizational resources can sustain these performance levels. However, as the CP target escalates to 80% or more, substantial requirements for each variable emerge, underscoring the need for a comprehensive strategy and resource allocation to achieve high performance. Achieving a CP level of 80% or higher necessitates at least 57.5% Employment, 9.375% GDP, 13.125% Profit, 22.5% R&D Expenditure, 37.5% SSCC, 42.5% Total Assets, and 77.81% Total Liabilities, highlighting the significance of strategic investments across multiple resources.
Bottleneck analysis
| CP | Employment | GDP | Profit | R&D expenditure | SSCC | Total assets | Total liabilities |
|---|---|---|---|---|---|---|---|
| 0.00% | NN | NN | NN | NN | NN | NN | NN |
| 10.00% | NN | NN | NN | NN | NN | NN | NN |
| 20.00% | NN | NN | NN | NN | NN | NN | NN |
| 30.00% | 0.312 | NN | NN | NN | NN | NN | NN |
| 40.00% | 0.625 | NN | NN | NN | NN | NN | NN |
| 50.00% | 0.938 | NN | NN | NN | NN | NN | NN |
| 60.00% | 4.375 | 0.938 | NN | NN | NN | NN | NN |
| 70.00% | 23.75 | 4.688 | 13.125 | NN | NN | 20.625 | NN |
| 80.00% | 57.5 | 9.375 | 13.125 | 22.5 | 37.5 | 42.5 | 77.812 |
| 90.00% | 57.5 | 9.375 | 13.125 | 22.5 | 37.5 | 42.5 | 77.812 |
| 100.00% | 57.5 | 9.375 | 13.125 | 22.5 | 37.5 | 42.5 | 77.812 |
This bottleneck analysis highlights SSCC and Total Liabilities as crucial bottlenecks, confirming their medium effect sizes as essential conditions. These constructs act as significant thresholds that firms must meet to achieve high levels of CP, suggesting that SSCC investment and efficient management of Total Liabilities are priority areas for organizations seeking to maximize performance. The bottleneck findings imply that SSCC, representing digital and operational innovations, and Total Liabilities, indicating financial health, are essential leverage points for improving CP in today’s corporate landscape.
The scatter plot ( Appendix 5) provides insights into the inefficiency levels of each variable, emphasizing the constraints certain constructs impose on corporate performance. Constructs like SSCC and Total Liabilities exhibit higher condition inefficiencies, indicating they place significant limitations on achieving optimal CP. These results underline the critical role of these variables in shaping performance outcomes. In contrast, constructs such as Employment Rate, while relevant, exhibit lower inefficiency levels, suggesting they are less restrictive in driving CP. This analysis highlights the varied impact of each construct on overall performance, pointing to SSCC and Total Liabilities as particularly influential in achieving higher CP.
The NCA results underscore that SSCC and Total Liabilities serve as pivotal constraints for achieving high levels of CP. Their medium effect sizes and consistent identification as bottlenecks indicate that organizations must not only adopt smart supply chain technologies but also maintain disciplined financial structures to unlock performance gains. While other variables such as GDP and R&D Expenditure exhibit smaller effect sizes, they still contribute meaningfully to CP outcomes, reflecting the multifactorial nature of performance. These findings refine the RBV by emphasizing that resource sufficiency rather than just scarcity or inimitability is a prerequisite for capability realization. Importantly, some firms, despite being policy-exposed, fall short due to underinvestment in foundational capabilities, suggesting that digital transformation alone is not a panacea. These bottlenecks reveal structural limits to SSCC doptionn and imply that managers must prioritize capacity-building in core areas before expecting tangible returns from smart supply chain investments.
4.3 fsQCA analysis
With fsQCA, researchers determine whether the presence or absence of causal conditions and combinations are aligned with the presence or absence of a particular outcome (Fainshmidt et al., 2020). This approach involves a structured process to identify all combinations of causal conditions that may contribute to the desired outcome. A key requirement of fsQCA is the calibration of original data into fuzzy membership scores, achieved by setting three anchor points (Ragin, 2008): one for full non-membership, one for the crossover point, and one for full membership. This calibration allows fsQCA to accommodate causal conditions that vary in kind—whether a condition exists or not—and in degree, by converting values into fuzzy-set membership scores.
For this study, we calibrated the data into three membership categories based on percentiles, aligning with established fsQCA methodologies (Khedhaouria and Thurik, 2017; Misangyi and Acharya, 2014). Specifically, we set the 95th percentile as fully indicating strong agreement), the 50th percentile as the crossover (indicating moderate agreement), and the 5th percentile as fully out (indicating low agreement). For example, Employment was calibrated with membership scores of 85.488 (fully out), 92.631 (crossover), and 99.296 (fully in). Similarly, GDP was calibrated with scores of 1,350,613 for fully out, 5,228,940 for crossover, and 9,589,898 for fully in. For Profit, we used 219,360.55, 578,829, and 923,592.3 as the values for fully out, crossover, and fully in, respectively. The calibration for Smart Supply Chain Construction (SSCC) was set at values of 1, 3, and 5, and Total Assets and Total Liabilities followed similar procedures with respective calibrations at 937,762, 4,694,056, and 9,475,890 for Total Assets, and 111,955, 2,944,065, and 4,527,313 for Total Liabilities. Detailed calibration scores and other descriptive statistics are provided in Table 1. Calibration involved transforming raw interval-scale data into fuzzy-set membership scores ranging from 0 (full non-membership) to 1 (full membership). Following Ragin’s (2008) direct calibration method, we defined three qualitative anchors: full membership at 0.95, full non-membership at 0.05, and the crossover point at 0.50. These thresholds were derived by combining conceptual benchmarks from prior literature with empirical distributional characteristics of our dataset. For instance, variables such as R&D intensity, digital readiness, and supply chain resilience were calibrated based on industry norms and scholarly references to ensure construct validity. This approach ensures theoretical alignment, enhances methodological transparency, and supports the internal consistency and replicability of the configurational analysis.
After calibration, it is essential to perform necessity analysis before proceeding with sufficiency analysis, as recommended by Schneider and Wagemann (2012). The first step in fsQCA examines causal conditions and their configurations in relation to the outcome using the metrics of consistency and coverage, which indicate the extent to which a condition or configuration is linked to the outcome (Schneider and Wagemann, 2010). A condition is deemed necessary if its presence (or absence) is required for the outcome to occur (Rihoux and Ragin, 2009). Necessity analysis evaluates the consistency of each condition, with a threshold range of 0.8–0.9, to determine if a condition is essential for achieving high or low levels of the outcome (Kaya et al., 2020).
Furthermore, fsQCA also offers a rich, configurational perspective on the conditions driving Corporate Performance (CP). Rather than isolating each variable’s influence, fsQCA examines how constructs—such as Employment, GDP, Profit, R&D Expenditure, and Smart Supply Chain Construction (SSCC)—interact within specific combinations to influence CP outcomes. This approach aligns with configurational theory, which suggests that optimal performance outcomes are often the result of specific alignments among key variables, rather than the effect of any single variable in isolation (Fiss, 2011).
The configurations associated with both high and low corporate performance (CP), as presented in Tables 7 and 8, reveal that specific combinations of conditions critically shape performance outcomes. In the high-performing configurations, SSCC, Employment, and Total Assets consistently emerge as core conditions, underscoring their strategic role in driving superior results. SSCC appears as a recurring element across multiple solutions, supporting the view that smart supply chain practices enhance resilience, operational efficiency, and responsiveness to market dynamics. For example, configurations that combine SSCC with elevated levels of Employment and Total Assets demonstrate high consistency and coverage, suggesting that these elements jointly foster synergistic advantages. This pattern aligns with existing research, which emphasizes that performance gains are most likely when digital supply chain capabilities are supported by sufficient organizational scale and resource availability (Teece, 2007). Conversely, configurations lacking these conditions, especially those omitting SSCC, are consistently associated with lower CP, highlighting the importance of capability alignment for competitive outcomes.
Sufficient configurations for predicting high level of CP
| Configurations | Solutions for high level of CP | |||||
|---|---|---|---|---|---|---|
| Models = f (EMT, GDP, PFT, RDE, SSCC, TA, TE) | Solution | |||||
| 1 | 2 | 3 | 4 | 5 | 6 | |
| Employment | ⊗ | • | • | |||
| GDP | ⊗ | ⊗ | • | • | ||
| Profit | • | ⊗ | ||||
| R&D Expenditure | ⊗ | • | • | ⊗ | ⊗ | |
| Smart Supply Chain Construction | ⊗ | • | ⊗ | |||
| Total Assets | • | • | • | |||
| Total Liabilities | • | ⊗ | ||||
| Raw Coverage | 0.425 | 0.329 | 0.320 | 0.405 | 0.513 | 0.400 |
| Unique Coverage | 0.007 | 0.004 | 0.013 | 0.078 | 0.016 | 0.001 |
| Consistency | 0.800 | 0.821 | 0.800 | 0.818 | 0.762 | 0.791 |
| Overall Solution Coverage | 0.615 | |||||
| Overall Solution Consistency | 0.945 | |||||
Note(s): The black circle (●) indicates the presence of a condition, and the Negation circle (⊗) indicates its absence. Large circles indicate 0.800e core conditions; small ones, Blank spaces indicate “don’t care”
Sufficient configurations for predicting low levels of CP
| Configurations | Solutions for low level of CP | |||
|---|---|---|---|---|
| Models = f (EMT, GDP, PFT, RDE, SSCC, TA, TE) | Solution | |||
| 1 | 2 | 3 | 4 | |
| Employment | ⊗ | ⊗ | ⊗ | |
| GDP | ⊗ | • | • | • |
| Profit | ⊗ | ⊗ | ⊗ | |
| R&D Expenditure | • | • | ⊗ | ⊗ |
| Smart Supply Chain Construction | • | • | ||
| Total Assets | ⊗ | ⊗ | • | • |
| Total Liabilities | • | ⊗ | ||
| Raw Coverage | 0.660 | 0.711 | 0.668 | 0.664 |
| Unique Coverage | 0.026 | 0.012 | 0.010 | 0.014 |
| Consistency | 0.886 | 0.826 | 0.951 | 0.927 |
| Overall Solution Coverage | 0.722 | |||
| Overall Solution Consistency | 0.945 | |||
Note(s): Black circle (●) indicate the presence of a condition, and Negation circle (⊗) indicate its absence. Large circles indicate core conditions. Blank spaces indicate “don’t care”
Moreover, the presence of R&D Expenditure and Profit in some high CP configurations highlights the role of innovation and profitability in sustaining high performance levels. These findings underscore the importance of resource investment not only in tangible assets but also in areas that foster innovation, further supporting the strategic resource-based view (Barney, 1991). In contrast, SSCC and Total Assets are either absent or minimal in these configurations, suggesting that insufficient investment in supply chain infrastructure and resources contributes to suboptimal CP. Additionally, conditions such as Employment and GDP show low values, indicating that without adequate workforce and economic conditions, firms may struggle to achieve higher performance.
These low CP configurations reveal the risks of inadequate resource allocation in critical areas. The absence of SSCC highlights its role as a potential driver of performance; firms that neglect supply chain advancements may face operational inefficiencies and reduced competitiveness. This finding is consistent with the literature on supply chain resilience, which stresses the necessity of robust supply chain practices for sustained performance (Pettit et al., 2013). By comparing high and low CP configurations, it becomes evident that achieving superior CP requires a strategic combination of resources. The findings emphasize that SSCC, supported by appropriate levels of Employment, Total Assets, and R&D Expenditure, can create a competitive advantage that is difficult for competitors to replicate. Our fsQCA results underscore that high corporate performance stems from configurations where firms effectively integrate both proactive resilience (such as early disruption sensing) and reactive resilience (such as swift response and recovery). These findings suggest that robust performance depends not only on the presence of capabilities but also on how they are strategically aligned and deployed together. In contrast, low-performing configurations reveal that partial or imbalanced capability development, for example focusing solely on reactive responses without anticipatory strategies, can weaken resilience outcomes. Therefore, firms should adopt a balanced and deliberate approach to capability development, ensuring that resilience strategies are forward-looking and adaptable to evolving supply chain dynamics.
The fsQCA analysis confirms that high levels of CP are not achieved through any single factor in isolation, but rather through well-aligned combinations of key conditions. Configurations that include SSCC, Employment, and Total Assets consistently appear in high-performing cases, reinforcing the core tenets of the RBV and DCT, which emphasize that competitive advantage is derived from the strategic alignment and orchestration of internal resources (Barney, 1991; Teece et al., 1997). However, the analysis also reveals that the presence of SSCC alone is not sufficient. Its effectiveness depends on contextual enablers such as workforce capacity, innovation investment, and financial strength. Some configurations display low performance despite SSCC implementation, especially in firms lacking adequate infrastructure or operational scale. These findings challenge any overly optimistic or one-sided view of SSCC’s value and instead reinforce the dynamic capabilities perspective, which stresses the importance of environmental and organizational fit. The unexpected finding that some treated firms did not experience notable improvements in corporate performance despite adopting Smart Supply Chain Construction can be theoretically grounded in the Dynamic Capabilities Theory. Specifically, this outcome may reflect the presence of capability traps or strategic misalignment. Capability traps arise when organizations become entrenched in outdated routines, technologies, or decision-making frameworks, preventing effective deployment of new dynamic capabilities (Wang et al., 2015; Liao and Xie, 2024). In such cases, SSCC adoption may remain superficial or constrained by organizational rigidity. Furthermore, performance gains may be limited when there is a misalignment between digital strategies and either the firm’s internal capabilities or the external market environment. For practitioners, this suggests that SSCC strategies must be tailored to firm-specific strengths, constraints, and readiness levels, rather than applied as universally beneficial digital solutions.
5. Conclusion, policy implications, and limitations
This study investigated the impact of the Digital Transport and Logistics Forum (DTLF) policy on SSCC and its influence on CP among European companies from 2015 to 2023. The results indicate that SSCC, driven by DTLF policy initiatives, substantially improves corporate performance by fostering resilience, adaptability, and efficiency within supply chains. Utilizing a comprehensive methodology including DiD, NCA and fsQCA—this research highlights the role of smart supply chains in navigating market volatility, minimizing disruptions, and enhancing resource utilization.
The findings suggest that SSCC contributes positively to corporate performance by enabling companies to integrate advanced digital capabilities, which promote proactive and reactive resilience. These smart capabilities include real-time data analysis, improved visibility across supply chain stages, and faster response mechanisms to manage disruptions, thereby reducing costs and improving operational continuity. This study also identifies specific conditions, such as R&D investments, total assets, and favorable economic factors like employment and GDP stability, as amplifiers of SSCC’s impact on corporate outcomes. By facilitating data-driven decision-making, fostering innovation, and enhancing risk management, SSCC initiatives make it possible for firms to better anticipate and respond to challenges while capitalizing on new market opportunities. Overall, these findings reinforce the transformative potential of SSCC within the broader European market, underscoring the critical role of policy-driven digital transformation in achieving robust and competitive supply chains. To further translate these performance gains into sustainable and scalable outcomes, it becomes crucial to consider how policy environments can be optimized to support diverse firm capabilities and digital maturity levels. As firms navigate heightened global uncertainties, technological disruptions, and institutional variation across Europe, a more adaptive and targeted policy strategy is essential. The next section outlines the key policy implications derived from this study, emphasizing the importance of responsive governance, inclusive infrastructure investment, and capability-building programs for driving long-term SSCC effectiveness and competitiveness.
5.1 Policy implications
The findings of this study generate meaningful implications for both policymakers and researchers seeking to advance resilient, high-performing, and digitally enabled supply chains across Europe. Aligned with the strategic objectives of the Digital Transport and Logistics Forum (DTLF), our results underscore that Smart Supply Chain Construction (SSCC) delivers performance improvements only when specific enabling conditions—such as digital readiness, R&D intensity, and organizational scale—are in place. This suggests that a uniform or overly generalized policy approach may be insufficient to promote widespread success, and that more nuanced, context-aware strategies are required.
From a policy perspective, the European Union should adopt a more flexible and differentiated approach to SSCC implementation by introducing adaptive policy mechanisms tailored to varying levels of firm capabilities, sectoral demands, and regional disparities. This includes accelerating investments in interoperable digital infrastructure that supports seamless data exchange across industries, especially in regions where digital maturity remains limited. A harmonized and inclusive digital ecosystem would facilitate the integration of transformative technologies such as artificial intelligence, the Internet of Things, and blockchain into day-to-day supply chain operations, enabling greater efficiency and responsiveness to disruptions. In addition, targeted financial incentives for innovation and smart technology adoption can help overcome capital constraints, particularly among small and medium-sized enterprises. Public funding instruments and co-investment programs focused on predictive analytics, automation, and logistics digitalization will be instrumental in broadening access to SSCC benefits. Moreover, addressing labor market readiness is vital (Foroughi, 2020; Dey, 2022). Policymakers should support vocational training and re-skilling programs to build competencies in areas like data-driven decision-making, supply chain optimization, and cybersecurity.
This study also highlights persistent economic, institutional, and technological barriers to SSCC adoption. Many firms, especially in traditional industries, face difficulties integrating smart solutions due to legacy systems, fragmented supply chain data, or lack of absorptive capacity. In such cases, a phased adoption model supported by technical assistance, regulatory sandboxes, and knowledge-sharing consortia could offer a viable path forward. Additionally, future SSCC policy should embed environmental sustainability goals by promoting low-carbon logistics solutions, circular supply chain models, and real-time emissions tracking. These strategies would support Europe’s climate commitments while enhancing operational agility and cost competitiveness.
From a research standpoint, this study contributes to and expands the theoretical understanding of the Resource-Based View (RBV) and Dynamic Capabilities Theory (DCT). We conceptualize SSCC not as a single operational enhancement but as a meta-capability that enables dynamic resource reconfiguration and strategic responsiveness under uncertainty. The integration of econometric (DID), necessity-based (NCA), and configurational (fsQCA) methods allowed us to uncover not only the average treatment effect of SSCC but also the threshold conditions and combinatorial pathways that shape its impact on corporate performance. This multi-method approach advances methodological rigor in the study of supply chain transformation and sets the foundation for future studies that explore performance asymmetries across sectors and regions. Further research should build on this work by exploring longitudinal changes in capability development, comparative analyses across regulatory environments, and the moderating roles of leadership structure, digital governance, and institutional pressures. Additional attention could also be directed at understanding how firms prioritize digital investments under constrained budgets, or how network effects in supply chain ecosystems influence SSCC outcomes.
SSCC is not a one-size-fits-all solution (Jum’a et al., 2025). It works best when supported by the right internal capabilities and external conditions. Our findings show that the impact of SSCC depends on factors such as digital readiness, access to resources, and organizational flexibility. This means policymakers must design flexible and inclusive support systems that help firms of all sizes and sectors prepare for and benefit from SSCC. For researchers, the results point to exciting opportunities to study how different firms manage digital transformation under real-world constraints. Moving forward, a more collaborative and adaptive approach involving governments, industry, and academia will be key to building smarter, greener, and more resilient supply chains that can thrive in uncertain times.
5.2 Limitations and future directions
While this study offers valuable insights into the performance implications of Smart Supply Chain Construction (SSCC), several limitations should be acknowledged to guide future research. First, the analysis focuses on publicly listed companies within Europe, which may limit the generalizability of findings to small and medium-sized enterprises, privately held firms, or organizations in non-European contexts. Future research should expand the sample across diverse geographic, institutional, and industry settings to assess how regional variations influence SSCC outcomes. Additionally, exploring long-term dynamics such as capability development, policy adaptation, and digital maturity over time would provide deeper insights into the sustained impacts of SSCC adoption. While the integrated use of DiD, NCA, and fsQCA provides a robust methodological foundation, future studies may incorporate Structural Equation Modeling (SEM) or dynamic panel models to capture mediating pathways and feedback loops more effectively. As smart technologies continue to evolve, future research should also examine how emerging tools such as blockchain, AI-based coordination, and digital twins can be integrated into SSCC frameworks to enhance resilience, visibility, and sustainability in increasingly volatile supply chain environments.
This work has been funded by the program ‘Guideline to stimulate the development/expansion of future-oriented research fields at Upper Austrian non-university research institutions 2022–2029’ by the Province of Upper Austria.
Appendix 1
Robustness check (Placebo Test)
| Variable | Coefficient | Robust standard error | t-statistic | p-value |
|---|---|---|---|---|
| Treatment | 0.024 | 0.034 | 0.70 | 0.484 |
| Pseudo-Time Indicator | −0.074 | 0.069 | −1.07 | 0.234 |
| Placebo DiD | 0.017 | 0.025 | 0.68 | 0.491 |
| Constant | 0.578 | 0.212 | 2.73 | 0.041 |
Appendix 2
Test of parallel trend assumption
| Hypothesis | Test statistic | p-value | Decision | Interpretation |
|---|---|---|---|---|
| Ho: Linear Trends are Parallel | 1.29 | 0.2594 | Fail to reject H0 | Confirms that pre-treatment trends in corporate performance are statistically parallel, indicating no significant differences between the treatment and control groups before SSCC adoption. This validates the DID model |
Appendix 3
Granger causality test
| Hypothesis | Test statistic | p-value | Decision | Interpretation |
|---|---|---|---|---|
| Ho: No effect in anticipation of Treatment | 0.65 | 0.5261 | Fail to reject H0 | Indicates that there is no anticipated effect from the treatment, suggesting observed changes post-treatment are not driven by anticipation |
| Ho: No pre-existing trend bias | 1.29 | 0.2594 | Fail to reject H0 | Confirms that pre-treatment trends in corporate performance are parallel, providing further confidence in DID results |
| Ho: No feedback effect from Corporate Performance to SSCC | 0.42 | 0.6578 | Fail to reject H0 | Indicates that changes in corporate performance did not influence SSCC adoption, ruling out reverse causality |
Note(s): Tests were conducted at a 5% significance level
Appendix 4
Calibration statistics
| Fuzzy set calibration | |||
|---|---|---|---|
| Construct | Fully-out | Cross-over | Fully-in |
| Employment | 85.488 | 92.631 | 99.296 |
| GDP | 1,350,613 | 5,228,940 | 9,589,898 |
| Profit | 219,360.55 | 578,829 | 923,592.3 |
| R&D Expenditure | 49,363 | 196,410 | 435,999 |
| Smart Supply Chain Construction | 1.000 | 1.000 | 1.000 |
| Total Assets | 937,762 | 4,694,056 | 9,475,890 |
| Total Liabilities | 111,955 | 2,944,065 | 4,527,313 |
| Corporate Performance | 1.0566 | 1.52074 | 2.02943 |
Appendix 5
Condition and Outcome Inefficiency
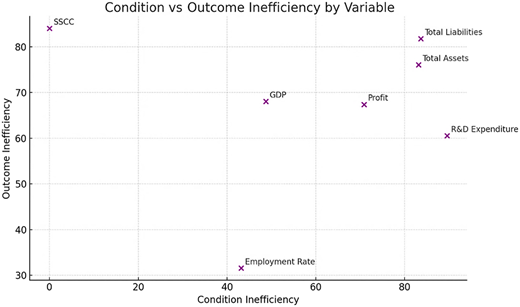
Source(s): Authors’ own work

