
Drawing on the theoretical concept of organisational fit, this paper questions the relevance of employees' participation in the link between continuous improvement (CI) and operational performance. The literature has long emphasised that to be successful, CI implementation needs to rely on employees' involvement as soon as its inception. This paper argues that this approach is not generalisable.
Based on a database of 330 firms across 15 countries, regression analyses were used to hypothesise that the fit between CI and employee participation is positively associated with operational performance, and that the fit between CI and centralisation of authority is negatively associated with operational performance. The authors also ran a robustness check with polynomial regression analyses and the response surface methodology.
CI–employee participation fit is positively associated with operational performance, suggesting that there is less need for employees to be involved when a firm has scarcely developed CI. Employee participation becomes gradually more relevant as CI progresses. Moreover, the results demonstrate that the CI–centralisation of authority fit is negatively associated with operational performance, suggesting that a top-down management approach with centralised authority is preferable when CI is low, whereas a bottom-up management approach is helpful when a firm has extensively developed CI.
This research draws on the concept of organisational fit to explore the relationships between internal practices in the operations management literature. The authors suggest that managers should dynamically balance the practices of employee participation and centralisation of authority as CI improves. This study highlights that CI has different evolutionary levels that require different managerial approaches and practices.
1. Introduction
Continuous improvement (CI) drives the evolution of a firm's management system through stepwise adjustments and modifications of products and processes to positively influence waste reduction and customer satisfaction, thus enhancing firm performance (Fullerton et al., 2014; Su and Linderman, 2016; Furlan and Vinelli, 2018; Galeazzo, 2021). It is a dynamic capability (Anand et al., 2009) that is patterned after management methods such as PDCA (plan–do–check–act), six sigma, TQM (total quality management) and kaizen events. However, many firms fail to pursue CI (McLean et al., 2017). Both scholars and practitioners agree that managers and employees have a key role in the successful implementation of CI (Anand et al., 2009; Onofrei et al., 2019), but they have apparently contradicting perspectives on how to manage their involvement in a firm's organisational context.
Scholars often emphasise the need for employees' participation through organisational mechanisms such as teamwork and suggestion schemes, implying an active involvement of employees in the improvement process (Tucker, 2016). They argue that the role of managers is to support employees, suggesting managers should adopt a bottom-up management approach with low centralisation of authority that allows employees to have control over their work and make their own decisions (Uhrin et al., 2017).
By contrast, practitioners often point to the central role of managers with high centralisation of authority, advocating the use of a top-down management approach with employees as the executors of orders (Hage and Aiken, 1967; Byrne, 2013) but scarcely participating in the decision-making process.
Both perspectives have advantages and disadvantages. According to the literature, enhancing employees' participation allows a firm to have access to employees' knowledge (Letmathe et al., 2012), but employees may perceive participation mechanisms as extra activities that increase job stress, reduce organisational commitment and lower motivation (Delbridge et al., 1992; Parker, 2003). Likewise, having managers adopt a top-down approach with centralisation of authority may monitor employees' actions, disciplining and coordinating as necessary, to facilitate the development of a change mindset and the creation of new organisational routines that, otherwise, employees may not be willing to embrace if a bottom-up management approach is adopted (Halevy et al., 2011; Zeng et al., 2017). However, centralisation of authority may reduce employees' degree of latitude, influencing employees' alienation, motivation and limiting collaboration with peers (Chiaburu et al., 2014).
The aim of this research is to bridge the gap between the two perspectives and to investigate when the advantages of employees' participation and centralisation of authority identified by the past literature emerge in CI initiatives. We argue that the apparent contradicting perspectives may be reconciled if we consider that CI is a dynamic phenomenon. In other words, we need to explore whether and to what extent employees' participation and managers' centralisation of authority are relevant to create a supportive organisational context to CI that improves operational performance. To this end, the present study draws on the concept of organisational fit. Organisational fit refers to the degree of coherence among different aspects of the organisation (Ginsberg and Venkatraman, 1985; Doty et al., 1993). We hypothesise that the CI–employee participation fit enhances operational performance. This implies that CI and employee participation should be progressively implemented together such that when CI is low, there is a scarce need to make employees participate in decision-making processes, whereas as when CI improves, employees become extensively involved in decision-making processes. Moreover, we hypothesise that the CI–centralisation of authority fit reduces operational performance. This implies that managers should limit employees' autonomy in decision-making when CI is not well developed throughout the organisation and progressively increase their autonomy as the firm becomes more familiar with CI. Altogether, these hypotheses argue that firms should be progressing on the adoption of CI initiatives by constantly balancing practices supportive of employees' involvement and practices limiting employees' involvement.
Based on a database of 330 firms across fifteen countries, we used regression analyses to test the effects of organisational fit between CI and employee participation and the organisational fit between CI and centralisation of authority on operational performance. In the regression analyses, we drew on the “fit as matching” perspective described by Venkatraman (1989) and operationalised CI–employee participation fit as the absolute difference between CI and employee participation and CI–centralisation of authority fit as the absolute difference between CI and centralisation of authority. As a robustness check, we employed polynomial regression analyses and response surface methodology to assess the effect of organisational fit (Edwards, 1994, 2002). We found that a closer fit in the relative magnitude of CI and employee participation is positively associated with operational performance. Moreover, we found that a closer fit between CI and centralisation of authority is negatively associated with operational performance.
Our results provide both theoretical and managerial insights. From a theoretical perspective, we provide four key contributions. First, while the CI literature argues for a key role of employees and managers (Anand et al., 2009; Galeazzo et al., 2017), we currently lack empirical research that explains how their roles evolve as CI improves. Our theoretical model addresses this shortcoming by demonstrating that the roles of employees and managers are adaptive and responsive to CI implementation. Second, our study extends the literature on CI as a socio-technical system. Because past research has traditionally focused on either the social perspective or the technical perspective on CI (Sakakibara et al., 1993; Netland, 2016), we prove that the dynamic nature of CI requires the two perspectives to interact recursively. Indeed, practices that move forward the social side of CI need to co-evolve with practices that move forward the technical side of CI and vice versa. Third, by conceptualising CI as a dynamic capability that comprises a set of operational routines, we contribute to the literature on organisational routines and answer a call for additional research on the social interactions among the actors involved in routines (Howard-Grenville, 2005; Sargis-Roussel et al., 2017). Fourth, we extend the literature on organisational fit that explores the relationship among internal practices by drawing on the scarcely tested “fit as matching” perspective and by explaining the important insights that emerge when both fit and misfit are investigated. From a managerial perspective, this research suggests managers should adopt a contextual approach that dynamically balances the practices of employee participation and centralisation of authority as the firm moves along its CI journey.
2. Theoretical background and hypotheses development
2.1 Continuous improvement and the role of employees and management
Peng et al. (2008) operationalised CI as a combination of the three organisational routines of process management (PM), leadership involvement (LI) and improvement orientation (IO). PM includes activities that pursue process control and standardisation by using techniques and charts that help to reduce process variation, increase efficiency and detect incongruences to prevent problems and foster improvement (Rondeau et al., 2000). LI refers to a set of practices that encourage top management and major department heads to be involved and take responsibility for CI initiatives. IO is the development of an organisational culture oriented towards the continuous research of improvement in processes and products (Roth, 1996; Linderman et al., 2010).
CI incorporates both a technical and a social perspective (McAdam and Lafferty, 2004). From a technical perspective, CI uses systematic and organised procedures that clearly define steps, tasks, tools and metrics to measure the improvement process and attain the expected goals (Linderman et al., 2006). The main objective of these procedures is to keep variability low through incremental improvements, thus requiring employees to show discipline in following the procedures and commitment to sustain the ongoing improvement activities. From a social perspective, CI relies on the coordination of both workforce and managers. Workforce plays a pivotal role in CI because employees' knowledge, skills and competences are paramount at searching for the underlying causes of problems and identifying opportunities for improvement (Letmathe et al., 2012). Also, managers have an important role in CI because their commitment helps building a common vision and ensures continuity of the workforce effort so that CI is not viewed as another fad (Choo et al., 2007). Both the technical and social aspects of CI are important to pursue superior operational performance (Galeazzo and Furlan, 2018; Powell and Coughlan, 2020).
Several studies have found that the lack of an adequate organisational context in managing the technical and social side of CI initiatives may negatively affect performance (Galeazzo et al., 2017; Onofrei et al., 2019), suggesting that the success of CI depends upon the organisational context. According to the literature (Choo et al., 2007; Anand et al., 2009; Matthews et al., 2017), two common enablers of an organisational context conducive to successful CI initiatives are employee participation and managers' centralisation of authority. However, the degree of employee participation and centralisation of authority that is more congruent with CI has been scarcely investigated. Indeed, CI is not a monolithic initiative that is either implemented or not. As Bessant and Francis (1999) observed, CI is a learning process that progresses through five levels, starting from random problem-solving activities (level 1), through a structured and systematic problem-solving approach that is constantly measured and monitored (level 3) to the creation of a learning organisation (level 5). Such a learning process is often a combination of non-linear, complex, dynamic phases that may alternatively experience quick accelerations, stagnation and revamping (Lapré et al., 2000; Lapré and Van Wassenhove, 2001; Butler et al., 2018). These insights highlight the need to explore CI as a dynamic phenomenon that can be more or less implemented within a firm, thus requiring the role of employees and managers (i.e. employee participation and centralisation of authority) to change accordingly. The investigation is of the extent to which a synchronised modification of employee participation or centralisation of authority and improvement activities contribute to operational performance calls for the concept of organisational fit.
2.2 Organisational fit
Organisational fit is defined as the degree of coherence among activities within a firm that directly affect firm performance (Ginsberg and Venkatraman, 1985; Doty et al., 1993). This implies that a firm is conceptualised as a system of mutually reinforcing choices: choices related to strategies, resources, organisational infrastructures and activities. The study of organisational fit is very common in testing congruence in organisational research such as person–environment fit (Ehrhardt and Ragins, 2019), person–job fit (Tims et al., 2016), organisational structure–external environment fit (Patel, 2011) and leader–follower fit (Kim et al., 2020). However, the exploration of the organisational fit among internal practices in the operations management literature is less common (see Appendix 1 for an overview of prior research). The few studies available on CI initiatives largely converge on the need of analysing how firms modify the organisational context to successfully implement improvement choices.
In this research, organisational fit refers to the congruence between the magnitude of CI and employee participation. Fit implies that performance increases as the extent to which there is a similarity in the pace of new incremental improvements and the degree of employee participation. Instead, misfit implies that performance decreases because firms may either have consistently adopted CI initiatives with low employee participation or have extensively fostered employee participation while CI is still at the outset. Moreover, this study argues that the fit between CI and centralisation of authority is negatively associated with performance, whereas misfit is positively associated with performance. This implies that managers should adopt a top-down managerial approach when firms have only marginally implemented CI initiatives to improve performance. On the contrary, a top-down management approach is more likely to worsen performance if the firm has attained high levels of CI maturity.
2.3 The effect of continuous improvement–employee participation fit on operational performance
Employee participation can be conceptualised as the backbone of firms implementing CI. It is usually encouraged by the practice of asking employees for suggestions and the practice of grouping employees together to solve problems (Forza, 1996; Baird et al., 2011; Furlan et al., 2011). Seeking suggestions fosters participation by facilitating employees' expression of their opinions and ideas about work-related issues and delegates authority to employees (Arthur and Huntley, 2005). Teamwork is an effective way to foster participation because it increases employees' sense of responsibility towards improvement projects and motivates them through collaboration with peers and supervisors (Forza, 1996; Furlan et al., 2019). Thus, an increase in the use of suggestions and teamwork allows employees to participate in the organisation.
Higher levels of employee participation create a sense of agency, readiness and acceptance of the improvement process. There is a consensus that employee participation is a key enabler of the successful implementation of CI initiatives as highlighted by several literature reviews on TQM (Sila and Ebrahimpour, 2003), six sigma (Yadav and Desai, 2016) and lean production (Magnani et al., 2019). Employees have work-related knowledge that can contribute to expanding organisational knowledge (Nonaka, 1994). Without employee participation, a firm would be hindered in detecting issues that prevent improvements (Tucker et al., 2007) or exploring potential improvements in organisational functioning (Letmathe et al., 2012). Despite these benefits, participation can be perceived as a negative practice by employees. For example, employee participation is associated with extra-role behaviours as it is a practice that goes beyond the job requirements defined in the job description. As a consequence, it increases workload, thus potentially becoming a source of stress, decreasing motivation and reducing individual autonomy (Beehr et al., 2010). Therefore, there are both benefits and drawbacks associated with employee participation.
We argue that the degree of implementation of CI and employee participation to improve operational performance should occur at the same pace. Synchronised implementation of CI and practices fostering employee participation helps to minimise the tensions between benefits and drawbacks of employee participation. A low level of CI implies that a firm is still struggling to replace old routines with new ones (PM, LI, and IO routines), which implies an urge to change management and workforce mindsets. These changes require careful consideration of the extent to which employees should participate in improvement initiatives. Arthur and Aiman-Smith (2001) suggested the need for gradual adoption of employee participation practices. They found that the portion of suggestions that are more effective for improvement increases over time. The reason is that, in the beginning, employees “do not challenge the status quo in terms of the underlying values of an organisation and the nature of the employee-management relationship” (p. 743). We posit that, as suggestions are implemented, a cultural orientation towards improvement and a new leadership approach will emerge (i.e. CI increases) that makes employees more likely to challenge the status quo and provide more effective suggestions, thus positively affecting performance.
Similarly, employees may not voice up and help solve problems in teamwork if they perceive it as a waste of time or unnecessary extra work or if they do not know the procedures and methods to solve the problems (Tortorella et al., 2018; Furlan et al., 2019). When CI is scarcely implemented in the workplace, employees have limited familiarity with CI-related procedures and methods (i.e. PM routine is low). Such a lack of familiarity might be frustrating if employees are expected to use them to make improvement decisions (Tang et al., 2010). Moreover, employees may not be willing to participate because they tend to resist organisational changes as a reflection of improvement initiatives. After all, individuals are creatures of habit (i.e. IO is low). Most research highlights that participation builds up as new initiatives yield trustful results (Oreg et al., 2011; Jurburg et al., 2017). Therefore, by providing a better understanding of CI procedures and methods (PM routine), a supportive leadership approach (LI routine) and developing a mindset oriented to improvement (IO routine), it is likely that employees would actively participate in teamwork, thus effectively contributing to organisational knowledge and, eventually, improving performance.
Thus, some prerequisites for fostering employee participation cannot be taught a priori and need to be developed as firms become more involved in CI initiatives (Jørgensen et al., 2003; Netland, 2016; Hirzel et al., 2017). A stepwise adjustment, indeed, would allow a mutual reinforcement that may, in turn, enhance operational performance. This implies that a misfit between CI and employee participation poses threats to performance through an increased risk of resource waste and poor adjustments of different activities. In summary, the magnitude of employee participation in an organisational context should evolve at the same pace as CI maturity.
The organisational fit between CI and employee participation is positively associated with operational performance.
2.4 The effect of continuous improvement–centralisation of authority fit on operational performance
Centralisation of authority is typical of centralised firms with mechanistic structures in which managers do not defer decision-making downward in the organisation. Employees do not have active participation in the organisation and have limited opportunities to make suggestions to improve products and processes, provided that they are required to implement decisions from superiors (Hage and Aiken, 1967; Byrne, 2013). As knowledge is pushed from upward through the hierarchy in centralised firms, managers have more managerial control over the flow of knowledge compared to decentralised firms that allow knowledge to be scattered throughout the organisation.
Studies on the effects of (de)centralisation have produced mixed results. Most literature highlights that decentralisation is positively associated with several employee behaviours and job outcomes such as satisfaction, motivation, involvement, loyalty and creativity that improve performance (Hirst et al., 2011; Ma et al., 2019). Conversely, centralisation influences employee alienation as it limits self-control and reduces collaboration with peers (Chiaburu et al., 2014). However, research also highlights that centralisation is not always negative and may at times also be helpful for the organisation. Establishing a clear chain of command can meet fundamental human needs, such as security, predictability and certainty (Magee and Galinsky, 2008; De Hoogh et al., 2015). It clarifies the division of labour and facilitates coordination because it induces everyone to understand his or her place in the social hierarchy and simplifies interactions among members of the organisation (Zitek and Tiedens, 2012). It promotes cooperation and reduces conflict because managers exercise power on employees by eliciting compliance and obedience (Halevy et al., 2011). Centralisation may also indirectly create a supportive climate because employees may turn to their colleagues to ask for help or communicate, thus fostering group cohesion (Yen and Teng, 2013).
The scant research exploring the role of (de)centralisation in improvement initiatives shows evidence of the mixed effects of centralisation of authority (Nahm et al., 2003; Zhang et al., 2012; Zeng et al., 2017). One of these examples is Zeng et al. (2017), who demonstrated that a centralised organisational context is positively associated with hard quality improvements related to process stability, compliance and reduced defect rates. The rationale is that the concentration of decision-making reduces variation in individual actions and facilitates control over employees and their tasks, thus making the implementation of hard quality improvements more effective. On the contrary, Nahm et al. (2003) found that a decentralised organisational context is positively associated with activities such as quality improvements and process improvements. They argued that, as the workforce begins to acquire knowledge through training and cross-functional groups, it is possible to shift decision-making downward. The chance for employees to draw on their knowledge to make decisions enables firms to implement improvements. The contrasting results that emerge from the CI literature call for a more in-depth investigation of the conditions under which centralisation better fits with CI implementation.
We argue that a closer fit between CI and centralisation of authority is negatively associated with performance. Indeed, there is a need for a highly centralised decision-making process when CI is still marginally developed within the organisation, whereas this need disappears as CI becomes entrenched in the organisation. Specifically, CI requires efficient control over decisions. When managers arrive at decisions with the involvement of employees, the initial stage of improvement initiatives may lose momentum as decision-making processes can take a long time and perhaps be counterproductive as there is a lack of coordination and several individuals are allowed to shape decisions. Indeed, situations of high decentralisation may invite employees to share their ideas and make autonomous decisions on how to progress on CI-related activities. Employees may assume that improvement goals are difficult to reach and become less prone to engage in problem-solving to meet improvement challenges. By contrast, in centralised organisations, decision-making processes are effective as managers can give directions to employees, centralise their activities and eventually correct them (Wally and Baum, 1994).
Moreover, CI requires an alignment of vision, information and efforts when its implementation is still limited. The less confined is the locus of the decision-making process, the more freedom there is for the expression of individual opinions and ideas. This may increase uncertainty about the appropriate direction for improvements. As CI determines a change in routines, modifying the way certain activities are performed (Peng et al., 2008), such a change can initially destabilise employees, thus threatening employees' need for safety and predictability (Magee and Galinsky, 2008; De Hoogh et al., 2015). Moreover, in a centralised organisation, employees are more likely to comply with rules and guidelines coming from their leaders to avoid sanctions and/or gain rewards (Halevy et al., 2011). Therefore, it is more likely that managers may convince employees to do things differently, such as modifying their jobs to improve production processes and products. As the benefits of these improvements become evident, it will be easier to engage employees and empower them with the autonomy to pursue further changes.
Therefore, an organisational context with high (low) centralisation of authority is preferable to improve performance when CI is low (high).
The organisational fit between CI and centralisation of authority is negatively associated with operational performance.
3. Methods
3.1 Data collection and analysis
This study uses the fourth round of the high performance manufacturing (HPM) project to test the hypotheses and the theoretical model. HPM is an international project started in 1989 to investigate management practices and performance characteristics in US-owned and Japanese-owned manufacturers. The selected firms could be either a traditional firm or a world-class manufacturer (randomly selected from a list of winners of one or more awards such as the Shingo Prize or industry leaders recognised by the literature, trade magazines or newspapers) with more than 100 employees (Schroeder and Flynn, 2002). The first round of the HPM project selected three manufacturing industries (electronics, machinery and transportation components). These industries were included because they were subject to strong international competitive pressures and the practices relevant for this project (e.g. just-in-time and quality management practices) were mostly implemented by firms in these three industries (Morita and Machuca, 2018). The following rounds (the second round started in 1996; the third round started in 2004 and the fourth round started in 2012) involved research teams from universities located outside the US that were responsible for collecting data in their countries following a stratified sample procedure from manufacturing plants (or the manufacturing subsidiary of an international company). In all rounds, the project team leaders expanded the database to cover more countries and more questions although they did not include additional industry types.
The present study is drawn on a database of 330 plants from three industries and fifteen countries in the HPM project (Table 1). Table 2 exhibits the characteristics of this sample. The sample is significantly different in terms of size, age and lean maturity (used as a proxy for CI). Degree of production repetitiveness (dpr), which measures the flow of the production processes employed (low values indicate the plant mostly adopts job shop, manufacturing cells, and high values indicate the plant mostly adopts dedicated flow lines/assembly lines) (Beraldin et al., 2020), shows that the sampled plants mostly employed production processes characterised by low variety and high volume.
Segmentation of the research sample per country and industry type
| Country | Industry | Total | ||
|---|---|---|---|---|
| Electronics | Machinery | Transportation | ||
| Brazil | 5 | 7 | 12 | 24 |
| China | 10 | 16 | 4 | 30 |
| Spain | 8 | 7 | 10 | 25 |
| Finland | 6 | 6 | 5 | 17 |
| Germany | 6 | 13 | 9 | 28 |
| Israel | 21 | 5 | 0 | 26 |
| Italy | 7 | 17 | 5 | 29 |
| Japan | 6 | 7 | 9 | 22 |
| South Korea | 8 | 5 | 13 | 26 |
| Sweden | 4 | 4 | 1 | 9 |
| Switzerland | 3 | 6 | 2 | 11 |
| Taiwan | 19 | 10 | 1 | 30 |
| United Kingdom | 4 | 5 | 4 | 13 |
| USA | 5 | 7 | 3 | 15 |
| Vietnam | 10 | 7 | 8 | 25 |
| Total | 122 | 122 | 86 | 330 |
Characteristics of the research sample
| Country | Sizea,b | Agec | Lean maturityd | Dpre |
|---|---|---|---|---|
| Brazil | 906 | 40 | 11 | 65 |
| China | 756 | 23 | 9 | 65 |
| Spain | 312 | 33 | 8 | 68 |
| Finland | 343 | 55 | 7 | 72 |
| Germany | 916 | 68 | 9 | 69 |
| Israel | 831 | 34 | 10 | 73 |
| Italy | 311 | 49 | 7 | 73 |
| Japan | 2.766 | 64 | 20 | 78 |
| South Korea | 591 | 34 | 10 | 83 |
| Sweden | 616 | 78 | 7 | 73 |
| Switzerland | 270 | 62 | 10 | 65 |
| Taiwan | 1.745 | 28 | 12 | 74 |
| United Kingdom | 245 | 44 | 13 | 61 |
| USA | 368 | 38 | 10 | 67 |
| Vietnam | 860 | 19 | 5 | 64 |
| Overall sample | 832 | 44 | 10 | 71 |
Note(s):
aNumbers in the table represent mean values
bSize is measured as the total number of employees
cAge is measured as the number of years since the plant was established at the time the questionnaire was filled in
dLean maturity is measured as the total number of years of lean practices adoption at the time the questionnaire was filled in
eDegree of production repetitiveness refers to the characteristics of the production flow. Low values indicate that the plant mostly adopts job shop configurations characterised by low volume and high variety of the output; high values indicate that the plant mostly adopts dedicated assembly lines/flow lines configurations characterised by high volume and low variety. This construct is measured following Beraldin et al. (2020)
Data collection was carried out by each country's research team. Both the plants sampled in previous rounds and new randomly selected plants were contacted for participation (Naor et al., 2010). In each plant that agreed to participate, an appointed survey coordinator received a package of twelve survey questionnaires, each focused on a specific area (accounting, downstream supply chain management, environmental affairs, human resources, information system, plant management, process engineering, product development, production control, quality management, supervision and upstream supply chain management). Questionnaires were translated into the respondents' native language. Translation and back-translation procedures followed recommendations by Brislin (1980). Each questionnaire was administered to specific respondents. In particular, we asked the survey coordinator to target the two most knowledgeable informants in each area, except for the accounting area in which the questionnaire was administered to a single informant. The use of multiple questionnaires completed by multiple informants helps to mitigate common method bias. Responses from the two key informants of each area were averaged to create a single score per survey item.
3.2 Measures
This study used a subset of the survey items reported in the following questionnaire areas: plant management, process engineering, quality management and supervision (see Table 3 and Appendix 2 for details). All items were measured on a five-point Likert scale, except otherwise indicated. The items were selected based on the prior literature; thus, content validity was assumed. Following other studies that used the HPM database (Peng et al., 2008; Galeazzo et al., 2017), items were standardised per country and industry.
Constructs, items description, factor loadings, Cronbach's alphas, Raykov's ρ, AVE and CR
| Scale description | Item description | First-order factor loadingsa | Second-order factor loadingsa | Cronbach's alpha | Raykov's ρ | AVE | CR |
|---|---|---|---|---|---|---|---|
| >0.5 | >0.5 | >0.7 | >0.7 | >0.5 | >0.6 | ||
| Continuous improvement (CI)b | 0.85 | 0.79 | 0.50 | 0.74 | |||
| Process management (PM) | 0.54 | 0.88 | 0.88 | 0.64 | 0.88 | ||
| pm01. A large percentage of the processes on the shop floor is currently under statistical quality control | 0.82 | ||||||
| pm02. We make extensive use of statistical techniques to reduce variance in processes | 0.86 | ||||||
| pm03. We use charts to determine whether our manufacturing processes are in control | 0.75 | ||||||
| pm04. We monitor our processes using statistical process control | 0.78 | ||||||
| Leadership involvement (LI) | 0.80 | 0.82 | 0.74 | 0.54 | 0.82 | ||
| li01.All major department heads within the plant accept their responsibility for quality | 0.64 | ||||||
| li02.Plant management provides personal leadership for quality products and quality improvement | 0.80 | ||||||
| li03.Our plant management creates and communicates a vision focused on quality improvement | 0.72 | ||||||
| li04.Our plant management is personally involved in quality improvement projects | 0.77 | ||||||
| Improvement orientation (IO) | 0.74 | 0.73 | 0.82 | 0.42 | 0.74 | ||
| io01. We strive to continually improve all aspects of products and processes rather than taking a static approach | 0.73 | ||||||
| io02. Continuous improvement makes our performance a moving target, which is difficult for competitors to attack | 0.62 | ||||||
| io03. We pay close attention to the organisational and skill changes needed for new processes. (dropped) | 0.33 | ||||||
| io04. We believe that improvement of a process is never complete; there is always room for more incremental improvement | 0.58 | ||||||
| io05. Our organisation is not a static entity, but engages in dynamically changing itself to better serve its customers | 0.64 | ||||||
| Centralisation of authorityc | 0.82 | 0.84 | 0.50 | 0.83 | |||
| ca01. There can be little action taken here until a supervisor approves a decision | 0.51 | ||||||
| ca02. A person who wants to make his own decisions would be quickly discouraged | 0.69 | ||||||
| ca03. Even small matters have to be referred to someone higher up for a final answer | 0.74 | ||||||
| ca04. I have to ask my boss before I do almost anything | 0.85 | ||||||
| ca05. Any decision I make has to have my boss's approval | 0.69 | ||||||
| Employee participationc | 0.79 | 0.75 | 0.72 | 0.83 | |||
| Suggestions (SU) | 0.73 | 0.74 | 0.71 | 0.46 | 0.77 | ||
| su01. Management takes all product and process improvement suggestions seriously | 0.67 | ||||||
| su02. We are encouraged to make suggestions for improving performance at this plant | 0.65 | ||||||
| su03. Management tells us why our suggestions are implemented or not used | 0.65 | ||||||
| su04. Many useful suggestions are implemented at this plant | 0.75 | ||||||
| su05. My suggestions are never taken seriously around here (reversed) (dropped) | 0.46 | ||||||
| Teamwork for problem-solving (TPS) | 0.95 | 0.76 | 0.77 | 0.41 | 0.78 | ||
| tps01. During problem-solving sessions, we make an effort to get all team members' opinions and ideas before making a decision | 0.55 | ||||||
| tps02. Our plant forms teams to solve problems | 0.65 | ||||||
| tps03. In the past three years, many problems have been solved through small group sessions | 0.70 | ||||||
| tps04. Problem-solving teams have helped improve manufacturing processes at this plant | 0.75 | ||||||
| tps05. Employee teams are encouraged to try to solve their own problems, as much as possible. (reversed) (dropped) | 0.39 | ||||||
| tps06. We do not use problem-solving teams much, in this plant. (reversed) | 0.54 | ||||||
Note(s):
aFactor loadings are all significant at the significant level of p < 0.001
bQuestionnaire area: quality management for all items except for item io03 (item io03 was in the process engineering questionnaire). Respondents to the quality management questionnaire were quality managers and/or quality control managers and/or six sigma black belts. Respondents to the process engineering questionnaire were process engineer and/or production managers
cQuestionnaire area: plant supervisor. Respondents to this questionnaire were supervisors and/or work area managers
3.2.1 Operational performance
Operational performance is the dependent variable of our model. Consistent with the prior literature (Bozarth et al., 2009; Zhang et al., 2012), a formative measure of operational performance was used. Specifically, we started by identifying the performance subdimensions that better assessed operational performance. This research created four performance subdimensions: cost, quality, delivery and flexibility. These are the same four performance subdimensions used in previous studies to measure operational performance (Bozarth et al., 2009; Furlan et al., 2011; Zhang et al., 2012; Chavez et al., 2013), thus showing content validity. Appendix 2 reports items description, factor loadings, Cronbach's alpha, composite reliability (CR) and the fit indices of the confirmatory factor analysis (CFA) for all the performance subdimensions, demonstrating reliability and construct validity. We then used the four performance subdimensions to create a weighted index. A weighted index is used to consider that firms develop different manufacturing strategies in a competitive environment. If performance subdimensions were treated as equally important, the performance measure would be biased because it would not account for the firm's competitive priorities. This bias was therefore avoided by weighting performance subdimensions based on their relative importance. For example, a firm with a leadership cost strategy is likely to place a high emphasis on low price as a competitive priority, lending to the performance subdimension of cost a relative greater importance compared to the other subdimensions. Therefore, this research weighted each performance subdimension based on the extent to which a firm emphasised it as a strategic goal (Bozarth et al., 2009; Zhang et al., 2012) using the formula provided in Appendix 2.
Note that operational performance is a formative variable measured as a composite of multiple indicators (in our case, the sum of the four weighted performance subdimensions) assessing different facets of the formative construct. This implies that conventional procedures used to assess the reliability and construct validity do not apply to the overall construct of operational performance (Diamantopoulos and Winklhofer, 2001). Despite the problems with conventional procedures, scholars agree that, besides content validity, one should investigate the multicollinearity and nomological validity of formative variables. In our study, multicollinearity was not an issue for operational performance as the variance inflation factors (VIFs) among the four subdimensions ranged between 1.33 and 1.57, which are below the threshold of 10 (Hair et al., 2006). Therefore, the unique contribution of each indicator was demonstrated. Nomological validity is checked by linking operational performance to theoretically related constructs (i.e. antecedents and/or consequences) (Diamantopoulos and Winklhofer, 2001). In our study, we constructed a model to assess the effect of operational performance on the reflective variable of customer satisfaction. Higher operational performance would achieve higher levels of customer satisfaction (Zhang et al., 2003). The model had good overall fit (χ2/df = 1.04, CFI = 0.99, TLI = 0.99, RMSEA = 0.012), and the path from operational performance and customer satisfaction was positive and significant (β = 0.14, p < 0.01) as expected. Therefore, operational performance had nomological validity. Overall, operational performance was a reliable and valid construct in this study.
3.2.2 Continuous improvement (CI)
CI was measured as a second-order latent variable drawing on Peng et al. (2008). CI includes, as described earlier, the three first-order factors of PM, IO and LI. Specifically, PM was measured by four items adapted from Cua et al. (2001). IO was measured by four items based on Liu et al. (2006). LI was measured by four items based on Ketokivi and Schroeder (2004). A second-order CFA was used to test whether manifest items loaded on the three first-order factors and, in turn, whether they loaded onto the super-ordinate factor of CI. As reported in Table 1, CFA showed that all the items had standardised loadings greater than 0.5 on their respective constructs, except for item io03 (0.329). We removed this item to ensure that all the constructs had unidimensionality (Bagozzi, 1994). The CFA results showed a good fit (χ2/df = 1.188, CFI = 0.993, TLI = 0.991, RMSEA = 0.024). Reliability was assessed using Cronbach's alpha, Raykov's rho (Raykov, 1998) and composite reliability (CR). Raykov's rho is a reliability coefficient that does not assume tau-equivalence (that is, equal loadings among items) as Cronbach's alpha does. The lowest value of Cronbach's alpha was for IO (0.73), which is above the recommended threshold of 0.7. IO also had the lowest CR value (0.74), which is well above the recommended threshold of 0.6, whereas LI had the lowest value of Raykov's rho (0.74), which is above the recommended minimum of 0.7. For convergent validity, the Fornell and Larcker's (1981) criterion for calculating the average variance extracted (AVE) of all measures revealed that IO had an AVE of 0.42, which is slightly below the 0.5 cut-off value. In this case, as Fornell and Larcker (1981) stated, we can argue that IO is sufficiently different from the other constructs because CR is higher than 0.6. To assess discriminant validity of the measures, the CFA fit indices for the three-factor model were compared to the constrained two- and single-factor CFA models (the two-factor model had χ2/df = 5.176, CFI = 0.845, TLI = 0.807, RMSEA = 0.115 and the single-factor model had χ2/df = 7.970, CFI = 0.736, TLI = 0.677, RMSEA = 0.148). Overall, CI is found to be a reliable and valid construct, and it is computed by combining the factor score weights from CFA with the standardised items.
3.2.3 Centralisation of authority
The extent to which an organisational context has a high degree of centralisation is reflected in the centralisation of authority (Aiken and Hage, 1966), which is defined as “the extent of reliance upon supervisors in making decisions about individually assigned tasks” (p. 502). Centralisation of authority was measured as a latent variable comprising five items based on Aiken and Hage (1966) (Table 3). To assess the reliability and validity of the centralisation of authority, we computed Cronbach's alpha, Raykov's rho, CR and AVE. All the values exceeded the recommended thresholds (Table 3). A CFA was performed to further check for construct validity. As the model's estimation showed a good fit (χ2/df = 1.647, CFI = 0.995, TLI = 0.987, RMSEA = 0.046) with all items loading significantly above the 0.5 standard value, these estimates demonstrated convergent validity (Bagozzi, 1994). The measurement items are reported in Table 3. Centralisation of authority was computed by combining the factor score weights from CFA with the standardised items.
3.2.4 Employee participation
The extent to which an organisational context facilitates employee participation is generally achieved by implementing formal mechanisms such as suggestion systems and teamwork for problem-solving (Forza, 1996; Baird et al., 2011; Furlan et al., 2011). Therefore, employee participation was measured as a second-order latent variable comprising two first-order latent factors: employee suggestions and teamwork for problem-solving. The employee suggestions factor was measured by using five items based on Zeng et al. (2015), reflecting the extent to which employees are involved and proactively participate in the decision-making process. Teamwork for problem-solving was assessed using six items based on Zeng et al. (2015), capturing the extent to which a manufacturing plant creates organisational infrastructures for involving employees in decisions about production problems and the process improvements. Reliability was checked using Cronbach's alpha, Raykov's rho, and CR. Table 3 shows that all values were above the minimum cut-off levels. A second-order CFA model was conducted to test convergent and discriminant validity. To improve the measurement model, we had to eliminate two items (su05 and tps05) that had low factor loadings. The resulting measurement model showed a good fit (χ2/df = 2.316, CFI = 0.963, TLI = 0.942, RMSEA = 0.066). Convergent validity is supported because all factor loadings exceeded the threshold of 0.5 (Hair et al., 2006), and AVE values were above the minimum level of 0.4, which is sufficient if CR values exceed 0.6 (Fornell and Larcker, 1981). Discriminant validity was assessed comparing the two-factor CFA model with the single-factor CFA model. The two-factorsmodel presented better fit indices than the other model (χ2/df = 3.412, CFI = 0.924, TLI = 0.894, RMSEA = 0.089), thus supporting discriminant validity. Overall, employee participation was a reliable and valid construct, and it was computed by combining the factor score weights from CFA with the standardised items.
3.2.5 Continuous improvement–employee participation fit and continuous improvement–centralisation of authority fit
CI–employee participation fit and CI–centralisation of authority fit measure the organisational fit based on the “fit as matching” perspective described by Venkatraman (1989). According to Venkatraman (1989), fit as matching is operationalised as the absolute difference between two variables. CI–employee participation fit was operationalised as the absolute difference between CI and employee participation in line with previous studies (e.g. Cao et al., 2009). Similarly, the CI–centralisation of authority fit was operationalised as the absolute difference between CI and the centralisation of authority.
3.2.6 Control variables
We included size and age as control variables following the previous literature (Zhang et al., 2012; Ma et al., 2019). The size was measured as the natural logarithm of the number of employees at plants. Age was measured as the number of years since the plant was established.
4. Analysis and results
Table 4 reports the descriptive statistics and correlations of the main variables, and Table 5 presents the results of the regression analyses. Model 1 includes the control variables. Model 2 adds the CI–employee participation fit variable to the control variables. Model 3 adds the CI–centralisation of the authority fit variable to the control variables. Model 4 adds both CI–employee participation fit and CI–centralisation of authority fit to the control variables.
Correlation matrix, mean and standard deviation (SD) of the variables
| Mean* | S.D. | 1 | 2 | 3 | 4 | 5 | 6 | 7 | 8 | 9 | 10 | 11 | |
|---|---|---|---|---|---|---|---|---|---|---|---|---|---|
| 1. CI | 3.89 | 0.61 | 1 | ||||||||||
| 2. PM | 3.42 | 1.01 | 0.65* | 1 | |||||||||
| 3. IO | 4.26 | 0.55 | 0.78* | 0.29* | 1 | ||||||||
| 4. LI | 4.01 | 0.70 | 0.87* | 0.76* | 0.36* | 1 | |||||||
| 5. Employee participation | 3.90 | 0.60 | 0.60* | 0.25* | 0.71* | 0.33* | 1 | ||||||
| 6. Suggestions | 3.92 | 0.63 | 0.60* | 0.20* | 0.73* | 0.32* | 0.92* | 1 | |||||
| 7. Teamwork | 3.89 | 0.66 | 0.61* | 0.23* | 0.72* | 0.32* | 0.99* | 0.96* | 1 | ||||
| 8. Centralisation of authority | 2.51 | 0.85 | −0.21* | 0.02 | −0.34* | −0.04* | −0.34* | −0.33* | −0.35* | 1 | |||
| 9. Operational performance | 3.80 | 0.56 | 0.05* | 0.02 | 0.06* | 0.02 | 0.14* | 0.12* | 0.13* | −0.06* | 1 | ||
| 10. Size (log n. employees) | 6.01 | 1.17 | 0.18* | 0.20* | 0.13* | 0.17* | 0.15* | 0.09* | 0.14* | −0.14* | 0.06* | 1 | |
| 11. Age | 43.62 | 33.37 | 0.01 | 0.06* | 0.01 | 0.01 | 0.00 | 0.03 | 0.01 | 0.03 | 0.01 | 0.13* | 1 |
Note(s): *Raw data (not standardised) was used to measure mean and standard deviation values
Results of the regression analyses
| Operational performance | ||||
|---|---|---|---|---|
| Model 1 | Model 2 | Model 3 | Model 4 | |
| CI–employee participation fit | −2.211** (1.021) | −2.313** (1.013) | ||
| CI–centralisation of authority fit | 1.434** (0.671) | 1.502** (0.666) | ||
| Size | 0.215 (0.256) | 0.214 (0.254) | 0.183 (0.255) | 0.183 (0.183) |
| Age | 0.000 (0.009) | 0.003 (0.009) | 0.003 (0.009) | 0.005 (0.009) |
| (Constant) | −1.375 (1.567) | −0.658 (1.589) | −2.084 (1.590) | −1.367 (1.607) |
| R-squared | 0.003 | 0.023 | 0.022 | 0.043 |
| Adj R-squared | −0.005 | 0.01 | 0.01 | 0.027 |
| Observations | 240 | |||
Note(s): **p < 0.05
Standard deviation in parentheses
The results in Model 2 provide support for Hypothesis 1 (b = −2.211**, p < 0.05), suggesting that the greater the absolute difference between CI and employee participation, the lower the operational performance will be. Specifically, a negative correlation between CI–employee participation fit and operational performance indicates that a small distance between CI and employee participation is positively associated with operational performance. Hence, an organisational misfit between CI and employee participation might explain poorer operational performance, whereas a closer fit of CI and employee participation might indicate superior operational performance. The results in Model 3 provide support for Hypothesis 2 (b = 1.434**, p < 0.05), suggesting that the greater the absolute difference between CI and centralisation of authority, the higher the operational performance will be. This implies that centralisation is effective when CI implementation is low. As the firm progresses along the stepwise improvement process, a hierarchical top-down management approach is more likely to be negatively associated with operational performance. The results in Model 4 further support the findings of Models 2 and 3 by demonstrating that a large distance between the levels of CI and employee participation negatively affects operational performance, while a large distance between the levels of CI and centralisation of authority has a positive effect. This implies that, when there is a low implementation of CI initiatives, managers who exert centralisation of the decision-making process and scarcely involve employees through participation practices are more likely to create an organisational context that links CI to superior performance. Similarly, when there is a high implementation of CI initiatives, managers who foster the participation of employees while delegating them authority are more likely to create an organisational context that links CI to superior performance.
4.1 Robustness check
Some researchers have criticised the use of a single index, such as an absolute difference to operationalise fit (Edwards, 1994, 2002; Su et al., 2019). As a robustness check, this study employed the polynomial regression analysis with response surface methodology (Edwards, 1994, 2002), an alternative approach that has gained popularity (e.g. Khazanchi et al., 2007; Patel, 2011). More specifically, two polynomial regressions with response surface methodology were estimated, one including CI and employee participation and another including CI and centralisation of authority. Before computing polynomial regressions, Edwards and Parry (1993) recommend regressing the dependent variable on the individual main independent variables. If the main effects are significant, higher-order terms are introduced and the polynomial regressions can be computed. The polynomial regressions were specified as in the following equation:
where Y stands for operational performance, X1 stands for CI, X2 stands for employee participation (centralisation of authority). Equation 1 includes the linear effects of X1 and X2, their interaction term, their squared terms and e is the error term. Table 6 presents the results of the polynomial regressions. Model 1 includes the main effects of employee participation (centralisation of authority) and CI. Model 2 includes the interaction term and the squared terms of employee participation (centralisation of authority) and CI. The beta coefficients of Model 2 are then combined to compute the surface values [1] (a1, a2, a3, and a4), indicating the linear and curvilinear slopes of the line of perfect fit and the line of perfect misfit. Surface values are tested for significance to assess whether the effects of the perfect fit or misfit are significantly related to operational performance. Surface values are used to draw the response surface plots in a three-dimensional graph (see Shanock et al., 2010 for a detailed explanation) that enables a graphical interpretation of the findings. A perfect fit is observed when there is a convex curvature along the line of the fit. That is, the level of operational performance should be higher when CI and employee participation (centralisation of authority) show the same values (e.g. CI = 1 and employee participation = 1). A perfect misfit is observed when there is a concave curvature along the line of misfit. In our study, Figure 1 depicts the response surface for CI and employee participation. It shows that operational performance increases when CI and employee participation are congruent (line of fit is higher towards the back corner of the graph and lower at the front corner), whereas performance decreases as the discrepancy between CI and employee participation increases. The surface test values confirmed that the CI–employee participation fit is positively associated with performance (a1 = 1.81 is positive and significant at p < 0.10 and a2 is not significant indicating there is a linear – not quadratic – relationship between the variables), and that CI-employee participation misfit is negatively associated with performance (a3 = −2.08 and a4 = −5.57 are both negative and significant at p < 0.05). Figure 2 depicts the response surface for CI and centralisation of authority. It shows that operational performance increases when the discrepancy between CI and centralisation of authority increases (line of misfit is higher towards the right corner of the graph and lower at the left corner), whereas performance is lower when there is a fit between CI and centralisation of authority. The surface test values confirm that the CI–centralisation of authority misfit is positively and significantly related to operational performance (a3 = 2.10 and a4 = 3.48 are both positive and significant at p < 0.10). Overall, these results further indicate that the fit between CI and employee participation and the misfit between CI and centralisation of authority increase performance.
Polynomial regression analyses
| Operational performance | ||||
|---|---|---|---|---|
| Model 1 | Model 2 | Model 3 | Model 4 | |
| CI | −0.372* | 0.728* | −0.131 | 0.999 |
| Employee participation | 2.549*** | 1.944*** | ||
| Centralisation of authority | −1.013* | −1.098 | ||
| CI2 | −0.131** | 1.109 | ||
| Employee participation2 | −1.755* | |||
| CI*employee participation | 3.682** | |||
| Centralisation of authority2 | −0.191** | |||
| CI*centralisation of authority | −2.564* | |||
| Size | −0.0693 | −0.0427 | −0.137 | −0.174 |
| Age | 0.001 | 0.000 | 0.003 | 0.003 |
| (constant) | −0.179 | −0.123 | −0.520 | −0.590 |
| R-squared | 0.053 | 0.017 | 0.089 | 0.048 |
| Adj R-squared | 0.036 | 0.000 | 0.061 | 0.019 |
| Observations | 240 | |||
Note(s): ***p < 0.01, **p < 0.05, *p < 0.1
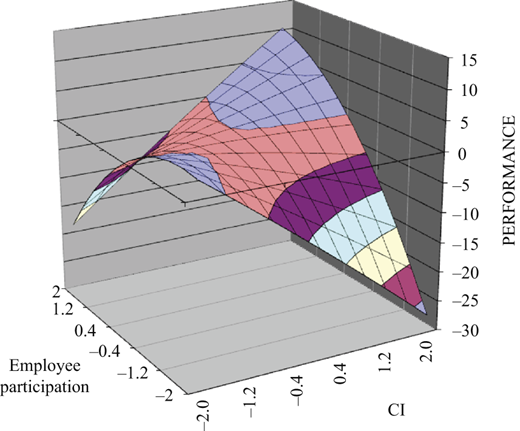
Response surface graph depicting CI, employee participation and operational performance
Response surface graph depicting CI, employee participation and operational performance
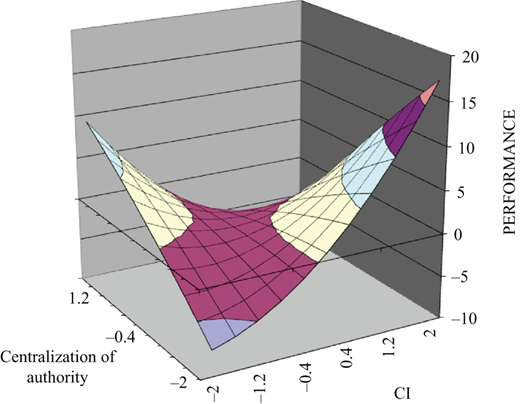
Response surface graph depicting CI, centralisation of authority and operational performance
Response surface graph depicting CI, centralisation of authority and operational performance
5. Discussion
Our research draws on the theoretical concept of organisational fit to provide a better understanding of the role of employees and managers in the dynamics of successful CI initiatives. We find that the fit between CI and employee participation is positively associated with operational performance, whereas the fit between CI and centralisation of authority is negatively associated with operational performance. Altogether, these results provide both theoretical and practical implications.
5.1 Theoretical implications
Our paper contributes to the CI literature. Many studies assume that an organisational context that invests in the involvement, participation and autonomy of employees is a fundamental prerequisite prior to starting the CI journey (Lok et al., 2005; Sila, 2007; Galeazzo et al., 2017; Ma et al., 2019). We challenge this assumption by finding that the role of employees should mutually evolve with CI. Previous studies do not give enough consideration to the fact that the infrastructure supporting CI needs to co-evolve as the firm moves along the learning process.
In particular, when CI is still at the outset, managers play a key role since their decisions are the backbone for improvement projects that lead to better outcomes. Employees, instead, have a marginal role in improvement initiatives, given the limited use of employee participation practices and their scarce involvement in the decision-making processes. As the firm becomes more familiar with CI, the roles of managers and employees should evolve to respond to the changing needs of the CI initiatives by adopting a bottom-up management approach and employee participation practices that allow employees to have a central role in CI.
Our paper also extends the literature on CI as a socio-technical system through the incorporation of its dynamic nature. Historically, research has mainly concentrated on the technical perspective of CI by focussing on the implementation of specific practices and techniques such as JIT (just in time), TQM, six sigma and TPM (total preventive maintenance) (Sakakibara et al., 1993). Recent studies have mainly concentrated on the social perspective of CI by showing the importance of soft practices that empower employees and foster their commitment (Netland, 2016; Galeazzo et al., 2017; Bortolotti et al., 2018). Our findings suggest that, given its dynamic nature, equal consideration should be placed on both the technical and social aspects of CI as they are closely intertwined and any decision on the social side should be gauged against the technical side and vice versa.
Moreover, our paper contributes to the literature on organisational routines. Routines are multi-actor, recurrent patterns of actions (Feldman and Pentland, 2003). Routines emerge through social interactions among the actors of an organisation. Through repetition, they become stable, but stability does not indicate they are static. They evolve and adapt every time the actions are repeated based on how actors understand and perform their part of the routine (Feldman and Pentland, 2003). Although past research has widely explored the actions involved in routines (Feldman et al., 2016), there is less attention on the social interactions among the actors involved in routines (Howard-Grenville, 2005; Sargis-Roussel et al., 2017) and even much less attention on when routines evolution becomes successful (i.e. it brings higher results) (Brauer and Laamanen, 2014). By framing CI as a set of organisational routines (PM, LI and IO), our findings highlight that social interactions evolve in congruence with routines evolution, and such congruence leads to successful outputs. In line with research arguing that high-status members influence routine formation (Feldman and Pentland, 2003; Loch et al., 2013), we concur that managers play an important role, and we extend this research by finding how and when managers use their high-status power. In particular, they leverage their authority to foster all actors to align and perform congruent actions; however, such authority can only be used when a new routine emerges. As actors are more involved in the routine, the use of authority would lead to unsuccessful routines as, presumably, it depauperates routines from their source of variation, losing their ability to be flexible and adapt continuously. Thus, managers should use their high-status to enable employees to embed changes in routines while performing them.
Lastly, our paper expands the operations management literature that draws on organisational fit to explore the relationship among internal practices ( Appendix 1). Our contribution lies on two main arguments. First, we focus on the scarcely investigated ( Appendix 1; Tallon and Pinsonneault, 2011; Danese et al., 2020) “fit as matching” perspective identified by Venkatraman (1989). According to Venkatraman (1989), there are six perspectives of fit: fit as moderation, fit as mediation, fit as matching, fit as gestalts, fit as profile deviation and fit as covariation (see Appendix 1 for a definition of the fit perspectives). In our study, organisational fit corresponds to the “fit as matching” type because our objective is to investigate how performances are minimised or maximised when there is a small or large difference in magnitude of the internal practices (CI, employee participation and centralisation of authority). Second, compared to previous studies that only focus on the concept of organisational fit, we argue that the misfit concept is equally important and, when both fit and misfit are addressed, a stronger theoretical argument and a more thorough knowledge of the investigated phenomenon can be built.
5.2 Managerial implications
The study also provides valuable insights for managers.
Our findings suggest that managers should continuously modify the organisational context as the company progresses on the CI learning process. Managers should avoid taking an “either/or” view of the organisational context and CI. They are encouraged to make decisions on both contextual-related and CI-related issues. Specifically, they should gradually increase employee participation and gradually decentralise authority to employees as the firm incorporates new routine changes as an effect of CI. This implies that managers must manage a complex equilibrium between top-down and bottom-up management approaches, high and low levels of employee participation, and different levels of CI maturity.
The management of such a complex equilibrium requires the adoption of a contextual, rather than one-fits-all, approach to the implementation of the internal practices of CI, employee participation and centralisation of authority. Taking this contextual approach, managers dynamically balance systems of practices that co-evolve as the organisation matures along its CI journey.
Our overall findings on the CI–employee participation fit and the CI–centralisation of authority misfit indicate that such a contextual implementation needs to take into consideration the trade-off between employee participation and centralisation of authority, that is, there should be low (high) employee participation and high (low) centralisation of authority when CI is low (high).
Specifically, managers are encouraged to alternatively use a top-down and bottom-up approach along the CI journey. When CI is scarcely implemented in a firm, managers should use a top-down approach as the advantages of the centralisation of authority in terms of alignment of vision, stability and sense of predictability emerge. When CI moves towards a higher level of maturity in the firm, managers should use a bottom-up approach with employees. This implies the use of practices encouraging employees' participation in the improvements' decision-making process. Higher levels of CI indicate that employees have developed an IO (IO routine) and embraced new ways of doing things (PM routine). To gain the advantages of employees' new mindset and actions, managers should allow employees to take an active part in the improvement process and deploy a series of practices that foster employee participation.
Lastly, our findings warn managers on focussing attention on practices supporting employees' participation and autonomy before starting CI initiatives. Too much focus on employees-centric practices when a firm has only scarcely invested in CI could be wasteful. This is because, although they are allowed to make suggestions and adopt decisions autonomously or in teamwork, employees still lack an IO and a thorough understanding of how procedures and tools should be used effectively in problem-solving and searching for improvement opportunities. Therefore, the risk is to expect employees to foster a new course of action for improvement without considering they are still accustomed to the old way of doing things when no attention for incremental improvements was present.
6. Conclusion, limitations and future research
This research draws on the “fit as matching” perspective to study whether different levels of implementation of CI initiatives require different levels of employee participation and centralisation of authority. The “fit as matching” perspective is operationalised as the absolute difference between two variables. Linear regression analyses and polynomial regression analyses with response surface methodology highlight that the fit between CI and employee participation is positively associated with operational performance and that the fit between CI and centralisation of authority is negatively associated with operational performance. This implies that firms should not pursue the development of practices fostering employee participation in isolation, but these practices need to be aligned with the level of CI. Moreover, a firm with a limited level of CI is more likely to have superior performance when authority is centralised, which needs to be reduced as a firm evolves towards higher levels of CI. All in all, the use of organisational fit highlights the manager's role in adopting a contextual approach to dynamically balance systems of practices as CI progresses.
The present paper has several limitations that future research should investigate. First, CI's scope is not limited to the three bundles of routines that we included based on Peng et al. (2008). CI is a more complex dynamic capability that combines routines associated with stability, just-in-time, and cleanliness, to name a few. Although the scales of CI and its sub-dimensions are acceptable following Fornell and Lorcker's (1981) recommendations, future research might include additional routines and, thus, refine this construct (Little et al., 1999). Second, employee participation was measured using two bundles of human-related practices: employees' suggestions and teamwork for problem-solving. Future research could investigate additional practices to provide a more in-depth understanding of the dynamics between an organisational context supporting employee participation and CI. Third, the study investigated the role of managers as key agents in developing successful CI using the centralisation of authority construct. Although the centralisation of authority captures managers' ability to control the decision-making processes at different CI levels, the role of managers may be investigated from other perspectives. For example, from an organisational perspective, flat vs mechanistic organisational structures may inform managers about the chain of command that better fits the CI levels. Future studies should explore how the fit between CI and other dimensions of a top-down management approach affects performance. Finally, the present study sample was limited to the electronics, machinery and transportation industries that mostly use production processes such as assembly lines/dedicated flow lines that are characterised by high volume and low variety of outputs. As the previous literature (Jayaram et al., 2010) shows that the characteristics of the production processes may influence top managers' decision-making processes and organisational performance, future research should further test our theoretical model in other manufacturing industries, including service industries.
| Source | Theoretical focus | Fit variables | Outcome | Fit perspectivea | Statistical methods |
|---|---|---|---|---|---|
| MacDuffie (1995) | Internal practices | Use of buffers, work systems and human resource management (HRM) policies | Productivity and quality | Moderation | Linear regression analysis |
| Selto et al. (1995) | Internal practices/organisational characteristics | Lean practices and (1) organisational design, (2) organisational structure, (3) management control processes | Job satisfaction and workgroup effectiveness | Profile deviation matching; moderation | Linear regression analysis |
| Hong and Kim (2002) | Internal practices | The development of enterprise resource planning (ERP) systems and different implementation contingencies (ERP adaptation, process adaptation, organisational resistance) | ERP implementation success | Moderation | Linear regression analysis |
| Khazanchi et al. (2007) | Internal practices/organisational characteristics | Value profiles of managers and operators | Plant performance | Matching | Linear regression analysis and polynomial regression analysis with response surface methodology |
| Jimenez-Jimenez and Martinez-Costa (2009) | Internal practices | Quality-oriented HRM practices | Firm performance | Profile deviation | Structural equation model |
| Kroes and Ghosh (2010) | Internal practices/strategy | A firm's outsourcing drivers and its competitive priorities | Supply chain performance and business performance | Moderation | Structural equation model |
| Patel et al. (2012) | Internal capabilities/strategy | Exploration and exploitation to measure operational ambidexterity | Firm growth | Matching | Latent moderated structural (LMS) equation |
| Zhang et al. (2012) | Internal practices/external environment | Quality exploration, quality exploitation, organisational structure, environmental uncertainty | Operational performance | Moderation | Linear regression analysis with subgroup analysis |
| Kristensen and Israelsen (2014) | Internal practices | Output control forms, behavioural control forms and social controls in the lean context | Financial and operational performance | Profile deviation | Linear regression analysis |
| Iqbal et al. (2020) | Internal practices | Lean practices, agile manufacturing, management practices and infrastructural characteristics | Firm performance | Covariation | Covariance-based structural equation model |
| Yu et al. (2020) | Internal practices | Innovativeness and lean practices | Triple bottom line performance | Mediation; moderation | Structural equation models and linear regression analysis |
| Mas-Machuca et al. (2021) | Internal practices | Quality management, knowledge management, values and values fit | Perceived organisational effectiveness | Gestalts | Fuzzy-set qualitative comparative analysis (QCA) |
Note(s): aVenkatraman (1989) identified six fit perspectives. “Fit as moderation” refers to the existence of a variable that interacts with a predictor variable to impact a criterion variable; “fit as mediation” implies the existence of an intervening variable linking an antecedent variable to a consequent variable; “fit as matching” refers to the existence of a theoretical match between two related variables; “fit as gestalts” refers to the degree of coherence among a set of different variables and it is measured using cluster analysis; “fit as profile deviation” refers to the deviation from a theoretically defined ideal fit; “fit as covariation” implies the existence of an internal consistency among a set of related variables and it is measured using a second-order construct
The authors thank Torbjørn Netland and Gopesh Anand for invaluable insights. The authors also thank the editor and two anonymous reviewers for their encouragement and helpful comments.
Notes
The surface value a1 = gives the slope of the line of perfect fit (CI = employee participation; CI = centralisation of authority). The surface value a2 = gives the curvature of the line of perfect fit. The surface value a3 = gives the slope of the line of perfect misfit (CI = employee participation; CI = centralisation of authority) and a4 = gives the curvature of the line of perfect misfit.
The performance dimensions of cost and quality have Cronbach's alphas slightly below the cut-off value. Cronbach's alphas generally underestimate the true reliability of the construct. Moreover, they are sensitive to the number of items in the construct so that a construct with few items could show low values. Composite reliability is an alternative measure of reliability and, as shown in Table A1, composite reliability of both cost and quality are above the cut-off values. This implies that the measures of cost and quality are reliable.
References
Appendix 1
Appendix 2
Operational performance
OPERATIONAL PERFORMANCE = W1*COST + W2*QUALITY + W3*DELIVERY + W4*FLEXIBILITY
Where W1, W2, W3 and W4 are weights assessing the relative importance of each performance subdimension. The weights are based on a question asking plant managers (questionnaire area: plant management) to indicate the importance of the following goals for their company in its primary market based on a five-point Likert scale (1: Least important, 3: Neutral, 5: Absolutely crucial):
low price (C);
high performance quality (Q);
fast delivery (D);
ability to rapidly change over products on short notice (F).
The relative importance given to each goal is then used to compute the weights as follows:
W1 = C/(C + Q + D + F) (weight for cost performance)
W2 = Q/(C + Q + D + F) (weight for quality performance)
W3 = D/(C + Q + D + F) (weight for delivery performance)
W4 = F/(C + Q + D + F) (weight for flexibility performance)
And cost, quality, delivery and flexibility are the performance subdimensions assessed by asking plant managers to indicate their opinion about how their plant compares to its competitors in its industry, on a global basis, using a five-point Likert scale (1: Poor, much worse than global competitors, 3: Average, 5: Superior, much better than global competitors). Table A1 shows factor loadings, Cronbach's alpha and CR for each performance subdimension. They are all above the recommended cut-off values [2], 0.5, 0.7 and 0.6, respectively (Hair et al., 2006). The CFA performed on the four sets of subdimensions shows good fit (χ2/df = 2.90, CFI = 0.94, TLI = 0.92, RMSEA = 0.07). Overall, the four performance subdimensions represent reliable and valid measures of the respective constructs.
Operational performance dimensions, items description, factor loadings, Cronbach's alphas and CR
| Dimension | Items | Factor loadings | Cronbach's alpha | CR |
|---|---|---|---|---|
| Cost | Unit cost of manufacturing | 0.62 | 0.66 | 0.75 |
| Inventory turnover | 0.85 | |||
| Cycle time (from raw materials to delivery) | 0.84 | |||
| Quality | Conformance to product specifications | 0.86 | 0.65 | 0.71 |
| Product capability and performance | 0.86 | |||
| Delivery | On time delivery performance | 0.90 | 0.78 | 0.76 |
| Fast delivery | 0.90 | |||
| Flexibility | Flexibility to change product mix | 0.89 | 0.74 | 0.78 |
| Flexibility to change the volume | 0.89 |
