Introducing additive manufacturing (AM) in a multinational corporation with a global spare parts operation requires tools for a dynamic supplier selection, considering both cost and delivery performance. In the switchover to AM from conventional manufacturing, the objective of this study is to find situations and ways to improve the spare parts service to end customers.
In this explorative study, the authors develop a procedure – in collaboration with the spare parts operations managers of a case company – for dynamic operational decision-making for the selection of spare parts supply from multiple suppliers. The authors' design proposition is based on a field experiment for the procurement and delivery of 36 problematic spare parts.
The practice intervention verified the intended outcomes of increased cost and delivery performance, yielding improved customer service through a switchover to AM according to situational context. The successful operational integration of dynamic additive and static conventional supply was triggered by the generative mechanisms of highly interactive model-based supplier relationships and insignificant transaction costs.
The dynamic decision-making proposal extends the product-specific make-to-order practice to the general-purpose build-to-model that selects the mode of supply and supplier for individual spare parts at an operational level through model-based interactions with AM suppliers. The successful outcome of the experiment prompted the case company to begin the introduction of AM into the company's spare parts supply chain.
1. Introduction
Additive manufacturing (AM), colloquially known as 3D printing in a non-technical context, is a novel general-purpose digital technology (Hedenstierna et al., 2019) that allows for the production of parts from 3D model data (ISO/ASTM 52900, 2021). These data can be electronically transferred (Friesike et al., 2019) close to the point of need (Khajavi et al., 2014) to multiple suppliers simultaneously (Eyers and Potter, 2015), without incurring significant transaction costs (Grover and Malhotra, 2003). As opposed to subtractive or formative modes of manufacturing, AM constitutes a part-specific tool-less mode (Eyers et al., 2018) that joins materials to create parts with unprecedented level of geometric freedom (Kumke et al., 2018) in one build cycle — enabling mass customization and personalization — using minimal asset-specific setups (Petrovic et al., 2011).
Due to this inherent flexibility potential, practitioners and academics are increasingly developing new modes of supply and management of additively manufactured parts (Asokan et al., 2022; Chaudhuri et al., 2021b; Frandsen et al., 2020; Friesike et al., 2019; Hedenstierna et al., 2019; Holmström et al., 2019), particularly for the provision of spares, amounting to digital spare parts (Salmi et al., 2018) within the industrial landscape (Chaudhuri et al., 2021a; Heinen and Hoberg, 2019; Holmström et al., 2010; Khajavi et al., 2014).
In conventional manufacturing, the selection of suitable parts suppliers that meet the required criteria (Dickson, 1966; Ishak and Wijaya, 2020), particularly production-engineering expertise, materials, part-specific tooling, cost, and delivery, is a considerable investment. This selection is rarely revisited or changed before production ramp-down (Frandsen et al., 2020; Ulrich and Eppinger, 2012) owing to substantial transaction cost constructs, which are asset specificity, uncertainty, and governance mechanisms (Grover and Malhotra, 2003; Williamson, 2008).
After production ramp-down, the future provision of spare parts becomes an issue because there are usually many different parts, each with very low and intermittent demand. The suppliers are reluctant to stock these parts due to the low volume of demand, leaving an original equipment manufacturer (OEM) company to either hold safety stock or make-to-order (Huiskonen, 2001; Knofius et al., 2016; Regattieri et al., 2005). This can result in significant costs for the OEM adding up to millions of euros for supporting equipment in the later stages of the product life-cycle (Behfard et al., 2015). Considering multi-criteria (Rezaei, 2018), multi-item (Kilic, 2013), and multi-sourcing (Aktar Demirtas and Ustun, 2009) simultaneously, a supplier selection problem can become tedious to solve (Ayhan and Kilic, 2015), particularly when considering the differences in transaction costs for a myriad of individual spare parts.
Many OEM companies perceive significant potential in parts-on-demand services of AM (Oettmeier and Hofmann, 2016) for the supply of spare parts (Kretzschmar et al., 2018), and are encouraged by design-oriented operations management researchers to initiate the exploratory process of introducing AM (Chekurov et al., 2018; Heinen and Hoberg, 2019). At a strategic level, Salmi et al. (2018) investigate the spare parts portfolios of two case companies, consisting of 198,638 and 17,182 parts respectively, and find that 6% can be switched over to AM. Similarly, Heinen and Hoberg (2019) indicate that 2% of total units supplied can potentially switch over to AM from 53,457 portfolio parts. Though scarcely reported (Frandsen et al., 2020), there is an emerging body of literature on the selection of AM-based switchover parts from large spare part portfolios that can distinctly be based on expert-driven (Lindemann et al., 2015; Simkin and Wang, 2014) and data-driven (Chaudhuri et al., 2021a; Heinen and Hoberg, 2019) approaches. However, to date no reports have been found in the literature on the operational assessment and practice considering the procurement of the identified individual parts from multiple AM service providers.
To this end, the objective of this study is to investigate how companies can profit from dynamic decision-making for supplier selection designed for the provision of individual spare parts through a multi-objective operational switchover practice that alternates between multiple additive suppliers and static conventional supply. The solution extends static and product-specific make-to-order (Gosling et al., 2017; Ben Naylor et al., 1999) to dynamic and general-purpose manufacturing of spare parts in a build-to-model (Hedenstierna et al., 2019) mode. Parts are made to order only (Wagner et al., 2003), and supplier selection occurs dynamically from currently available AM service providers. As opposed to the make-to-order mode, the build-to-model mode activates general-purpose supply chains which do not require the need to commit to a fixed design and shape for each spare part (Williamson, 2008). Table 1 describes the key concepts in this study for which we design and evaluate a proposal together with practitioners of a case company. We use a multi-method approach that combines design science, scenario development, and case study to yield empirical evidence. We contribute to theory through the creation and evaluation of a novel operational practice.
Definitions of key concepts in this study
| Concept | Description |
|---|---|
| Build-to-model | A mode of manufacturing that uses 3D model data and general-purpose manufacturing technologies to directly respond to demand reducing the transaction costs of outsourcing due to asset specificity, uncertainty, and governance structures |
| Dynamic supplier selection | A digital operational practice that chooses a supplier or multiple suppliers according to customer requirements, enabled by the low transaction costs of the build-to-model mode of manufacturing |
2. Literature review
2.1 Static supplier selection
Suppliers are an integral part of the after-sales supply chain (Chen and Paulraj, 2004) directly affecting the reliability, profitability, and cost of the OEM after-sales operations (Ahmad and Mondal, 2019). The selection of suppliers based on the objectives of a manufacturing company and capabilities of the supplier entails a significant multi-criterion decision-making process (Ahmad and Mondal, 2019; Koul and Verma, 2011; Yu et al., 2013). This major decision is generally made at a strategic level (Ishak and Wijaya, 2020) for the procurement of parts according to demand as a function of specified duration (Singh, 2015). This decision covers the life-cycle of the parts, which typically spans in decades (Knofius et al., 2016). Prior research has identified cost, lead-time, flexibility, fast response, and quality as the key factors for selecting a supplier (Chen and Paulraj, 2004; Shin et al., 2000).
Extant literature has also identified the concept of dynamic response that considers changes in supplier operations, buyer demand, and production policies owing to market dynamics as a function of periodic time to satisfy the forecasted demand (Ahmad and Mondal, 2016, 2019; Koul and Verma, 2011; Öhman et al., 2021; Ware et al., 2014). However, we argue that under the conditions of conventional manufacturing, this concept still imposes a very high degree of transaction costs (Clemons et al., 1993; Grover and Malhotra, 2003; Williamson, 1991, 2008) for changing the supplier once a supplier has been selected and a supply chain has been designed for a specific part type.
This static decision is imposed by a number of transaction costs due to the asset specificity, uncertainty, and governance structures (Clemons et al., 1993; Grover and Malhotra, 2003; Williamson, 1991, 2008), which need to be amortized through economies of scale (Schmenner and Swink, 1998). The generating mechanism of these transaction costs for conventional manufacturing is the need to commit to a fixed design and shape for each spare part.
To this end, changing the selected supplier for improvement (altering one or additional dimensions without hindering the other—Pareto optimality) or betterment (changing the operating policies) of the operational frontier (Schmenner and Swink, 1998) entails reinvesting (buying or transferring) in part-based asset specificity (Baumers and Holweg, 2019; Khajavi et al., 2015). This includes part-specific tools such as molds, jigs, fixtures, dies, etc. and part-specific production engineering expertise in tooling, setups, zero-point referencing, etc. This is caused by the bounds of asset frontier of the conventional manufacturing (Schmenner and Swink, 1998). The static supplier change increases the OEM exposure to bounded rationality, for example, when renegotiating product specifications and pricing, and opportunism (Rindfleisch and Heide, 1997) under the conditions of uncertainty and a high degree of investments in asset specificity. This leads to higher transactions costs (Grover and Malhotra, 2003). Altering the spare parts supplier or supply involves negotiation and contracting for every idiosyncratic part, invoking high transaction costs. In spare parts supply, three main transaction cost components—coordination costs, operations risk, and opportunism risk (Clemons et al., 1993) come into play. Minimizing the risks of concomitant operations, opportunism, and bounded rationality through governance structures such as monitoring and safeguarding give rise to additional transaction costs.
2.2 Dynamic supplier selection through additive manufacturing
Current operations of AM require a digital file of a 3-dimensional part that contains the necessary information for production (Gebhardt, 2011; ISO/ASTM 52900, 2021; Weller et al., 2015). The production of additional parts with different design and shape is made possible by simply uploading additional digital files into the build volume (Baumers and Holweg, 2019) of an AM machine (Weller et al., 2015).
With the elimination of part-based tool and operator specificity (Grover and Malhotra, 2003), the general-purpose AM process inherits significantly decreased transaction costs for altering both the supplier and the supply of spare parts. This can shift the performance frontier towards improvement and betterment until a part-specific switchover. After this, conventional part-based asset-specificity gains advantage through economies of scale with higher volumes enabled by swift and even flow (Schmenner and Swink, 1998). The performance frontier denotes the maximum performance (limited to asset frontier) that a manufacturing technology can achieve with specific set of operating choices. The part-specific switchover is a decision to change the manufacturing technology based on the available suppliers and the customer requirements for each specific spare part. If a customer requires a spare part in high quantity, conventional technology remains the better choice. However, if a customer needs a spare part urgently in low quantity, a switchover to AM can shift the performance frontier. Considering the alternating customer requirements and available suppliers, dynamic decision-making tools are required to determine whether to supply through new general-purpose AM or old part-specific conventional manufacturing. Without part-based asset-specific investments, an OEM company reduces the risk concomitant to opportunism.
Digitization enables swift electronic transfer of spare parts — digital spare parts (Chekurov et al., 2018; Kretzschmar et al., 2018; Metsä-Kortelainen et al., 2020; Salmi et al., 2018) — that could potentially be remitted to multiple AM suppliers concurrently (Eyers and Potter, 2015) for production close to the point of need (Khajavi et al., 2014). When applied to a global setting, this aids in cutting down transportation costs, delays, and international trade-based taxes and tariffs through distributed manufacturing (Gress and Kalafsky, 2015). Owing to the simplicity in transferability of part-based information (Jonsson and Holmström, 2016), supplier-based part problems caused by poor communication can be avoided (Newman and Rhee, 1990). This minimizes the OEM exposure to transaction costs due to bounded rationality and the need for excessive co-ordination.
This agglomeration of general-purpose characteristics of AM enables a build-to-model mode of operations, where a supplier is selected close to the time of production. The reduction of transaction costs present in conventional manufacturing due to uncertainty (e.g. intermittent demand, variable volume, etc.), setup costs, sharing part specifications, and other part-based asset-specificity (e.g. fixtures and tools) allow for on-demand production (Oettmeier and Hofmann, 2016). Though general-purpose characteristics of AM limit risks of bounded rationality and excessive co-ordination to an extent, a risk of opportunistic behavior in counterfeiting parts remains (Hedenstierna et al., 2019). In outsourcing literature, this is mitigated through mutual investments in performance-boosting operational practices and contractual precautionary measures (Tsay et al., 2018).
2.3 Spare parts inventory
The main purpose of spare parts inventories is to ensure continuous operations of equipment through maintenance at low costs (Roda et al., 2014). A spare parts inventory is inherently differentiated due to the high uncertainty in number of orders and part quantities, uncertain probability distribution of some part failures, large number of different spare parts portfolios increasing the difficulty to control, alternative suppliers providing a specific part, obsolescence risk, uncertain procurement lead-times, and poor availability of information needed for the spare parts inventory management process (Bergman et al., 2017; Cavalieri et al., 2008; Frandsen et al., 2020; Kennedy et al., 2002; Knofius et al., 2016; Roda et al., 2014).
Given these inherent circumstances, the managerial challenge is to find a balance between the two extremes of high downtime costs of equipment due to inventory stock-outs for spare parts, and the accumulation of obsolete inventory of spare parts, no longer needed to prevent equipment downtime (Braglia et al., 2004; Cavalieri et al., 2008; Frandsen et al., 2020; Suomala et al., 2002; Van Wingerden et al., 2014). Extant literature has proposed various modes of manufacturing to optimize the provision of spare parts (Frandsen et al., 2020; Huiskonen, 2001), which are ship-to-stock (Ben Naylor et al., 1999), make-to-stock, assemble-to-order, and make-to-order (Hoekstra and Romme, 1992; Wemmerlöv, 1984). Each mode differs in penetration of customer order decoupling point from forecast-based to demand-based operations. The customer-order decoupling point steers the customer involvement or the extent of customization in the operational setting (Gosling et al., 2017).
The challenge is further amplified in case of low volume (e.g. 0–2 sales units/year) parts, particularly the ones with high complexity and value since it is difficult to decide whether they should be held in an inventory (Suomala et al., 2002). Typically, there is a minimum order quantity (Hadar, 2018; Heinen and Hoberg, 2019), which may impede the customer-relationship. Holding parts may induce additional inventory costs for slow movers (Gelders and van Looy, 1978) or parts that may become obsolete (Braglia et al., 2004).
In contrast to stock-based modes (forecast- and yield-based), make-to-order allows for a direct response to demand with the highest degree of interface between the company and customer (Gosling et al., 2017; Wemmerlöv, 1984). This is typically implemented to respond to problematic parts, which are bespoke parts with intermittent demand, low volumes, high specificity, and high value (Huiskonen, 2001). If the lead-time is not sufficient to tolerate equipment downtime caused by a part failure, holding a safety stock (Knofius et al., 2016; Walter et al., 2004) becomes of paramount importance. In this case, make-to-order replenishes the safety stock whenever the problematic parts are called out for maintenance. However, make-to-order is demarcated to supply chains that are designed for specific parts with distinct design and shapes requiring minimum order quantities and relatively longer lead-times (Gosling et al., 2017; Huiskonen, 2001; Wemmerlöv, 1984). This creates a situation where inventories can become costly, and replenishment may be unreliable to accommodate the high variability in demand due to the high transaction costs inherited by conventional manufacturing. To this end, if the build-to-model mode can reduce lead-times without substantial cost penalties, an opportunity exists to eliminate the expensive safety stock altogether (Huiskonen, 2001; Knofius et al., 2016; Walter et al., 2004) and respond better to variability in demand.
3. Methodology
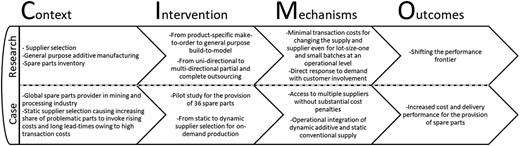
To achieve the aim of innovation, theoretical insights, and practical relevance (Denyer et al., 2008), this study adopts a design science approach (Holmström et al., 2009). The design research combines methods from exploratory case study (Yin, 2018) in organizing the collaboration of researchers with practitioners of a case company for the design and evaluation of a solution for AM switchover and the dynamic selection of suppliers. Identical to Groop et al. (2017) and Hedenstierna et al. (2019), the work uses a multi-method approach (Mingers and Brocklesby, 1997) that combines design science, case study, and scenario development. However, in contrast to the study conducted by Hedenstierna et al. (2019), we also implement the design proposal and evaluate the outcome of our proposal in the field for the provision of 36 individual spare parts. To structure the design research and the development of actionable and prescriptive knowledge, we follow the “Context, Intervention, Mechanisms, Outcomes” (CIMO) framework (Denyer et al., 2008). Figure 1 shows the problem embedded in the CIMO framework, which outlines our combination of an innovative operational practice, operational theory, field expertise, and problem context.
The data used for this study were collected over the duration of a two-year academic research project in which the authors worked in close co-operation with the vice president, the sales manager, and the service business development manager of the case company. The study comprised of 16 meetings — ten were held at the case company headquarters and six were held at university premises. Each meeting was 2 h long. As a minimum, three authors and the business development manager participated in the meetings. The meetings included presentations, semi-structured interviews, open-ended interviews, and discussions of the analyses. Quantitative and qualitative data regarding the conventional practices of the case company were shared electronically. The data included spare part drawings, 3D models, technical, mechanical, and operational attributes, analyses, and results.
In our field experiment, we used the expert-driven approach (Frandsen et al., 2020; Lindemann et al., 2015; Simkin and Wang, 2014) to pre-screen the problematic spare parts from a large case company portfolio and to consider the experiences of the service and maintenance staff at a very early phase. We used Creo Parametric (3.0, PTC, Needham, MA, USA) software to re-engineer the spare parts that lacked the required data, which are 3D models of the parts (11 parts) and tools (7 molds) to produce the parts.
Owing to the emerging nature of AM, we selected seven AM suppliers based on their experience, global operations, and ability to provide direct (single-step process), indirect (multi-step process), and rapid tooling services (ISO/ASTM 52900, 2021). The majority of the suppliers were OEM companies of AM machines that also provided production on-demand. Table 2 shows the list of suppliers that provided the cost and lead-time data of the spare part candidates. These data were obtained by deploying the build-to-model mode of manufacturing in which 3D models of the spare parts were uploaded to the web-based cloud tools of the suppliers for a dynamic retrieval of cost and lead-time for each specific spare part in identical batch sizes of conventionally manufactured parts of the case company. Due to the developing nature of this manufacturing mode, a few suppliers were contacted via E-mail to retrieve the cost and lead-time data for metal parts and small series production (Huang et al., 2021; Salmi et al., 2016).
Cost and lead-time data received from AM suppliers as a function of AM application and process
| Description | AM cost and lead-time data source | ||
|---|---|---|---|
| AM supplier | End-use | Rapid tooling | |
| Direct (single-step) | Indirect (multi-step) | ||
| 3D Systems: Quickparts | ✓ | ✗ | ✓ |
| ExOne: Karlebo | ✗ | ✗ | ✓ |
| iMaterialise | ✓ | ✓ | ✗ |
| Protolabs | ✓ | ✗ | ✗ |
| Shapeways | ✓ | ✓ | ✓ |
| Stratasys | ✓ | ✗ | ✓ |
| Voxeljet: Hetitec | ✗ | ✗ | ✓ |
4. Case study
4.1 Problem in context
The case company operates globally in spare parts services for mining and processing equipment with long life-cycles. The environment is harsh and demanding (Ahmad and Mondal, 2019; Kumar and Kumar, 2004). Due to an increase in competition and demand brought upon by globalization (Lindemann et al., 2015), sizes and technological complexities of mining and processing equipment have grown over the past decades, contributing to high and increasing maintenance costs (Díaz and Fu, 1997; Kumar and Kumar, 2004). Further, the remote location of the case company in the Nordic region, serving customers through service centers in 36 countries on six continents creates a challenging setting for ensuring the availability of spare parts across its global operations (Ahmad and Mondal, 2019; Kumar and Kumar, 2004).
The current spare parts operations of the case company seek benefits of economies of scale and swift and even flow (Schmenner and Swink, 1998) by seeking to centralize operations. However, increasing inventory holding costs of the case company for supporting aging global equipment installation bases, particularly concerning problematic spare parts (i.e. parts with intermittent demand, low volumes, high specificity, and potential to cause downtime of equipment), have imposed a shift from its stock-based mode of manufacturing to make-to-order. To safeguard its customer-relationships, the case company took responsibility of availability and control of spare parts instead of shifting the increasing costs of the minimum order quantity from its suppliers to its customers.
Owing to the growing share of problematic spare parts relying on the make-to-order mode, the case company was forced to design and maintain the supply chain for each specific part with distinct design and shape including investments in part-specific tools and expertise. To this end, it confronted increasing costs and long lead-times (Gosling et al., 2017; Huiskonen, 2001; Wemmerlöv, 1984) that created a situation where order fulfillment became unreliable and incapable of accommodating the variability in demand from customers. In this study, the lead-time of spare parts ranged from two to six weeks. It extended up to 20 weeks when including the lead-time of relative molds. The case company had shifted to in-house production of spare parts for nearly all part candidates that were manufactured through subtractive manufacturing to minimize the impact of transaction costs, such as coordination costs, operations, and opportunism risk (Clemons et al., 1993). All part candidates produced via injection molding were outsourced to avoid heavy internal asset-specific investments.
4.2 Operational dynamic decision-making intervention design
Our design is based on the development of dynamic provision of 36 problematic spare parts. These parts included individual parts (16 parts) and sub-assemblies (20 parts) as one spare part kit (7 assemblies) that the case company offered to its customers. Table 3 lists and describes key attributes in the context of a potential switchover to AM that emerged during the collaboration with the case company representatives.
Key attributes of spare part candidates for the dynamic decision-making practice
| Spare parts attributes | Description | Data source | |
|---|---|---|---|
| Part number | The part number is used to identify the part and request information from different IT systems consisting of a large portfolio of spare parts | DWG-code and SAP-code provided by the case company | |
| Preview | An image of the spare part that assists in evaluating geometric complexity | 2D drawing or 3D model provided by the case company | |
| Year designed | This metric provides an insight on the age of the spare part. Older parts have more tendency of being over-designed for manufacturing | 2D drawing provided by the case company | |
| Format | The format is used to distinguish parts that had 2D engineering drawings and/or 3D CAD models | Spare part data provided by the case company | |
| Purpose | The purpose aids in evaluating the operating conditions of the part | Case company experts | |
| Material | The material indicates the type of material according to the relevant standards | Material standards in 2D drawing and case company experts | |
| Dimensions (L × W × H) [mm] | The dimensions indicate the length, width, and height of the part in millimeters. This describes the minimum bounding box of the part in the build volume of an AM machine | 2D drawing and/or 3D model provided by the case company | |
| Tightest tolerance [mm] | The tightest tolerance assists in the selection of AM technology which may satisfy the tolerance or restrict it to a specific interface of the part that can be post-processed or machined to achieve the correct tolerance within the prescribed range | 2D drawing provided by the case company and general dimensions and tolerances standard | |
| Overall tolerance [mm] | In contrast to the tightest tolerance, this is the highest numerical range of measurements that a dimension and/or angle has been assigned. If an AM technology is unable to achieve this tolerance, most likely all the features of the parts would need to be post-processed and machined, requiring part-specific set-ups | 2D drawing provided by the case company and general dimensions and tolerances standard | |
| Surface roughness (smoothest) [µm] | These features aid in selecting the AM technology and the post-processing steps | 2D drawing provided by the case company | |
| Parallelism [mm] | 2D drawing provided by the case company and general tolerances for features standard | ||
| Perpendicularity [mm] | |||
| Conventional manufacturing methods | Primary | Primary process describes the basic shape or form | 2D drawing, 3D model, researchers, and case company experts |
| Machining | Machining processes describe the extent of modification that is required to achieve the desired shapes or properties of parts. Multiple processes may require additional set-ups and can be labor-intensive | 2D drawing, 3D model, researchers, and case company experts | |
| Equipment/machinery [–] | The equipment or machinery aids in evaluating the environmental conditions of the part | 2D drawing and case company experts | |
| Downtime [yes/no] | The downtime describes whether a premature failure or service cycle of a part causes an interruption in the equipment operations | Case company experts | |
| Type of loading [static/variable/shock] | The type of loading aids in evaluating the mechanical loads and the potential mode of failure that the part may be subjected to during its service life. This helps in material selection for AM | Case company experts | |
| Lead-time [weeks] | The time that is required to manufacture and deliver the spare part | Case company experts | |
| Cost [EUR] | This is cost of conventionally manufacturing the spare part | Case company experts | |
| Eligibility [AM or CM] | Eligibility describes the assessment of spare part candidates whether to switch operations to AM or continue with conventional manufacturing | Researchers and case company experts | |
| Reasoning | Justifications of assessed operations | Researchers and case company experts | |
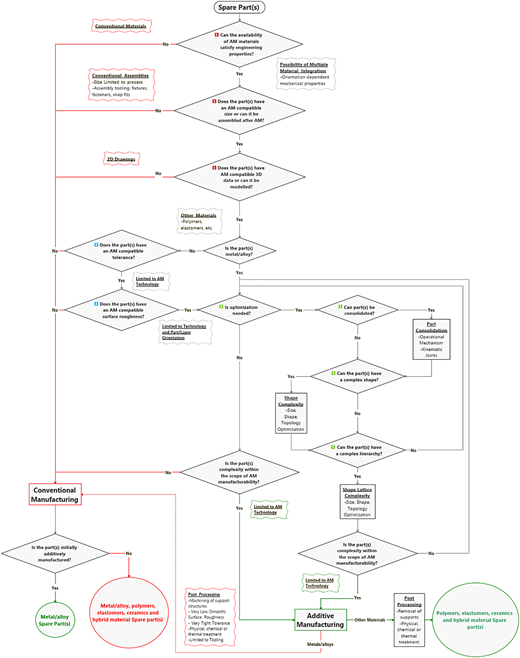
During the assessment phase of individual spare parts, the group of researchers and case company experts developed an AM eligibility flowchart algorithm ( Appendix) to evaluate the key attributes of spare parts in conjunction with AM requirements (Gebhardt, 2011; ISO/ASTM 52900, 2021; Weller et al., 2015) and potential benefits (Baumers and Holweg, 2019; Holmström et al., 2019; Kumke et al., 2018; Petrovic et al., 2011; Weller et al., 2015). This enabled a systematic process for evaluating whether operations of manufacturing a spare part can switch over to an AM supply chain. If the operations were switchable as a function of each spare part, we conducted further expert assessments in terms of geometrical, mechanical, and operational properties that could potentially have an added value for a switchover to general-purpose AM technologies using the attributes collected in Table 3. Finally, we compared the cost and lead-time data of conventionally manufactured part candidates retrieved from the case company with the cost and lead-time data of identical parts received from AM suppliers in similar batch sizes. The operational practice was conducted in two-folds — first for a static batch size and second for a variable batch size.
4.2.1 Operational decision-making design for a static batch size
First, we evaluated the operations switchover cost and lead-time savings of each subtractive manufacturing part according to Eqs (1) and (2). These parts had a static batch size of 1.
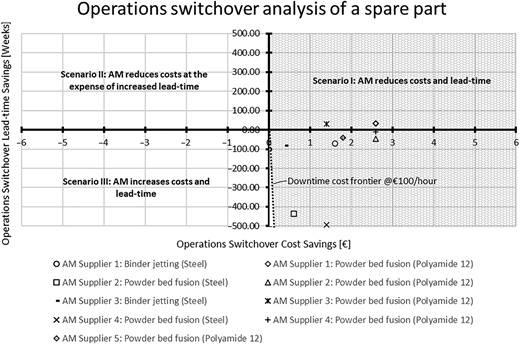
Since these savings had the potential of being positive and negative, depicting profit and loss for cost, and expedition and delay for lead-time, we plotted each metric on a positive and negative scale and developed 4 scenarios depicted by each quadrant in Figure 2.
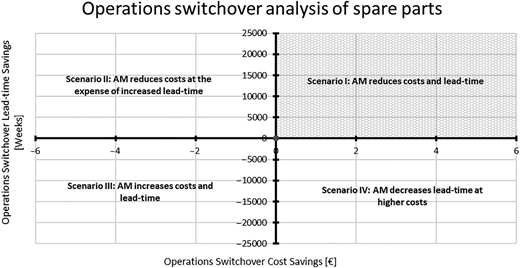
In Figure 2, the vertical axis represents operations switchover cost savings, CostSavings [€] following Eq. (1), where CostSM [€] and CostAM [€] depict the cost of subtractive and additive manufacturing of a part. Similarly, horizontal axis indicates time savings, TimeSavings [weeks] according to Eq. (2), where Lead_timeSM [weeks] and Lead_timeAM [weeks] denote the lead-time of subtractive and additive manufacturing of the part. The origin (0, 0) represents a situation where the cost and lead-time of AM are equal to subtractive manufacturing.
Evidently, the top-right hatched Scenario I of Figure 2 depicts an optimal scenario, where AM reduces the cost and lead-time of a spare part. The top-left Scenario II denotes a situation where AM reduces the cost of a spare part at the expense of increased lead-time. The bottom-left Scenario III represents a case where AM increases both cost and lead-time of a spare part. The bottom-right Scenario IV characterizes another situation where AM decreases lead-time at higher costs. The Scenario I and IV allow operations managers to exploit shorter lead-time as a function of downtime costs.
It is difficult to quantify an estimate of downtime costs related to the shortage of multiple spare parts because of the complex consequences in the whole production and process systems (Roda et al., 2014). To depict a situation where factory operations are interrupted due to a lack of availability of a spare part, we simulated a downtime cost of €100/h in Figure 3 to re-evaluate the cost performance as a function of lead-time savings. In this case, we simulated time savings for one shift (8 h) per day and five working days in a week to highlight our arguments. This downtime cost is a conservative estimate for interruption in bottleneck equipment, and represents only a fraction of the downtime cost in tens of thousands of euros per hour estimated, for example, in the semiconductor industry (Kranenburg, 2006; Van Wingerden et al., 2014). Typically, there is a line replacement unit for operations with extremely high downtime costs of bottleneck machines. The downtime cost varies as per customer operations. The introduction of downtime cost estimate maximized Scenario I through an extension until the downtime cost frontier (Figure 3), minimizing Scenario IV. The downtime cost frontier, illustrating a threshold, is plotted according to Eq. (3), where Downtime_CostSavings [€] is operations downtime cost savings, CostDowntime is equipment downtime costs [€/h] and TimeSavings [hour] is operations switchover lead-time savings according to Eq. (2):
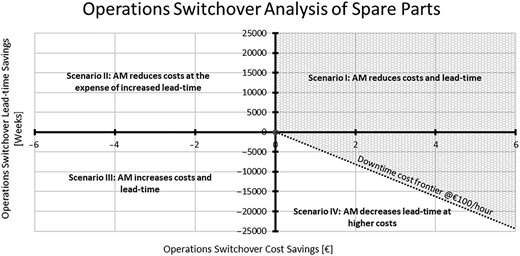
AM switchover impact diagram scenarios including an estimated downtime cost frontier that maximizes Scenario I
AM switchover impact diagram scenarios including an estimated downtime cost frontier that maximizes Scenario I
The total cost savings, Total_CostSavings [€], can be calculated according to the following Eq. (4), where CostSavings [€] is operations switchover cost savings according to Eq. (1) and Downtime_CostSavings [€] is operations downtime cost savings according to Eq. (3):
4.2.2 Operational decision-making practice for a variable batch size
Second, we determined the cost switchover point of each injection molding part as a function of multiple AM suppliers following Eqs (5) and (6) . These parts had a variable batch size ranging from a few parts to a few hundred parts. The cost model of injection molding (right-hand side of Eq. 5) was a practical model being used by the case company, which included cost per part and asset-specific costs. The cost per part is the price offered by the supplier. For injection molding, the asset-specific costs are spread over the quantity of parts. For AM, the cost per part is spread over the quantity of parts in one build volume capacity.
where:
The cost per part of AM was estimated using regression models (R-squared > 0.78; p-value < 0.05) based on the cost per part as a function of quantity of parts ranging from 1 to 500 parts received from AM suppliers.
In addition, we also evaluated the lead-time switchover point of each injection molding part as a function of multiple AM suppliers. In this case, we kept the lead-time of injection molding parts to a constant value provided by the case company because this mode was capable of manufacturing thousands of parts within only a few weeks, owing to economies of scale with swift and even flow (Schmenner and Swink, 1998). We estimated lead-time per part of AM using regression models (R-squared > 0.95; p-value < 0.05) in an identical manner to that of cost per part of AM. The switchover point was estimated based on the quantity of parts that AM suppliers could supply within the constant lead-time value of injection molding parts.
4.3 Outcomes for operational switchover
The results verified the expected outcomes for operational switchover that are increased cost and delivery performance. We eliminated 10/36 part candidates for the AM switchover following our advanced geometrical assessment as a function of potential cost and lead-time.
We demonstrate ways in which the outcomes of a static batch size were analyzed through an example part. Figure 4 shows how one of the part candidates, Bush (Table 4: Serial No. 1), benefited from our dynamic supplier selection at an operational level. A cumulative evaluation of the purpose (separating and greasing mechanism between two ball bearings), equipment (APM lug press: transfer device), and mechanical assessment of the part with the case company experts also allowed for changing the material family of this part candidate from metal to polymer. Nevertheless, we analyzed the cost and lead-time performance for both metal (steel) and polymer (polyamide 12) profiles from five AM suppliers using the build-to-model mode of manufacturing.
Outcomes of our dynamic decision-making practice
| RESULTS OF SWITCHOVER ANALYSES | |||||||||
|---|---|---|---|---|---|---|---|---|---|
| No. | Spare Part | Preview | Conventional manufacturing material profile | Dimensions: Length x Width x Height [mm] | Stock-out or failure causes equipment downtime [Yes/No] | AM Switchover Analysis | Benefit Scenario | ||
| Validity [Yes/No: Description] | |||||||||
| Without downtime impact | With downtime cost 100 €/hour | ||||||||
| Scenario I + IV: Reduced lead-time | Scenario I: Reduced costs and lead-time | Scenario I: Reduced costs and lead-time | |||||||
1 | Bush |
| Steel S355J2G3 EN 10025 | 90 x 90 x 25 | Yes | Direct metal Direct polymer Indirect metal | Yes: All switchover analyses | Yes: Direct polymer AM | Yes: All switchover analyses |
2 | Rail Fastener |
| Iron FE 510 C | 100x60x20 | No | Direct metal Direct polymer Indirect metal Rapid tooling | Yes: All switchover analyses | Yes: Direct polymer AM | - |
3 | Cutting Blade |
| Stainless steel (50-55 HRC) | 183 x 183 x 16 | Yes | Direct metal Indirect metal Rapid tooling | Yes: All switchover analyses | No | Yes: All switchover analyses |
4 | Sliding Bush |
| JM1-15 Cu85 Sn5 Pb5 Zn5 (Brass / bronze) | 70x70x100 | No | Direct metal Direct polymer Indirect metal | Yes: All switchover analyses | Yes: Direct polymer AM | - |
5 | Fork Bar |
| Steel EN 10088-3-1.4436 | 50 x 50 x 325 | No | Direct metal Indirect metal | Yes: All switchover analyses | No | - |
6 | Turbine Impeller |
| Steel EN 10088-2-1.4404 | 200x200x56 | Yes | Rapid tooling | Yes | Yes | Yes |
7 | Guide Frame |
| Steel EN 10025-2-S355J2 | 210x100x40 | No | Direct metal Direct polymer Indirect metal Rapid tooling | Yes: All switchover analyses | Yes: Direct polymer AM | - |
8 | Roll Support |
| ST52-3 DIN/EN 10025 | 420x110x40 | Yes | Direct metal Indirect metal Rapid tooling | Yes: All switchover analyses | No | Yes: All switchover analyses |
9 | Chain Wheel |
| Steel EN 10025 S235JRG2 | 345 x 345 x 20 | Yes | Rapid tooling | Yes | No | Yes |
10 | Stopper Flange Assembly |
| EN 10029 Plastic - PE Rigid + Steel EN 10025S235JR G2 | 236x236x95 | No | Direct polymer | Yes | Yes | - |
11 | Upper Shank |
| Steel S355K2G3 EN 10025 | 455x125x77 | Yes | Direct metal Indirect metal Rapid tooling | Yes: All switchover analyses | No: Reduced cost but identical lead-time for rapid tooling | Yes: Rapid tooling |
12 | Adjustable Mounting Plate |
| Steel EN 10025 S235JRG2 | 476 x 424x103 | Yes | Rapid tooling | Yes | No | Yes |
13 | Brake Flange |
| Steel S355J2G3 | 1580x1580 x 35 | Yes | Rapid tooling | Yes | No | Yes |
14 | Anode Hangbar |
| Polypropylene | 210x200x66 | No | Direct polymer maximum batch size | Yes: < 286 pcs including mold | Yes: < 125 pcs including mold | - |
Yes: < 47 pcs excluding mold | Yes: 1 pc excluding mold | ||||||||
15 | Positioning Cone |
| Polypropylene | 200x115x140 | No | Direct polymer maximum batch size | Yes: < 636 pcs including mold | Yes: < 77 pcs including mold | - |
Yes: <47 pcs excluding mold | No: Identical cost excluding mold | ||||||||


In this case, the results indicated that all AM sourcing opportunities yielded reduced lead-times because all data points were situated on the right-hand side of Figure 4, signaling a potential in making trade-offs in cost per part, lead-time per part, and downtime costs. Two data points, procured from Supplier 1 and Supplier 3 for polymer profiles, were also situated in top-right quadrant I, indicating a cost reduction of 30€ and lead-time reduction of 1.5–2.5 weeks compared to conventional mode of manufacturing. The remaining sourcing possibilities were in the bottom right quadrant IV, depicting Scenario IV in which AM decreases lead-time at higher costs without considering the impact of downtime costs.
Since this specific part candidate did cause an interruption in the case company equipment operations upon failure or stock-out, we also considered the impact of 100€/h downtime cost and re-evaluated the sourcing opportunities. In this case, the downtime cost frontier (dashed line in Figure 4) maximized Scenario I to an extent that Scenario IV was virtually eliminated at this scale, confirming that all sourcing opportunities within this region reduced cost and lead-time. Now, the potential maximum total cost savings estimated to 10,432 € (Eq. 4: 32€+|−100€/h × 2.6 weeks × 5 days × 8 h| = 10,432 €) from Supplier 1 with polymer (Polyamide 12) profile and to 6,329 € (Eq. 4: −70.21€+|−100€/h × 1.6 weeks × 5 days × 8 h| = 6,329€) from Supplier 1 with metal (Steel) profile.
Further, we also explain how the outcomes of a variable batch size were analyzed to yield maximum switchover quantities through an example part. Figure 5 shows ways in which the operations of one of the injection molding part candidates, Hangbar (Table 4: Serial No. 14), benefited from our dynamic supplier selection. In this case, all four suppliers used the powder bed fusion technology with polyamide 12 material profile, which satisfied the geometrical and mechanical requirements of the case company according to purpose (Anode insulator), equipment (Anode hangerbar), and tolerance (±0.3 mm) attributes of the part candidate.
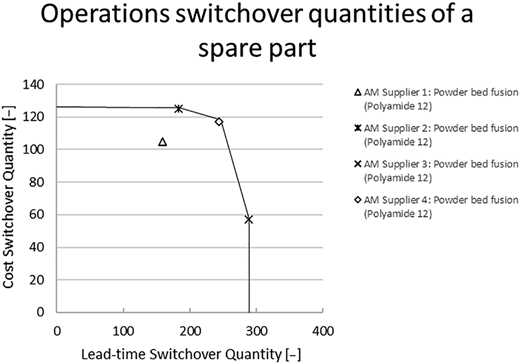
Operations switchover impact diagram illustrating the AM supplier performance frontier for maximum quantities achievable through dynamic supplier selection
Operations switchover impact diagram illustrating the AM supplier performance frontier for maximum quantities achievable through dynamic supplier selection
The results indicated that all AM suppliers could supply 56 (N−1 = 57−1 = 56) Hangbar parts with reduced cost because the cost switchover quantity for each AM supplier is greater than 56 Hangbar parts, as shown in Figure 5. Similarly, all AM suppliers could supply 158 (N−1 = 159−1 = 158) Hangbar parts with reduced lead-time because the lead-time switchover quantity for each supplier is greater than 158 Hangbar parts. The AM supplier performance frontier is established by linearly connecting the suppliers that yield the highest cost switchover quantities, the highest lead-time switchover quantities, and the highest combination of cost and lead-time switchover quantities, as shown in Figure 5. AM suppliers can also be positioned below this frontier, indicating lower efficiency. The results also enabled operations managers to dynamically select a supplier based on the maximum quantity of parts that a supplier can supply. As for maximum quantity, Supplier 2 can supply up to 124 (N−1 = 125−1 = 124) Hangbar parts at a reduced cost, and Supplier 3 can provide up to 285 (N−1 = 286−1 = 285) Hangbar parts with reduced lead-time. Further, if the required part quantity is higher than the maximum cost and lead-time switchover quantities of a specific supplier, the outcome allows outsourcing to two or more suppliers simultaneously to achieve the required quantities. However, if the required part quantity is higher than the cumulative quantities of the available AM suppliers, the dynamic supplier selection practice recommends manufacturing through the conventional mode.
Similarly, Table 4 lists the results obtained from all part candidates analyzed in this pilot study. Our operational decision-making procedure yielded all part candidates in Scenario IV, enabling opportunities in making trade-offs in cost and lead-time savings as a function of equipment downtime cost. It also provided 53% (8/15) of part candidates in Scenario I. When a trade-off was made to mitigate equipment downtime costs (100€/h) for parts (8 parts) causing equipment interruption, nearly all (14/15) candidates benefited from Scenario I. This is the intended outcome. Scenario II depicts an emergent outcome and Scenario III denotes an unintended outcome of our intervention design. These scenarios were empty in our pilot study.
5. Evaluation: mechanisms and design propositions
The successful outcome of our intervention design for the provision of 36 problematic individual spare parts was triggered by the generative mechanisms of dynamic operations—combining highly interactive model-based supplier relationships and insubstantial transaction costs—which allow us to react to the current situation in supplier operations, part demand, and available production methods. Based on the findings, our dynamic decision-making practice for operations managers to select the supply from multiple suppliers can save costs and lead-time for the provision of individual spare parts on a contextual basis. To this end, we propose the following:
During the switchover process, if a potential spare part passes the AM eligibility requirements ( Appendix), they should still be evaluated for the allowable asset-specificity spectrum. This can prevent expenditure of resources for parts that contain a basic geometry close to the primary shape of a stock material and for parts that would still require high asset specificity after AM.
In case dynamic supplier selection yields a spare part in Scenario I (reduced cost and lead-time), its lack of availability should still be analyzed for a potential equipment downtime impact, for example, loss in cost per hour, because additional cost savings may be available to the customer if a part can be made available earlier from another supplier to avert downtime.
Spare parts in Scenario II (reduced cost at higher lead-time) and IV (reduced lead-time at higher cost) allow for making trade-offs between cost and lead-time savings for the customer.
The downtime cost frontier, presented in Figures 3 and 4, can maximize Scenario I (reduced cost and lead-time) and reduce Scenario IV (reduced lead-time at higher cost). Evidently, it can shift spare parts from Scenario IV to I depending on the downtime cost frontier.
Spare parts in Scenario II (reduced cost at higher lead-time) can allow for supplying non-problematic parts that do not require urgency and do not cause an interruption in equipment operations, for example, when ordering the scheduled maintenance or replenishment of inventories.
Spare parts in Scenario III (increased cost and lead-time) should not be switched over to the selected AM suppliers hitherto.
In case dynamic supplier selection yields lead-time savings that are adequate, for example, to tolerate the impact of equipment downtime, it can enable an OEM company to operate without inventories (i.e. safety stock). This can mitigate inventory costs for slow movers and parts that may become obsolete.
Dynamic supplier selection allows for establishing an AM supplier performance frontier for assessing maximum cost and lead-time switchover quantities of a spare part. This enables an estimation of a switchover threshold for parts with a demand of variable batch size. It can also allow for multi-directional outsourcing in addition to uni-directional complete outsourcing, depending on the number of available suppliers, switchover quantities of suppliers, and the required part quantities of the customer.
Dynamic supplier selection allows for increased cost and delivery performance by shifting the operational and asset frontiers to multiple suppliers without substantial transaction costs and a risk of impeding customer relationships.
Based on direct feedback, the case company was satisfied with our collaborative development work that yielded significantly profitable outcomes for tackling the enigma of problematic spare parts. It encouragingly plans to deploy AM into its supply chain by appointing a technology manager experienced in digital technologies within its organization. It is currently validating and verifying the performance of additively manufactured spare parts. It is also exploring opportunities for implementing AM infrastructure within its organization at its global customer centers. Lastly, it is under the process of identifying the possibilities of providing a combination of cost, responsiveness, and performance dimensions as a premium service for its customers.
6. Discussion
Contributing to the emerging body of literature on the selection of parts that can potentially switch over to AM from large spare part portfolios (Chaudhuri et al., 2021a; Frandsen et al., 2020; Knofius et al., 2016; Lindemann et al., 2015; Simkin and Wang, 2014), we conducted design science (Holmström et al., 2009) research supported by CIMO design and evaluation logic (Denyer et al., 2008). We developed a novel operational solution for the provision of individual spare parts in the after-sales operations of a case company. In contrast to previous procedures reported in literature, our proposal is on the operational process level, specifying the interaction with prospective suppliers for purchasing an individual spare part. As Heinen and Hoberg (2019) recognized, detailed operational assessments and new practices that consider individual part-specific operational and economic factors are needed when switching over to digital spare parts. Based on the detailed understanding of the problem context in the case company, we focused on parts that were problematic from economies of scale perspective.
Fisher's model states that higher performance can be achieved by aligning functional (predictable demand) products with physically efficient supply chains and innovative (unpredictable demand) products with market responsive supply chains (Fisher, 1997). The problematic parts of the case company resemble innovative product type, which contains unpredictable demand and requires quick response to minimize stock-outs, forced markdowns, and obsolete inventory. A shift from a functional to an innovative product can be caused by a move along the life-cycle of the product from the maturity phase to the after-sales phase. A mismatch was created when the case company did not acknowledge the need to shift the physically efficient supply chain to a market responsive supply chain driven by new digital technologies. Though our case study was conducted in the mining industry, Fisher (1997) highlights this phenomenon in the automotive, computer, and consumer packaged goods industries. Selldin and Olhager (2007) indicated that a considerable number of companies have a mismatch between product types and supply chains from 128 manufacturing companies from consumer and industrial goods industries. They also established a supply chain frontier (Selldin and Olhager, 2007) to highlight companies that tend to combine characteristics from both physically efficient and market responsive supply chains while maintaining a high profitability level. The dynamic supplier selection practice allows for shifting the supply chain frontier at an operational level for each specific spare part. Since the results yield higher cost and lead-time performance without a trade-off, the practice shifts the performance frontier.
Observing increasingly high inventory costs and long lead-times for 36 individual spare parts provided by the case company, we developed the intervention design for a dynamic decision-making practice for operations managers to select between the supply of parts from multiple AM suppliers and the static conventional supply at an operational level without impeding customer relationships and invoking significant transaction costs.
Our key contribution is the identification of switchover scenarios considering changing cost and benefit outcomes through dynamic supplier selection. The intended outcome of AM switchover is Scenario I (reduced cost and lead-time) and IV (reduced lead-time at higher cost). In the case company, the initial expectation was that all the parts would be in Scenario IV, following the expectation that AM offers a more responsive supply of parts (Khajavi et al., 2014; Li et al., 2017; Pérès and Noyes, 2006). To this end, the results were in line with the expectations, and all the parts were discovered in Scenario IV from at least one of the AM suppliers for each individual spare part. However, our dynamic decision-making practice also yielded nearly half of the part candidates in Scenario I simultaneously from another AM supplier of the parts. This observation-based key argument of dynamic decision-making indicates that AM offers an operational shift in performance frontier for the most problematic spare parts for conventional supply. Further, the supply of all the part candidates from at least one of the AM suppliers was eventually moved from Scenario IV to Scenario I when the impact of equipment downtime at the customer site was considered. As the downtime cost increases, it maximizes Scenario I and minimizes Scenario IV. This is the scenario that operations managers responsible for the supply of spare parts aim for when introducing digital spare parts. In addition, if the lead-time for digital spares is sufficiently short to avoid equipment downtime, an OEM company can eliminate expensive safety stock altogether (Huiskonen, 2001; Knofius et al., 2016; Walter et al., 2004). The emerging outcome of switchover Scenario II (reduced cost with higher lead-time) can enable cost savings for operations managers to supply non-problematic spare parts when spare part urgency is low, and operations are not interrupted. We encourage future studies to explore the potential of Scenario II in spare parts portfolios.
The undesirable Scenario III (increased cost and lead-time) indicates that a switchover to AM is not recommended. This scenario serves as an economic and operational exclusion scenario for operations managers to screen out parts eligible for AM, excluding both parts with low asset specificity and parts with high asset specificity in post-processing following a switchover to AM. Low asset specificity can be leveraged for economies of scale in conventional manufacturing through swift and even flow (Schmenner and Swink, 1998), with general-purpose AM at a disadvantage due to slow speed of manufacturing. In contrast, high asset specificity in AM post-processing increases costs and lead-time through, for example, conventional setups and machining. The exclusion scenario allows economizing of AM resources, ability to stay within the beneficial asset specificity spectrum, and focus on parts that have a high cost and lead-time reduction potential. The parts that we precluded (10/36) during our geometrical assessment phase would most probably have been in the exclusion Scenario III. A shift to another scenario may be possible by redesigning for AM, for example, by creating light weight parts, and by optimizing the part for functionality (Gibson et al., 2015). This opens opportunities for future studies in which researchers can shift parts out from Scenario III by decreasing costs and lead-times. This can also yield temporary bridge parts that may be used before the original becomes available.
The results of our intervention also enable operations managers to dynamically select a supplier based on the maximum quantity of parts that it can supply at increased cost and lead-time performance. We introduce the AM supplier performance frontier and possibilities for multi-directional outsourcing to different suppliers simultaneously. The AM supplier performance frontier (Figure 5) shows the most cost and lead-time effective supplier, situated in the top-right region, available for a specific spare part. When the available switchover quantities based on cost and lead-time are filled by the most effective supplier, the operations managers can order from the second most cost and lead-time effective supplier. Similarly, the operations managers can fill the order from the remaining suppliers until the part quantity that the customer requires is fulfilled. The operations managers can also fill the order from a supplier that matches the specific requirements of the customer based on cost and lead-time. This yields a dynamic response to the customer requirements as opposed to the static choice with conventional supply entailing minimum order quantity for each specific spare part. This dynamic supplier selection practice allows operations managers to increase the performance frontier by radically shifting the asset and ultimately the operational frontiers. It aids in effectively producing spare parts that are unable to satisfy the constraints of economies of scale to generate a return on part-specific investments, and that are unable to respond better to fluctuations in demand without incurring significant costs.
The simplicity of the AM production engineering process for build-to-model is a key mechanism for the beneficial outcome of many different supplier performances of different price and delivery time. For the prospective supplier, the upload of the digital file of a 3D model provides all the requirements for manufacturing. This minimizes transaction costs associated with co-ordination (e.g. contracting and negotiating product specification and pricing), operations risk (e.g. information asymmetry), opportunism risk (e.g. loss of asset-specific resource control), and asset-specific re-investments for each specific spare part. In tool-based conventional manufacturing, the production-process instructions are part-specific and complex. Setting a company boundary between the part design and the conventional manufacturing task induces high mundane transaction costs due to difficulty in transferring standardization, counting, and compensation across the boundary of the company (Baldwin, 2008; Langlois, 2005). The AM digital file allows for encapsulating the part design and the production-process instructions. This establishes a thin crossing point (Baldwin, 2008) at the juncture between the part design and the manufacturing task, significantly lowering the mundane transaction costs. This mechanism enables a dynamic response at an operational level in contrast to a static response for each specific spare part. It allows for outsourcing the production of an individual spare part to multiple different suppliers at the same time that can offer different benefit scenarios without incurring significant transaction cost penalties. This possibility of shifting the performance frontier and offering trade-offs can allow for new customer relationships according to the customer requirements and value for each spare part.
The observed cost and lead-time performance variance between AM suppliers was not followed up. We venture that the variance is due to the difference in their operating frontier. AM suppliers aim to pack the build chamber with different parts from different customers to minimize costs via capacity utilization and throughput effects (Baumers and Holweg, 2019). Costs can include machine costs, material costs, labor costs, and supplier premiums based on the adaption and the practical application to the existing models (Atzeni and Salmi, 2012; Rickenbacher et al., 2013; Ruffo et al., 2006). To this end, suppliers with adequate demand to fill the build chamber are more likely to offer lower costs. The lead-time as a function of the AM process and the material profile was very similar. We assume the variation is mostly due to how fast an AM supplier fills up its build chamber. However, these effects mean that the supplier performance is also likely to vary over time. This can shift the AM supplier performance frontier, identifying the most cost and lead-time effective suppliers at the time of sourcing the specific spare part. Currently, the risks for disruption of AM supply are not prominent, as existing suppliers are investing heavily in AM, and the number of new suppliers and the degree of AM infrastructure are expanding every year (Wohlers, 2021), increasing the available general-purpose AM capacity.
A growing number of AM suppliers are being certified in relative ISO standards, for example, the ISO 9001 for quality management, the ISO 9100 for aerospace and defense industry, and the ISO 14001 for medical industry, to limit the uncertainties in the AM process chain. High risk parts require type approvals from relative authorities, for example the Federal Aviation Administration (FAA) production certification limits the use of an AM machine to only the certified part with static configuration control, prohibiting the possibilities of making changes to the process without FAA approval. Product-specific approvals can contribute to transaction costs and limit supplier relationships. Approvals will be eased as AM technologies are continuously developing. While supplier audits may be required based on the application-specific risk level, no specific certification is required for risk-free parts.
Generalizing on a single study is challenging. However, the combined impact of grounding in literature and the identification of generative mechanism for a single case study opens a direction for further research, theory building, and theory testing (Yin, 2018).
Logically, our solution is based on 36 embedded units of analyses (Barratt and Barratt, 2011), confirming that it worked for 36 individual spare parts. Each spare part contained a unique geometry with distinct design and shape. The geometric applicability can be generalized considering the unprecedented level of geometric freedom (Kumke et al., 2018) that general-purpose AM inherits without product-specific tooling. We maintain the generalizability of parts by identifying their overall dimensions (length, width, and height) that are critical for the build chambers of the AM machines of prospective suppliers.
As competition and demand brought upon by globalization is pushing the boundaries of innovation and technological complexities to new horizons, the dilemma of spare parts operations is exacerbating and placing pressure on academics and practitioners to support an economic maintenance and continuity of operations. To this end, extant literature highlights identical conditions in the after-sales operations for transferability of the results outside the case company, including the mining, processing, automotive, aerospace, medical, high-tech, and defense industries (Chaudhuri et al., 2021a; Frandsen et al., 2020; Gelders and van Looy, 1978; Ghadge et al., 2018; Holmström et al., 2010; Huiskonen, 2001; Khajavi et al., 2014; Knofius et al., 2016; Lindemann et al., 2015; Regattieri et al., 2005; Roda et al., 2014; Suomala et al., 2002).
The after-sales service constitutes approximately 8% of the United States gross domestic product, which amounts to a 700 billion USD annual expenditure (Lengu et al., 2014). The importance of such a market is non-trivial because service cycles of products are inevitable and disruptions in downtime are unproductive. Our design proposal can allow companies to supply parts using AM in conjunction with conventional supply chains. It also serves as a tool for companies to swiftly check the AM potential within their large spare part repositories that can shift the performance frontier for the provision of spare parts. The dynamic decision-making can allow companies to outsource manufacturing of spare parts and focus on its core operations (Ahmad and Mondal, 2019). Once a company reaches steady demand for additively manufactured spare parts, it can expand its core operations to AM and invest in its own AM infrastructure to fulfill its own demand and pool its demand and capacity with a wider network of AM suppliers (Hedenstierna et al., 2019).
Our multidisciplinary intervention design is based on empirical field data and direct feedback. However, it is limited to the extent that the effort to collect and evaluate the geometric, mechanical, and operational properties of spare parts was excluded in the cost and lead-time analyses that were performed for each part. Evidently, the long-term benefits of the switchover cost savings will most certainly overtake the initial cost of preparing the parts for a potential switchover. The preparation process does require collaboration across disciplines involving skillsets of mechanical engineers, AM experts, and operations managers. However, this should not deter OEM companies because when the prerequisites of a specific spare part are prepared for an AM switchover, they remain ready indefinitely to be called out from electronic inventories for different AM technologies and suppliers with a dynamic response.
Moving from static to dynamic decision-making, customers can now be involved with the local sales team or e-commerce platforms of the OEM companies to make the final decision as per requirements and value for each spare part. Considering that AM suppliers already have web-based automatic information tools, the buyers, for example OEM companies, would need to build information tools for automatic data retrieval needed for the dynamic supplier selection practice using the build-to-model mode.
7. Conclusion
In collaboration with practitioners of a case company, we introduced a solution for dynamic decision-making that enables outsourcing the supply of spare parts to multiple AM suppliers concurrently, without substantial transaction cost penalties and impeding customer relationships. Our solution contributes to the emerging stream of research on build-to-model manufacturing (Hedenstierna et al., 2019; Holmström and Partanen, 2014). Our dynamic supplier selection practice indicates profitable results that allow operations managers to dynamically choose AM suppliers globally in terms of changing objectives and circumstances. This approach helps operations managers to alternate between the dynamic additive supply, whether in-house or outsourced to multiple suppliers, and the static conventional supply by means of cost reduction, lead-time reduction, and supporting trade-offs in cost and lead-time according to customer requirements and value for each idiosyncratic spare part. It also enables practitioners to re-outsource problematic parts that may have been returned to in-house manufacturing owing to increasing minimum order quantities, inventory costs, and long lead-times.
The research was supported by a funded doctoral student position at Aalto University School of Engineering with Dean's decision number D/43/01.01.07/2017. A special acknowledgement is extended to the staff of the case company that provided a professional platform for this study.