Skip to article sections
Purpose

This study develops a structured framework for supplier risk assessment that supports the empirical assessment of supplier-level resilience capabilities. The framework integrates specific and overarching risk dimensions, factors and indicators, thereby enabling companies to proactively identify and manage potential disruptions. It addresses existing research gaps by consolidating fragmented perspectives into a coherent structure that enables empirical investigation and operationalization.

Design/methodology/approach

A node-level approach combines a structured literature review with expert workshops to derive operationalizable supplier-specific indicators that facilitate empirical investigation and cross-sector validation. The literature review identified essential risk dimensions, associated factors, and operational indicators, each linked to potential information sources. These were validated and weighted through expert workshops, forming the basis of a measurement approach intended as an assessment instrument for future application and testing.

Findings

The resulting framework comprises environmental, financial, social and operational risk dimensions, each associated with structured risk factors and indicators, providing a foundation for assessing supplier-specific vulnerabilities. By explicitly assigning information sources, such as certifications, indices, and internal records, the framework facilitates data acquisition. The expert workshops corroborated the relevance of a flexible model that allows for industry-specific adaptation while remaining amenable to model building.

Originality/value

This novel framework provides an integrated, multi-layered structure that translates resilience concepts into testable components for supplier risk assessment. It bridges theoretical constructs and operational indicators, paving the way for systematic supplier risk assessment across industries.

Global networking and dynamic market developments have made supply chains (SCs) a critical competitive factor in today's volatile environment. Supply disruptions caused by geopolitical crises, pandemic aftershocks, and resource dependencies confront every company. Assessing the robustness of individual suppliers has become decisive in overall supply chain resilience (SCRE), as local failures can propagate across networks and cause system-wide disruptions. The COVID-19 pandemic, the Ukraine war, and the semiconductor crisis exposed structural vulnerabilities and triggered a fundamental rethinking of supplier risk management and evaluation practices.

While supply chain risk management (SCRM) has a long and rich history (Manuj and Mentzer, 2008; Norrman and Jansson, 2004; Wieland and Wallenburg, 2012), its traditional focus on prevention and continuity planning is no longer sufficient. Since 2023, new regulatory and market developments, including the Corporate Sustainability Due Diligence Directive (CSDDD) and the Corporate Sustainability Reporting Directive (CSRD), have intensified expectations regarding supplier oversight. As EU regulations, these directives are particularly relevant to companies operating within the European Union, although their implications extend globally through multi-tier supply networks connected to EU-regulated firms. Emerging Environmental, Social, and Governance (ESG) disclosure requirements likewise compel firms to evaluate suppliers not only for performance but also for resilience and ESG preparedness. At the same time, digital traceability tools, global data indices, and AI-based monitoring have made it possible to observe supplier behavior and vulnerabilities more transparently than ever before (Dubey et al., 2023; Hendriksen, 2023; Kamble et al., 2022). These developments have exposed that traditional supplier evaluations are often inadequate for capturing the adaptive capabilities that determine survival under disruption (Urbaniak et al., 2022; Wiedenmann and Größler, 2021).

This study thus meets an urgent need for an empirically grounded and externally assessable supplier evaluation framework that integrates risk and resilience management. Although prior SCRM and SCRE studies have extensively examined the theoretical linkages between risk, resilience, and network structures (Ivanov and Dolgui, 2021; Pettit et al., 2013), they have not yet translated these insights into a coherent, operational tool applicable at the supplier level. Existing frameworks remain largely conceptual or focus on network-level resilience, neglecting the micro-level where most vulnerabilities originate (Cerè et al., 2017; Patrício et al., 2025; Smith et al., 2011). This means that firms still lack empirically operational supplier-level instruments that translate resilience from an abstract concept into observable and comparable risk indicators.

This study proposes a multi-layered, indicator-based framework for supplier risk assessment that translates resilience-relevant capabilities into externally observable and empirically testable indicators. By integrating insights from 29 studies with expert validation across multiple industries, the framework enables comparable, supplier-level assessment while remaining adaptable to industry-specific contexts. The approach represents a supplier-level advancement in integrating SCRM and resilience by linking individual supplier assessments to network-wide capability building. To clarify the positioning of this study, Table 1 synthesizes the main research streams, contributions made, and the remaining gaps.

Building on these insights, this paper poses two research questions:

RQ1.

Which categories and factors are relevant for a holistic external assessment of suppliers?

RQ2.

Which indicators can be used to operationalize these factors for empirical measurement and comparison?

This study combines a theory-informed systematic literature review with expert validation to develop a structured framework for supplier risk and resilience assessment.

Continuous globalization and the increasing complexity of supply networks have made companies vulnerable to a wide array of potential disruptions, ranging from geopolitical uncertainties and natural disasters to supplier financial challenges. Efforts to conceptualize how these supplier-level risks translate into network-level outcomes make use of the concept of resilience. Resilience refers to a company's capacity to absorb, adapt, and recover from disruptive events while maintaining or rapidly restoring desired performance levels (Hohenstein et al., 2015; Ponomarov and Holcomb, 2009). Achieving resilience requires systematic risk identification and assessment to enable both preventive and responsive measures. A foundational component of supply-chain resilience (SCRE) is robustness, representing proactive risk mitigation and the basis for anticipatory supplier-level assessment.

Risks may originate not only from suppliers but also from extended upstream supply chains, logistics routes, and sub-tier dependencies (Kumar et al., 2014). Interconnectedness among these elements across the globe hinders transparency, making it difficult for firms to assess their real exposure (Kinra et al., 2020). Existing approaches often adopt a macro-level perspective, focusing on network resilience as an aggregate property (Adobor and McMullen, 2018; Ahmadian et al., 2020; Han and Um, 2024). However, such approaches frequently overlook the micro-level supplier-specific risk factors that accumulate and propagate through networks.

Drawing on network theory (Burke and Ignizio, 1992; Euler, 1736), this study conceptualizes supply chains as interconnected nodes and edges through which disruptions propagate. Evaluating suppliers as individual nodes provides a granular perspective on network vulnerability and enables a node-based assessment that complements macro-level resilience models (Chowdhury and Quaddus, 2017; Ivanov and Dolgui, 2021). This node-based decomposition enables systematic comparison across supplier tiers and constitutes the structural foundation of the proposed framework.

An important contribution of this study lies in the holistic integration of management (SCRM) and resilience (SCRE). Traditionally, SCRM has emphasized risk prevention and compliance (ISO, 2018), whereas SCRE has focused on adaptability and recovery (Ivanov, 2020). Recent studies highlight the need to merge these perspectives into a unified governance approach (Biedermann and Kotzab, 2021; Han and Um, 2024; Ivanov, 2018). Integrating both concepts creates a continuous resilience cycle that combines anticipation, absorption, and adaptation to align risk management structures with capability development.

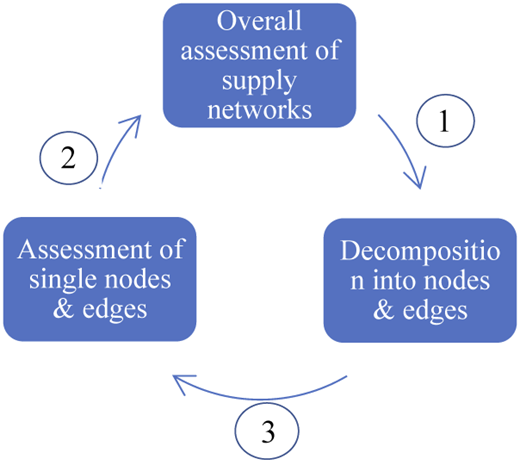
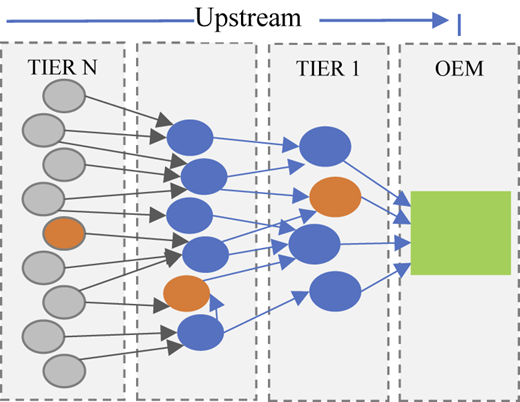
Figure 1 depicts our analytical representation of a simplified multi-tier supply network in which risks propagate upstream from lower-tier suppliers to the OEM. Each node represents a supplier or production entity, and the arrows indicate material and information flows that form the analytical foundation for the node-based assessment applied in this study. Building on this network view, Figure 2 summarizes the core assessment logic of this study and illustrates how supplier-level risk evaluations are aggregated into an overall network resilience assessment.

The next section reviews prior supplier risk and resilience research to identify why existing approaches remain insufficient for empirically operationalizing supplier-level assessment. This structured synthesis provides the empirical and theoretical foundation for deriving the core dimensions and indicators that inform subsequent framework development.

To structure the fragmented literature on supplier risk and resilience, this section organizes prior research into five dominant analytical streams: supplier risk assessment frameworks, resilience assessment models, network and propagation studies, quantitative and optimization-based approaches, and digital/ESG-oriented frameworks. Table 1 summarizes these streams, highlights their respective limitations, and positions the contribution of the present study. This structure guides the review and makes explicit the empirical gap addressed in the subsequent methodology section.

Although many studies in supplier risk management and supplier selection address risk mitigation, the literature remains fragmented. Most contributions focus on specific sectors, individual risk dimensions, or sustainability aspects, while only few integrate resilience in a systematic manner. The first stream focuses on structured supplier selection and supplier risk assessment models. Studies such as Rahman et al. (2022) and Torres-Ruiz and Ravindran (2018) apply multi-criteria methods (e.g. SWARA, WASPAS) to prioritize sustainability-related criteria, but their integration of dynamic risk or resilience factors remains limited. Li et al. (2021) develop a multi-criteria model to assess supplier-related risks; it comprises six categories: finance, manufacturing, product quality, delivery, collaboration, and service. Urbaniak et al. (2022) extend this logic using survey data from Polish manufacturing firms; their taxonomy groups supplier-related risks into three meta-dimensions: management system risks, environmental risks, and process risks. Also in pursuit of a risk management metric, Öztek and Kabak (2022) introduce a sustainability risk score incorporating 22 operational, technical, environmental, business, safety, and social indicators. While these frameworks provide valuable taxonomies, they are typically applied as static analytical structures, capturing risk and resilience factors at a given point in time, without modeling their dynamic interaction, temporal evolution, or endogenous adaptation across different industrial contexts.

The second stream of research examines resilience assessment models. Yang et al. (2023) propose a three-phase resilience model at the network level: absorption, adaptation, and recovery. Ambulkar et al. (2015) develop a resilience scale based on capabilities such as flexibility and visibility, while Pettit et al. (2013) combine vulnerability and capability factors into a resilience matrix. Chowdhury and Quaddus (2017) apply dynamic capabilities theory to capture resilience enablers, and Bruckler et al. (2024) propose a harmonized set of 17 metrics to quantify resilience capacities using the resilience curve concept. Although these models advance conceptual understanding, they often remain abstract and lack measurable indicators that can be empirically validated for supplier assessment.

A third, closely related stream focuses on network and propagation studies. Disruptions in supply chains rarely occur in isolation but propagate through inter-organizational dependencies. Dolgui et al. (2018), Ivanov (2018) and Kim et al. (2015) analyze how structural characteristics and network topology affect disruption diffusion and recovery dynamics. Likewise, classical studies such as Wagner and Bode (2008), Tummala and Schoenherr (2011) and Zsidisin (2003) examine sources of disruption, perception of supply risks, and global-sourcing frameworks, but mainly at an aggregated or managerial level. These models, however, address systemic propagation without considering supplier-specific heterogeneity or the role of firm-level vulnerability within the network.

A further research stream adopts quantitative or optimization-based perspectives. Studies such as Sawik (2013) and Fattahi and Govindan (2022) use optimization to select resilient supplier portfolios or to incorporate disruption risk into network design, while Hohenstein et al. (2015) highlight the need for empirical measurement of resilience. Despite methodological rigor, these models often prioritize efficiency and cost minimization, neglecting resilience as a dynamic, resource-based capability.

Building on this conceptual foundation, Wiedenmann and Größler (2021) propose a top-down framework for categorizing supplier-related risks within a single manufacturing context. While their model advances the structuring of risk typologies, it remains abstract and has not been empirically validated. Our study extends this approach by shifting from a top-down, conceptual categorization to a node-based, supplier-level assessment that systematically derives and empirically validates measurable risk indicators across multiple industries. We thus translate conceptual categories into empirically applicable assessments.

Early empirical work by Dubey et al. (2019) links big data analytics capability and organizational flexibility to resilience performance. More recent studies extend this perspective by examining how AI-enabled analytics, digital twins and ESG-oriented transparency shape risk monitoring and adaptive responses (Baryannis et al., 2019; Carnovale et al., 2025; Culot et al., 2024; van Hoek and Wong, 2025). Ivanov (2023) discusses the potential of digital-twin environments for resilience management, and Koberg and Longoni (2018) integrate sustainability and digital transformation perspectives. Although these frameworks emphasize transparency and traceability, they lack a unifying foundation that connects digital visibility to resilience measurement at the supplier level.

Taken together, the reviewed literature offers valuable conceptual insights but remains fragmented, either highly theoretical or limited to narrow contexts. This fragmentation highlights the need for a combined approach that systematically consolidates existing findings and validates them empirically. Because prior work is either conceptual or context-bound, we use an SLR to consolidate constructs and expert workshops to refine observability, feasibility, and prioritization. This mixed design ensures both coverage and practical relevance, bridging the gap between conceptual frameworks and actionable, supplier-level evaluation.

Following established guidance on qualitative multi-method research (Bryman, 2016; Creswell and Plano Clark, 2018), this study combines a theory-informed systematic literature review with a series of qualitative expert workshops for indicator consolidation and validation. The design is qualitative in nature, as no quantitative data analysis was conducted. Its primary purpose is to clarify constructs and operationalize indicators prior to subsequent quantitative testing in future research. The following subsections detail the systematic literature review procedure and the expert workshop design, including database selection, search strategy, screening criteria, and validation logic. The outcome of this process is a four-dimensional, indicator-based framework that distinguishes between upstream and downstream supplier risk signals and links each indicator to available information sources.

This study employed a theory-informed systematic literature review (SLR) consistent with established SCM review standards (Craighead and Ketchen, 2024; Durach et al., 2017; Kembro et al., 2014) and guided by the PRISMA framework (Rethlefsen and Page, 2022; Wortmann, 2023). The review identified supplier-related risk and resilience factors in prior research to provide an empirical foundation for expert validation and framework development.

We were guided by established practices for systematic literature reviews in supply chain management and adopted the Resource-Based View (RBV) (Barney, 1991) as the analytical lens (Barney, 1991). From an RBV perspective, supplier resilience is shaped by firm-specific resources and capabilities that influence vulnerability, robustness, and adaptive capacity under disruption. This lens informed both the coding of the literature and the clustering logic applied in the subsequent expert workshops. Searches were conducted in the Web of Science Core Collection and Scopus databases using the following Boolean query:

(“supply chain” OR “supplier”) AND (“risk” OR “resilience”) AND (“assessment” OR “evaluation” OR “framework”).

The review covered the period from 2010 to 2025 to capture recent advances in supplier risk and resilience research. Duplicate records were removed, and only peer-reviewed English-language journal articles were retained. Grey literature, purely technical optimization studies without explicit theoretical grounding, and studies outside the supply chain management domain were excluded.

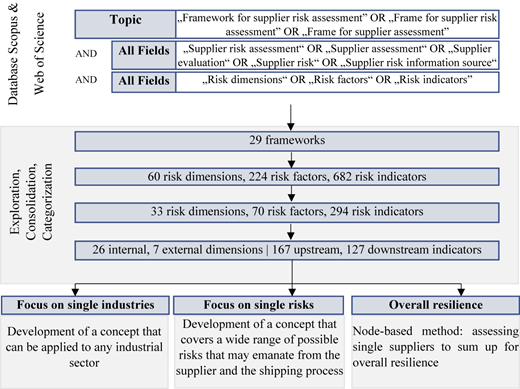
Screening and inclusion followed predefined criteria to ensure relevance and methodological transparency. Titles and abstracts were screened to identify studies addressing supplier- or supply-chain-level risk or resilience and providing conceptual or empirical insights into risk identification, assessment, or mitigation. Full-text screening was conducted independently by two researchers, with disagreements resolved through discussion or senior review. Figure 3 summarizes the multi-stage screening process, which reduced 341 initial records to 29 core studies.

The coding and synthesis procedure was guided by the RBV as conceptualized by Barney (1991). In the context of supplier risk and resilience assessment, the RBV provides a structured basis for classifying risk factors according to underlying organizational resources, processes, and capabilities that shape vulnerability, robustness, and adaptive capacity. The coding process combined deductive and inductive reasoning (Kembro et al., 2014). Deductive codes were derived from established constructs in supply chain risk and resilience research, such as financial stability, process quality, and governance robustness, while inductive codes captured emerging factors and context-specific nuances identified in the reviewed studies. This iterative synthesis resulted in an initial set of 60 risk dimensions, which were subsequently aggregated into 33 sub-dimensions and ultimately condensed into four overarching categories: organizational, location-based, operational, and strategic/corporate. These categories reflect distinct layers of supplier-related resource dependencies and capabilities and form the structural basis for the subsequent expert validation.

Quality appraisal and bias mitigation were addressed through systematic evaluation and triangulation. Each article was assessed against criteria of methodological rigor, theoretical contribution, and managerial relevance (Durach et al., 2017), with studies meeting at least two criteria retained. To enhance transparency and reduce subjectivity, dual independent coding with reconciliation was applied, yielding strong intercoder reliability (Cohen's κ = 0.82). In addition, triangulation through three expert workshops provided external validation by comparing literature-derived findings with practitioner perspectives (see Section 4.2).

Indicator selection and robustness were ensured through explicit retention thresholds and sensitivity analysis. Indicators were retained only if they demonstrated sufficient literature support (frequency ≥3) and high practical relevance, reflected by an average expert rating of seven or higher. These thresholds balance theoretical saturation and practical relevance in line with the RBV's focus on empirically observable resource-related factors. Sensitivity analyses that varied thresholds by ± 1 altered the retained indicator set by less than 10%, confirming robustness. The final output is a consolidated, theoretically anchored indicator set integrating insights from 29 core studies and structuring four risk dimensions with their subordinate factors. This set served as the empirical basis for expert validation and framework refinement.

Figure 3 illustrates the multi-stage review and consolidation process, including the database query, filtering steps, and progressive reduction of studies, dimensions, and indicators that informed the development of our framework. Tables 5 and 6 in the Appendix I and II present the risk dimensions and factors derived from the literature review and constitute the basis for subsequent framework development. The resulting compilation, summarized in Table 2, served as the starting point for validation and refinement during the first expert workshop.

The expert workshops were used to validate and refine the literature-derived framework with respect to conceptual clarity, empirical observability, and operational feasibility. Table 2 presents the initial consolidated structure derived from the systematic literature review, which served as the starting point for expert validation and subsequent refinement into the final framework.

Three qualitative expert workshops were conducted with 12 purchasing and supply chain management professionals from four German industrial companies operating in globally distributed supply networks, including the automotive and mechatronics, pharmaceutical and laboratory equipment, investment casting, and mechanical engineering sectors. Participants represented strategic purchasing, operational purchasing, and ESG-related functions. To reduce groupthink, the workshops combined individual reflection, company-specific working groups, and moderated plenary discussions. Details on workshop design, including the agendas and guiding questions for each workshop, are provided in Appendix III (Tables 7–10).

Across the three workshops, the initial literature-derived factor set (Table 2) was consolidated into four analytical dimensions, refined into upstream vs. downstream indicators, linked to feasible information sources, and prioritized via expert weighting, resulting in the final framework presented in Table 3. The triangulation of literature-based insights and expert-derived feedback resulted in a framework that is theoretically grounded, empirically informed, and adaptable across industries.

Experts confirmed the overall structure of the initial framework but emphasized the need for simplification and prioritization to support practical application. Importantly, they clarified that the four overarching risk dimensions do not represent mutually exclusive categories. Rather, these dimensions function as higher-order analytical lenses for interpreting supplier-related risk and resilience factors. As reflected in the consolidated framework (Table 3), individual indicators may relate to multiple dimensions simultaneously, capturing overlapping aspects of supplier vulnerability and capability rather than being assigned to rigid “buckets.”

To enhance operational usability, experts recommended distinguishing indicators according to their functional role in risk and resilience management. This resulted in two structural refinements incorporated into the final framework: a differentiation between anticipatory and responsive indicators to separate preparedness from recovery capacity, and an upstream-downstream perspective to reflect how early warning signals and observable consequences emerge and propagate across supplier nodes within a supply network.

Expert discussions further highlighted that supplier vulnerability and robustness vary by supplier type and network position. This insight motivated the introduction of weighting and prioritization mechanisms to reflect relative importance at the individual supplier level. In a network representation, each supplier can be modeled as a node characterized by a vector of observable indicators, enabling supplier-specific assessment and aggregation across the network without assuming a strictly hierarchical chain structure or a specific technical implementation.

Finally, experts identified data availability and integration as the primary implementation challenge. Although much of the required information is already available from internal systems or external sources, it is often fragmented across databases and formats. Consequently, indicators in the final framework are explicitly linked to feasible information sources, supporting empirical assessment and enabling future data-driven or object-oriented implementations.

The systematic literature review yielded 60 distinct risk dimensions across 29 studies. These were iteratively consolidated through thematic coding into 33 sub-dimensions and four overarching categories: organizational, location-based, operational, and strategic/corporate. The four categories reflect complementary perspectives on supplier risk: organizational (internal processes, quality management, social and ecological standards), location-based (external political, infrastructural, and environmental risks), operational (procurement, production, and logistics factors), and strategic/corporate (long-term governance and financial stability). This hierarchical aggregation provides a clear structure that captures both internal and external risk layers, forming the conceptual foundation for the expert-based validation and weighting presented in Section 4.2.

Table 3 summarizes the validated framework by linking each risk dimension and factor to upstream and downstream indicators and their corresponding information sources. The distinction between upstream (preventive) and downstream (reactive) indicators reflects anticipatory versus responsive resilience capabilities.

The framework's grouping is aligned with the four resilience dimensions of robustness, redundancy, resourcefulness, and rapidity (Bruneau et al., 2003; Cimellaro et al., 2009). The framework incorporates visibility by explicitly linking each indicator to feasible information sources, enabling systematic observation and empirical measurement. The distinction between upstream and downstream indicators enhances risk awareness by differentiating between early warning signals and observable consequences of supplier-related risks, reflecting how disruption signals and impacts emerge over time and propagate across supplier tiers. This distinction supports a more targeted assessment and provides a logical foundation for categorizing resilience measures into short-term reactive responses and long-term structural improvements. Together, these design choices translate literature-derived and expert-validated indicators into an operational assessment structure that supports both empirical testing and managerial application.

Application of the framework begins with the identification of relevant risk dimensions organizational, location-based, strategic, and operational linked to underlying risk factors. The assessment is then conducted using both upstream and downstream indicators, allowing early warning signals and realized impacts to be considered jointly. Although this structured mapping facilitates future automation or digital integration, it is equally applicable to manual decision-making contexts. To ensure a robust evaluation of supplier risk and to avoid reliance on a single perspective, the framework recommends combining internal and external information sources.

The methodology allows for a granular analysis of supplier-specific risks that may have direct and immediate effects on the buying organization. This forward-looking and differentiated approach empowers supply chain managers to anticipate critical risk exposures early and to make more informed decisions, including whether a supplier's risk profile is acceptable under specific contingencies or whether the anticipated consequences justify switching to alternative sources.

In summary, the proposed framework provides a structured yet flexible basis for risk-aware supplier evaluation and proactive resilience management across global supply chains. This framework goes beyond risk to include resilience.

While supply chain resilience has become a widely acknowledged strategic objective, prior research has remained largely conceptual or concentrated on firm-level outcomes. There is limited guidance on how resilience can be operationalized at the supplier level, where many risks originate and propagate through different positions in the supply network. The framework developed in this study addresses this limitation by operationalizing supplier-level resilience through observable indicators, enabling assessment beyond firm- or network-level proxies. In doing so, the study responds to recent calls for more rigorous, multi-dimensional resilience measurement in complex, multi-tier supply networks (Yang et al., 2023).

The framework conceptualizes resilience as a configuration of interdependent supplier capabilities, rather than as isolated practices or static attributes. By distinguishing between anticipatory and responsive indicators across upstream and downstream interfaces, it enables an ex ante assessment of supplier preparedness and recovery capacity, rather than inferring resilience solely from ex post disruption outcomes. This aligns with recent research emphasizing adaptive, reconfigurable, and proactive supplier capabilities as critical drivers of resilience in multi-tier supply networks (Carnovale et al., 2025; Guntuka et al., 2024; Hajarath and Vummadi, 2024). It also resonates with emerging perspectives that conceptualize digital, analytics, and sensing capabilities as foundational for resilience at both firm- and network-levels (Dubey et al., 2023).

In contrast to earlier frameworks that rely on static or industry-specific taxonomies (Pettit et al., 2013; Wiedenmann and Größler, 2021), the framework uses indicators that can be compared across industries while still adjusted to specific contexts. This design directly addresses challenges in assessing suppliers' governance-related attributes that arise from differences in regulatory regimes, sustainability requirements, and levels of digital maturity across supply networks. By specifying publicly available indicators and associated information sources, the framework supports both traditional survey-based research and data-driven approaches that leverage digital traces, disclosures, and monitoring systems.

Notwithstanding, the framework represents an initial measurement layer and is intentionally specified as a largely static indicator set at a given point in time. While the upstream–downstream distinction captures leading versus lagging signals, it does not yet account for capability development trajectories or the evolution of supplier competencies. Building on competence-based perspectives, a natural next step is to extend the framework to a dual competence assessment that distinguishes between current capability levels and capability development potential. Such an extension would require longitudinal indicators and data sources and, where appropriate, adaptive indicator weighting to reflect changing supplier conditions and network contexts over time.

The framework contributes by making supplier-level resilience empirically testable through observable indicators. From a theoretical perspective, it integrates capability- and network-based views of resilience while enabling empirical tests that are difficult to conduct using aggregated firm- or network-level measures alone. Established perspectives such as the Resource-Based View provide a baseline for understanding supplier vulnerability, while more recent work emphasizes dynamic capabilities, network embeddedness, and temporal adaptation as key mechanisms shaping disruption outcomes (Carnovale et al., 2025; Guntuka et al., 2024; van Hoek and Wong, 2025). Network-analytic studies further demonstrate that structural characteristics such as centrality, connectivity, and path length influence disruption propagation and recovery, yet these studies typically rely on stylized firm representations and ex post outcome-based resilience metrics (Ivanov, 2025; Li and Zobel, 2020). The framework responds by closing a persistent measurement gap: most empirical studies rely on ex post outcomes, such as recovery time or performance loss, with limited observable inputs at the supplier level. By providing assessable indicators of supplier preparedness and response capacity, the framework allows researchers to model resilience as a function of capability configurations and their interaction with network structure and digital infrastructures, rather than inferred retrospectively from disruption outcomes.

Building on this foundation, Table 4 outlines three focused research streams. Because the current indicator set is derived from literature synthesis and qualitative expert validation, its statistical structure, construct validity, and predictive power remain to be established through large-scale empirical testing and subsequent scale refinement.

The validation stream leverages the indicator structure to test how configurations of anticipatory (e.g. preparedness, redundancy, visibility, digital sensing) and responsive (e.g. recovery speed, reconfiguration capacity, substitution flexibility) supplier capabilities predict resilience outcomes such as time-to-recover, time-to-survive, performance persistence, and risk-exposure, beyond traditional cost, risk, and network measures. This enables systematic differentiation of preparedness from recovery effects and provides empirical grounding for concepts such as network plasticity and digitally enabled resilience.

The evaluation stream addresses decision-relevant trade-offs associated with resilience investments. While prior research acknowledges efficiency–resilience trade-offs, empirical evidence on the relative value of specific resilience measures remains limited, as such actions are often treated as undifferentiated bundles (van Hoek and Wong, 2025; Lücker et al., 2024). By integrating supplier-level indicators into optimization models, scenario analyses, and sensitivity experiments, future research can not only evaluate when investments in anticipation (e.g. redundancy, monitoring, predictive analytics) outperform investments in response (e.g. accelerated recovery, network reconfiguration, emergency sourcing), but also examine how these trade-offs vary across industries, regulatory contexts, and network positions.

The extension stream positions the framework as a foundational measurement layer for dynamic and digitally enabled resilience research. While emerging research conceptualizes resilience as a network-level capability characterized by plasticity, reconfiguration, and digital adaptation (Guntuka et al., 2024; van Hoek and Wong, 2025; Ivanov, 2025), empirical progress remains constrained by the lack of supplier-level inputs suitable for integration into digital twins, simulation models, and hybrid analytics environments. Embedding the proposed indicators into such architectures would enable systematic testing of how capability configurations, governance strategies, and information-processing structures influence disruption propagation and recovery over time.

Taken together, these streams position supplier-level capability indicators as empirically tractable micro-foundations for analyzing how resilience emerges from the interaction of preparedness, recovery capacity, and network structure. By enabling empirical differentiation between anticipation and response, linking supplier capabilities to network-level dynamics, and supporting digitally enabled experimentation such as simulation-based stress testing, supplier portfolio optimization, and network reconfiguration analysis, the framework serves as an operational starting point for scale validation, indicator refinement, and dynamic extensions toward capability trajectories and development potential.

This study advances supplier risk and resilience research by developing a structured, indicator-based framework for supplier-level assessment. By integrating a systematic literature review with expert validation, the framework translates abstract resilience concepts into observable and assessable indicators, addressing a long-standing gap in empirical resilience research: the absence of measurable inputs at the supplier level, where many risks originate and propagate through supply networks.

The framework moves supplier evaluation beyond static, cost- or compliance-oriented assessments toward a resilience-informed, capability-based perspective. By distinguishing between anticipatory and responsive indicators, it enables separate assessment of supplier preparedness and recovery capacity and provides a micro-foundational link between supplier-level capabilities and system-level resilience dynamics. As such, the study contributes an empirically tractable and decision-relevant measurement structure that supports both academic analysis and managerial supplier assessment in increasingly volatile and interconnected supply networks.

The work leading to this manuscript was conducted in the course of the project “Resilience through agile value networks and AI-based optimization (Re_KI_lienz)” (Nr. 02J21C025) funded by the German Federal Ministry of Education and Research (BMBF), which is gratefully acknowledged.

The supplementary material for this article can be found online.
Adobor
,
H.
and
McMullen
,
R.S.
(
2018
), “
Supply chain resilience: a dynamic and multidimensional approach
”,
The International Journal of Logistics Management
, Vol. 
29
No. 
29
, pp. 
1451
-
1471
, doi: .
Ahmadian
,
N.
,
Lim
,
G.J.
,
Cho
,
J.
and
Bora
,
S.
(
2020
), “
A quantitative approach for assessment and improvement of network resilience
”,
Reliability Engineering and System Safety
, Vol. 
200
, 106977, doi: .
Ambulkar
,
S.
,
Blackhurst
,
J.
and
Grawe
,
S.
(
2015
), “
Firm's resilience to supply chain disruptions: scale development and empirical examination
”,
Journal of Operations Management
, Vols
33-34
No. 
1
, pp. 
111
-
122
, doi: .
Bai
,
H.
,
Chen
,
Y.
and
Zhang
,
Z.
(
2025
), “
Exploring the mitigating role of sustainable innovation in supply chain disruption risks under the digital economy
”,
International Review of Economics and Finance
, Vol. 
103
, 104372, doi: .
Barney
,
J.
(
1991
), “
Firm resources and sustained competitive advantage
”,
Journal of Management
, Vol. 
17
No. 
1
, pp. 
99
-
120
, doi: .
Baryannis
,
G.
,
Dani
,
S.
,
Validi
,
S.
and
Antoniou
,
G.
(
2019
), “Decision support systems and artificial intelligence in supply chain risk management”, in
Zsidisin
,
G.A.
and
Henke
,
M.
(Eds),
Revisiting Supply Chain Risk
,
Springer International Publishing
,
Cham
, Vol. 
7
, pp. 
53
-
71
, doi: .
Biedermann
,
L.
and
Kotzab
,
H.
(
2021
), “
Supply chain risk management und supply chain resilienz
”,
WiSt Wirtschaftswissenschaftliches Studium
, Vol. 
50
No. 
4
, pp. 
4
-
12
, doi: .
Bruckler
,
M.
,
Wietschel
,
L.
,
Messmann
,
L.
,
Thorenz
,
A.
and
Tuma
,
A.
(
2024
), “
Review of metrics to assess resilience capacities and actions for supply chain resilience
”,
Computers and Industrial Engineering
, Vol. 
192
, 110176, doi: .
Bruneau
,
M.
,
Chang
,
S.E.
,
Eguchi
,
R.T.
,
Lee
,
G.C.
,
O'Rourke
,
T.D.
,
Reinhorn
,
A.M.
,
Shinozuka
,
M.
,
Tierney
,
K.
,
Wallace
,
W.A.
and
von Winterfeldt
,
D.
(
2003
), “
A framework to quantitatively assess and enhance the seismic resilience of communities
”,
Earthquake Spectra
, Vol. 
19
No. 
4
, pp. 
733
-
752
, doi: .
Bryman
,
A.
(
2016
),
Social Research Methods
, (5th ed.) ,
Oxford University Press
,
Oxford
.
Burke
,
L.I.
and
Ignizio
,
J.P.
(
1992
), “
Neural networks and operations research: an overview
”,
Computers and Operations Research
, Vol. 
19
Nos
3-4
, pp. 
179
-
189
, doi: .
Carnovale
,
S.
,
DuHadway
,
S.
,
Patrucco
,
A.S.
and
Yeniyurt
,
S.
(
2025
), “
Balancing risk and resilience: how network structures and firm strategies mitigate supply chain disruptions
”,
International Journal of Physical Distribution and Logistics Management
, Vol. 
55
No. 
7
, pp.
761
-
790
, doi: .
Cerè
,
G.
,
Rezgui
,
Y.
and
Zhao
,
W.
(
2017
), “
Critical review of existing built environment resilience frameworks: directions for future research
”,
International Journal of Disaster Risk Reduction
, Vol. 
25
, pp. 
173
-
189
, doi: .
Chopra
,
S.
and
Sodhi
,
M.S.
(
2014
),
Reducing the Risk of Supply Chain Disruptions
,
MIT Sloan Management Review
,
London
.
Chowdhury
,
M.M.H.
and
Quaddus
,
M.
(
2017
), “
Supply chain resilience: conceptualization and scale development using dynamic capability theory
”,
International Journal of Production Economics
, Vol. 
188
, pp. 
185
-
204
, doi: .
Cimellaro
,
G.P.
,
Fumo
,
C.
,
Reinhorn
,
A.
and
Bruneau
,
M.
(
2009
), “Das Forschungsdesign dieser Studie basiert auf einem qualitativen Multi-Methoden-Ansatz, der einen systematischen Literatur-Review mit Workshops mit Experten kombiniert. Der Literatur-Review dient dazu, theoretische Grundlagen sowie die zentralen Komponenten des angestrebten Rahmenwerk für das Supplier Assessments zu identifizieren”, in
In den Experten-Workshops werden die aus der Literatur erhobenen Komponenten sowie deren Aufbau anschließend auf ihre Praxisrelevanz geprüft und validiert. Dieser Ansatz verbindet Theorie und Empirie, indem er wissenschaftlich fundierte Inhalte durch die praktische Perspektive von Experten unterschiedlicher Industiebranchen ergänzt
,
MCEER University at Buffalo, State University of New York
, No. 
10
,
Technical Report MCEER-09-0009
.
Craighead
,
C.W.
and
Ketchen
,
D.J.
(
2024
), “
Energizing a literature review to boldly go where no one has gone before
”,
Journal of Business Logistics
, Vol. 
45
No. 
2
, e12377, doi: .
Creswell
,
J.W.
and
Plano Clark
,
V.L.
(
2018
),
Designing and Conducting Mixed Methods Research
, Vol. 
3
,
SAGE Publications
,
Thousand Oaks
.
Culot
,
G.
,
Podrecca
,
M.
and
Nassimbeni
,
G.
(
2024
), “
Artificial intelligence in supply chain management: a systematic literature review of empirical studies and research directions
”,
Computers in Industry
, Vol. 
162
, 104132, doi: .
Dolgui
,
A.
,
Ivanov
,
D.
and
Sokolov
,
B.
(
2018
), “
Ripple effect in the supply chain: an analysis and recent literature
”,
International Journal of Production Research
, Vol. 
56
Nos
1-2
, pp. 
414
-
430
, doi: .
Dubey
,
R.
,
Gunasekaran
,
A.
,
Wamba
,
S.F.
,
Childe
,
S.J.
,
Roubaud
,
D.
and
Foropon
,
C.
(
2019
), “
Empirical investigation of data analytics capability and organizational flexibility as complements to supply chain resilience
”,
International Journal of Production Research
, Vol. 
59
No. 
3
, pp. 
110
-
128
, doi: .
Dubey
,
R.
,
Bryde
,
D.J.
,
Dwivedi
,
Y.K.
,
Graham
,
G.
,
Foropon
,
C.
and
Papadopoulos
,
T.
(
2023
), “
Dynamic digital capabilities and supply chain resilience: the role of government effectiveness
”,
International Journal of Production Economics
, Vol. 
258
, 108790, doi: .
Durach
,
C.F.
,
Kembro
,
J.
and
Wieland
,
A.
(
2017
), “
A new paradigm for systematic literature reviews in supply chain management
”,
Journal of Supply Chain Management
, Vol. 
53
No. 
4
, pp. 
67
-
85
, doi: .
Euler
,
L.
(
1736
), “
Comm. Acad. Science. Imp. Petrop
.”, Vol. 
8
, pp. 
128
-
140
.
Fattahi
,
M.
and
Govindan
,
K.
(
2022
), “
Data-driven rolling horizon approach for dynamic design of supply chain distribution networks under disruption and demand uncertainty
”,
Decision Sciences
, Vol. 
53
No. 
1
, pp. 
150
-
180
, doi: .
Guntuka
,
L.
,
Carnovale
,
S.
and
Falcone
,
E.
(
2024
), “
Supply chain plasticity: a responsive network capability to ensure resilience
”,
Journal of Business Logistics
, Vol. 
45
No. 
4
, e12398, doi: .
Guo
,
Y.
,
Liu
,
F.
,
Song
,
J.-S.
and
Wang
,
S.
(
2025
), “
Supply chain resilience: a review from the inventory management perspective
”,
Fundamental Research
, Vol. 
5
No. 
2
, pp. 
450
-
463
, doi: .
Hajarath
,
K.
and
Vummadi
,
J.
(
2024
), “
Enhancing supply chain resilience: proactive strategies for disruptive events
”,
International Journal of Supply Chain Management
, Vol. 
9
No. 
3
, pp. 
1
-
11
, doi: .
Han
,
N.
and
Um
,
J.
(
2024
), “
Risk management strategy for supply chain sustainability and resilience capability
”,
Risk Management
, Vol. 
26
No. 
2
, p.
6
, doi: .
Hendriksen
,
C.
(
2023
), “
Artificial intelligence for supply chain management: disruptive innovation or innovative disruption?
”,
Journal of Supply Chain Management
, Vol. 
59
No. 
3
, pp. 
65
-
76
, doi: .
Hohenstein
,
N.-O.
,
Feisel
,
E.
,
Hartmann
,
E.
and
Giunipero
,
L.
(
2015
), “
Research on the phenomenon of supply chain resilience
”,
International Journal of Physical Distribution and Logistics Management
, Vol. 
45
Nos
1/2
, pp. 
90
-
117
, doi: .
ISO
(
2018
),
ISO 31000:2018 – Risk Management – Guidelines
,
International Organization for Standardization (ISO)
,
Geneva
.
Ivanov
,
D.
(
2018
),
Structural Dynamics and Resilience in Supply Chain Risk Management
,
Springer
,
Berlin
.
Ivanov
,
D.
(
2020
), “
Viable supply chain model: integrating agility, resilience and sustainability perspectives–lessons from and thinking beyond the COVID-19 pandemic
”,
Annals of Operations Research
, Vol. 
319
, pp.
1411
-
1431
, doi: .
Ivanov
,
D.
(
2023
), “
Intelligent digital twin (iDT) for supply chain stress-testing, resilience, and viability
”,
International Journal of Production Economics
, Vol. 
263
, 108938, doi: .
Ivanov
,
D.
(
2025
), “
What network and performance indicators can tell us about supply chain and sourcing resilience (and what they cannot)
”,
Journal of Purchasing and Supply Management
, Vol. 
31
No. 
3
, 101014, doi: .
Ivanov
,
D.
and
Dolgui
,
A.
(
2021
), “
A digital supply chain twin for managing the disruption risks and resilience in the era of Industry 4.0
”,
Production Planning and Control
, Vol. 
32
No. 
9
, pp. 
775
-
788
, doi: .
Kamble
,
S.S.
,
Gunasekaran
,
A.
,
Parekh
,
H.
,
Mani
,
V.
,
Belhadi
,
A.
and
Sharma
,
R.
(
2022
), “
Digital twin for sustainable manufacturing supply chains: current trends, future perspectives, and an implementation framework
”,
Technological Forecasting and Social Change
, Vol. 
176
, 121448, doi: .
Kembro
,
J.
,
Selviaridis
,
K.
and
Naslund
,
D.
(
2014
), “
Theoretical perspectives on information sharing in supply chains: a systematic literature review and conceptual framework
”,
Supply Chain Management An International Journal
, Vol. 
19
Nos
5/6
, pp. 
609
-
625
, doi: .
Kim
,
Y.
,
Chen
,
Y.-S.
and
Linderman
,
K.
(
2015
), “
Supply network disruption and resilience: a network structural perspective
”,
Journal of Operations Management
, Vol. 
33
No. 
34
, pp. 
43
-
59
, doi: .
Kinra
,
A.
,
Ivanov
,
D.
,
Das
,
A.
and
Dolgui
,
A.
(
2020
), “
Ripple effect quantification by supplier risk exposure assessment
”,
International Journal of Production Research
, Vol. 
58
No. 
18
, pp. 
5559
-
5578
, doi: .
Koberg
,
E.
and
Longoni
,
A.
(
2018
), “
A systematic review of sustainable supply chain management in global supply chains
”,
Journal of Cleaner Production
, Vol. 
207
, pp.
1084
-
1098
, doi: .
Kumar
,
S.
,
Himes
,
K.J.
and
Kritzer
,
C.P.
(
2014
), “
Risk assessment and operational approaches to managing risk in global supply chains
”,
Journal of Manufacturing Technology Management
, Vol. 
25
No. 
6
, pp. 
873
-
890
, doi: .
Li
,
Y.
and
Zobel
,
C.W.
(
2020
), “
Exploring supply chain network resilience in the presence of the ripple effect
”,
International Journal of Production Economics
, Vol. 
228
, 107693, doi: .
Li
,
F.
,
Wu
,
C.-H.
,
Zhou
,
L.
,
Xu
,
G.
,
Liu
,
Y.
and
Tsai
,
S.-B.
(
2021
), “
A model integrating environmental concerns and supply risks for dynamic sustainable supplier selection and order allocation
”,
Soft Computing
, Vol. 
25
No. 
1
, pp. 
535
-
549
, doi: .
Lücker
,
F.
,
Timonina-Farkas
,
A.
and
Seifert
,
R.W.
(
2024
), “
Balancing resilience and efficiency: a literature review on overcoming supply chain disruptions
”,
Production and Operations Management
, Vol. 
34
No. 
6
, pp. 
1495
-
1511
, doi: .
Manuj
,
I.
and
Mentzer
,
J.T.
(
2008
), “
Global supply chain risk management
”,
Journal of Business Logistics
, Vol. 
29
No. 
1
, pp. 
133
-
155
, doi: .
Norrman
,
A.
and
Jansson
,
U.
(
2004
), “
Ericsson's proactive supply chain risk management approach after a serious sub-supplier accident
”,
International Journal of Physical Distribution and Logistics Management
, Vol. 
34
No. 
5
, pp. 
434
-
456
, doi: .
Öztek
,
G.
and
Kabak
,
M.
(
2022
), “
A multi-criteria approach to sustainable risk management of supplier portfolio: a case study at defense industry
”,
Gazi University Journal of Science
, Vol. 
35
No. 
4
, pp. 
1504
-
1519
, doi: .
Patrício
,
L.D.
,
Ferreira
,
J.J.
and
Gerschewski
,
S.
(
2025
), “
A network of networks: building resilience in the globalised era
”,
Global Networks
, Vol. 
25
No. 
3
, e70014, doi: .
Pettit
,
T.J.
,
Fiksel
,
J.
and
Croxton
,
K.L.
(
2010
), “
Ensuring supply chain resilience: development of a conceptual framework
”,
Journal of Business Logistics
, Vol. 
31
No. 
1
, pp. 
1
-
21
, doi: .
Pettit
,
T.J.
,
Croxton
,
K.L.
and
Fiksel
,
J.
(
2013
), “
Ensuring supply chain resilience: development and implementation of an assessment tool
”,
Journal of Business Logistics
, Vol. 
34
No. 
1
, pp. 
46
-
76
, doi: .
Pettit
,
T.J.
,
Croxton
,
K.L.
and
Fiksel
,
J.
(
2019
), “
The evolution of resilience in supply chain management: a retrospective on ensuring supply chain resilience
”,
Journal of Business Logistics
, Vol. 
40
No. 
1
, pp. 
56
-
65
, doi: .
Ponomarov
,
S.Y.
and
Holcomb
,
M.C.
(
2009
), “
Understanding the concept of supply chain resilience
”,
The International Journal of Logistics Management
, Vol. 
20
No. 
1
, pp. 
124
-
143
, doi: .
Rahman
,
T.
,
Paul
,
S.K.
,
Shukla
,
N.
,
Agarwal
,
R.
and
Taghikhah
,
F.
(
2022
), “
Supply chain resilience initiatives and strategies: a systematic review
”,
Computers and Industrial Engineering
, Vol. 
170
, 108317, doi: .
Rethlefsen
,
M.L.
and
Page
,
M.J.
(
2022
), “
PRISMA 2020 and PRISMA-S: common questions on tracking records and the flow diagram
”,
Journal of the Medical Library Association
, Vol. 
110
No. 
2
, pp. 
253
-
257
, doi: .
Sawik
,
T.
(
2013
), “
Selection of resilient supply portfolio under disruption risks
”,
Omega
, Vol. 
41
No. 
2
, pp. 
259
-
269
, doi: .
Smith
,
P.
,
Hutchison
,
D.
,
Sterbenz
,
J.P.G.
,
Schöller
,
M.
,
Fessi
,
A.
,
Karaliopoulos
,
M.
,
Lac
,
C.
and
Plattner
,
B.
(
2011
), “
Network resilience: a systematic approach
”,
IEEE Communications Magazine
, Vol. 
49
No. 
7
, pp. 
88
-
97
, doi: .
Torres-Ruiz
,
A.
and
Ravindran
,
A.R.
(
2018
), “
Multiple criteria framework for the sustainability risk assessment of a supplier portfolio
”,
Journal of Cleaner Production
, Vol. 
172
, pp. 
4478
-
4493
, doi: .
Tummala
,
R.
and
Schoenherr
,
T.
(
2011
), “Assessing and managing risks using the supply chain risk management process (SCRMP)”,
edited by Xie, C.
,
Supply Chain Management: An International Journal
, Vol. 
16
No. 
6
, pp. 
474
-
483
, doi: .
Urbaniak
,
M.
,
Zimon
,
D.
,
Madzik
,
P.
and
Šírová
,
E.
(
2022
), “
Risk factors in the assessment of suppliers
”,
PLoS One
, Vol. 
17
No. 
8
, 0272157, doi: .
van Hoek
,
R.
and
Wong
,
C.
(
2025
), “
Transformative and disruptive or incremental time wrinkles? How to advance thinking and practice in supply chain sustainability, risk management and digitalization
”,
International Journal of Physical Distribution and Logistics Management
, Vol. 
55
No. 
4
, pp. 
311
-
340
, doi: .
Wagner
,
S.M.
and
Bode
,
C.
(
2008
), “
An empirical examination of supply chain performance along several dimensions of risk
”,
Journal of Business Logistics
, Vol. 
29
No. 
1
, pp. 
307
-
325
, doi: .
Wiedenmann
,
M.
and
Größler
,
A.
(
2021
), “
Supply risk identification in manufacturing supply networks
”,
The International Journal of Logistics Management
, Vol. 
32
No. 
2
, pp. 
650
-
672
, doi: .
Wieland
,
A.
and
Wallenburg
,
C.M.
(
2012
), “
Dealing with supply chain risks: linking risk management practices and strategies to performance
”,
International Journal of Physical Distribution and Logistics Management
, Vol. 
42
No. 
10
, pp. 
887
-
905
, doi: .
Wortmann
(
2023
),
Effektive Methoden Der Literaturauswahl Und-Bewertung Für Wissenschaftliche Arbeiten - Ein Leitfaden Für Theoretische Literaturarbeiten, Abschlussarbeiten Und Hausarbeiten
,
IHRO – Institut für Human Resource Management und Organisationspsychologie
,
Hamburg
.
Yang
,
C.
,
Tian
,
K.
and
Gao
,
X.
(
2023
), “
Supply chain resilience: measure, risk assessment and strategies
”,
Fundamental Research
, Vol. 
5
No. 
2
, pp. 
4
-
436
, doi: .
Zsidisin
,
G.A.
(
2003
), “
A grounded definition of supply risk
”,
Journal of Purchasing and Supply Management
, Vol. 
9
Nos
5-6
, pp. 
217
-
224
, doi: .
Published by Emerald Publishing Limited. This article is published under the Creative Commons Attribution (CC BY 4.0) licence. Anyone may reproduce, distribute, translate and create derivative works of this article (for both commercial and non-commercial purposes), subject to full attribution to the original publication and authors. The full terms of this licence may be seen at Link to the terms of the CC BY 4.0 licence.

Supplementary data

Data & Figures

Figure 1
A supply chain network diagram shows the upstream flow from tier N to O E M.The diagram depicts a directed network in which material and supply relationships flow from left to right. The structure is divided into four vertical sections separated by dashed lines, representing different tiers of the supply chain. In the left section (“Tier N”), a large number of nodes are shown, predominantly in grey. These represent numerous upstream suppliers. From these nodes, multiple arrows lead to a smaller group of nodes in the adjacent section. These nodes are mainly colored blue, while some are highlighted in orange, indicating specific characteristics or potential risk positions. The connections are not linear but become increasingly aggregated: many upstream nodes are connected to fewer downstream nodes, resulting in a progressive densification of the network structure toward the right. In the “Tier 1” section, the number of nodes is further reduced, and connections increasingly concentrate on a limited number of elements. On the far right, the network terminates in a single large rectangle (“O E M”), which collects all incoming connections. This element represents the focal company, where all upstream flows converge and from which supplier evaluation is conducted. An arrow labeled “Upstream” above the diagram indicates the overall direction of flow within the supply chain. Overall, the figure illustrates a typical multi-tier supply network with a many-to-one structure, where potential bottlenecks or risk nodes are highlighted through color differentiation.

Multi-tier supplier network structure illustrating upstream propagation of risks. Authors' own elaboration

Figure 1
A supply chain network diagram shows the upstream flow from tier N to O E M.The diagram depicts a directed network in which material and supply relationships flow from left to right. The structure is divided into four vertical sections separated by dashed lines, representing different tiers of the supply chain. In the left section (“Tier N”), a large number of nodes are shown, predominantly in grey. These represent numerous upstream suppliers. From these nodes, multiple arrows lead to a smaller group of nodes in the adjacent section. These nodes are mainly colored blue, while some are highlighted in orange, indicating specific characteristics or potential risk positions. The connections are not linear but become increasingly aggregated: many upstream nodes are connected to fewer downstream nodes, resulting in a progressive densification of the network structure toward the right. In the “Tier 1” section, the number of nodes is further reduced, and connections increasingly concentrate on a limited number of elements. On the far right, the network terminates in a single large rectangle (“O E M”), which collects all incoming connections. This element represents the focal company, where all upstream flows converge and from which supplier evaluation is conducted. An arrow labeled “Upstream” above the diagram indicates the overall direction of flow within the supply chain. Overall, the figure illustrates a typical multi-tier supply network with a many-to-one structure, where potential bottlenecks or risk nodes are highlighted through color differentiation.

Multi-tier supplier network structure illustrating upstream propagation of risks. Authors' own elaboration

Close modal
Figure 2
A circular process diagram shows steps of assessing supply networks in three stages.The diagram illustrates a circular, iterative process consisting of three main steps, represented by rectangular boxes connected with curved arrows. At the top is the box labeled “Overall assessment of supply networks.” From this box, a curved arrow leads downward to the right toward the box labeled “Decomposition into nodes and edges.” A small circle labeled “1” is placed next to this arrow, indicating the first step in the process. From “Decomposition into nodes and edges,” another curved arrow continues toward the left and slightly upward, leading to the box labeled “Assessment of single nodes and edges.” A nearby circle labeled “3” marks this step. From “Assessment of single nodes and edges,” a third curved arrow points upward and to the left, returning to the starting point “Overall assessment of supply networks.” A circle labeled “2” is positioned along this arrow. The arrows form a closed loop, indicating that the process is iterative. Overall, the diagram conveys a cyclical methodology in which a global assessment is broken down into components, analyzed at a detailed level, and then reintegrated into an updated overall evaluation.

Conceptual logic of the node-based assessment cycle. Authors' own elaboration

Figure 2
A circular process diagram shows steps of assessing supply networks in three stages.The diagram illustrates a circular, iterative process consisting of three main steps, represented by rectangular boxes connected with curved arrows. At the top is the box labeled “Overall assessment of supply networks.” From this box, a curved arrow leads downward to the right toward the box labeled “Decomposition into nodes and edges.” A small circle labeled “1” is placed next to this arrow, indicating the first step in the process. From “Decomposition into nodes and edges,” another curved arrow continues toward the left and slightly upward, leading to the box labeled “Assessment of single nodes and edges.” A nearby circle labeled “3” marks this step. From “Assessment of single nodes and edges,” a third curved arrow points upward and to the left, returning to the starting point “Overall assessment of supply networks.” A circle labeled “2” is positioned along this arrow. The arrows form a closed loop, indicating that the process is iterative. Overall, the diagram conveys a cyclical methodology in which a global assessment is broken down into components, analyzed at a detailed level, and then reintegrated into an updated overall evaluation.

Conceptual logic of the node-based assessment cycle. Authors' own elaboration

Close modal
Figure 3
A flow diagram shows supplier risk search, filtering steps, and final research focus categories.The diagram presents a multi-stage, vertically structured process for systematic literature selection and analysis in the field of supplier risk assessment. On the left side, a vertical label reads “Database Scopus and Web of Science,” indicating the data sources used. At the top, three horizontal search blocks are displayed and connected through logical operators. The first block (“Topic”) contains search terms related to frameworks for supplier risk assessment. Below, two additional blocks labeled “All Fields” are connected with “A N D.” These include search terms related to supplier assessment as well as risk dimensions, risk factors, and risk indicators. A downward arrow leads to the central section labeled “Exploration, Consolidation, Categorization,” where the progressive refinement of results is shown: First, “29 frameworks” are identified. These expand into “60 risk dimensions, 224 risk factors, 682 risk indicators.” The results are then reduced to “33 risk dimensions, 70 risk factors, 294 risk indicators.” Finally, they are further structured into “26 internal, 7 external dimensions” and “167 upstream, 127 downstream indicators.” From this final stage, the process branches into three possible conceptual directions: Left: “Focus on single industries” development of a concept applicable to individual industrial sectors. Center: “Focus on single risks” development of a concept covering a broad range of potential risks arising from suppliers and shipping processes. Right: “Overall resilience” a node-based approach in which individual suppliers are assessed and aggregated to determine overall resilience. Overall, the diagram illustrates a structured process of literature selection, consolidation, and categorization that leads to different conceptual approaches for evaluating supply chain risks.

Structure of review methodology adapted from Wiedenmann and Größler (2021)

Figure 3
A flow diagram shows supplier risk search, filtering steps, and final research focus categories.The diagram presents a multi-stage, vertically structured process for systematic literature selection and analysis in the field of supplier risk assessment. On the left side, a vertical label reads “Database Scopus and Web of Science,” indicating the data sources used. At the top, three horizontal search blocks are displayed and connected through logical operators. The first block (“Topic”) contains search terms related to frameworks for supplier risk assessment. Below, two additional blocks labeled “All Fields” are connected with “A N D.” These include search terms related to supplier assessment as well as risk dimensions, risk factors, and risk indicators. A downward arrow leads to the central section labeled “Exploration, Consolidation, Categorization,” where the progressive refinement of results is shown: First, “29 frameworks” are identified. These expand into “60 risk dimensions, 224 risk factors, 682 risk indicators.” The results are then reduced to “33 risk dimensions, 70 risk factors, 294 risk indicators.” Finally, they are further structured into “26 internal, 7 external dimensions” and “167 upstream, 127 downstream indicators.” From this final stage, the process branches into three possible conceptual directions: Left: “Focus on single industries” development of a concept applicable to individual industrial sectors. Center: “Focus on single risks” development of a concept covering a broad range of potential risks arising from suppliers and shipping processes. Right: “Overall resilience” a node-based approach in which individual suppliers are assessed and aggregated to determine overall resilience. Overall, the diagram illustrates a structured process of literature selection, consolidation, and categorization that leads to different conceptual approaches for evaluating supply chain risks.

Structure of review methodology adapted from Wiedenmann and Größler (2021)

Close modal
Table 1

Positioning of this study within the SCRM resilience network literature

Stream of prior researchRemaining research gapContribution of this study
SCRM frameworks (Carnovale et al., 2025; Manuj and Mentzer, 2008; Norrman and Jansson, 2004; Tummala and Schoenherr, 2011)Supplier risk frameworks focus on risk identification and mitigation but neglect how firm-specific resource configurations shape vulnerability and recovery at the supplier levelIntegrates resilience capabilities (robustness, redundancy, resourcefulness, rapidity) directly into supplier risk evaluation
Resilience assessment models (Guntuka et al., 2024; Guo et al., 2025; Pettit et al., 2013, 2019; Wieland and Wallenburg, 2012)Existing resilience models remain conceptual and lack measurable indicators for empirical assessmentTranslates resilience-related capabilities into operational indicators derived from literature and expert validation
Network and propagation studies (Chopra and Sodhi, 2014; Dolgui et al., 2018; Ivanov, 2018; Kim et al., 2015)Prior research models disruption propagation but overlooks supplier heterogeneity and resource-based vulnerabilitiesIntroduces a supplier-focused perspective linking vulnerability to underlying resource configurations
Quantitative methods (Bai et al., 2025; Hohenstein et al., 2015; Pettit et al., 2010; Sawik, 2013)Often emphasize performance or efficiency metrics without considering resilience as a resource-based capabilityProvides a risk-adjusted evaluation logic integrating preventive and reactive indicators
Emerging digital and ESG frameworks (Baryannis et al., 2019; Dubey et al., 2019; Koberg and Longoni, 2018)Digital and ESG frameworks emphasize transparency but lack a resource-based foundation linking traceability and resilienceEstablishes a foundation for integrating RBV-based indicators into digital-twin or ESG-compliance systems
Source(s): Authors' own elaboration
Table 2

First proposed structure, which was also discussed in the first workshop

Risk dimensionCharacteristicsFactors
OrganizationIT
  • Stability of the IT system

  • Data protection

  • Vulnerability of the IT system (cyber-attacks)

Quality management
  • Stability of the business processes

  • Sustainability of the business processes

Social standards
  • Compliance with social standards

  • Occupational health and safety/health management

Ecological standards
  • CO2 footprint

  • Prohibited substances (PFAS/REACH and RoHS)

  • Energy and resource efficiency and recycling

Cooperation and communication
  • Quality of the interface

  • Quality of communication

  • Quality of the IT interface (tech.)

LocalizationEnvironment
  • Location in endangered area (natural disasters)

Health
  • Situation in vulnerable area (infectious diseases)

Politics
  • Political stability in the country

  • Economic stability (currency)

  • Customs and trade

  • Administrative stability/integrity

Society
  • Compliance with international standards (human rights/labor protection)

  • Strike culture

Infrastructure
  • Reliability of energy supply

  • Logistics infrastructure

OperationsSourcing
  • Procurement strategy

  • Transparency of sourcing

Production
  • Process quality

  • Stability of production processes

  • Transparency/redundancy of production processes

Outbound logistics
  • Stability of outbound logistics

Long-termStrategic importance
  • Strategic importance of the supplier for the company

CorporateOwnership structure
  • Ownership structure

  • Management structure

GovernanceFinancial situation
  • Liquidity

  • Reputation

Source(s): Authors' own elaboration
Table 3

Core structure of the supplier risk assessment framework: dimensions, risk factors, indicators, and information

Upstream indicatorDownstream indicator
DimensionCategoryFactorWeightIndicatorInformation sourcesIndicatorInformation sources
LocationEnvironment and HealthLocation in endangered area (natural disaster, war) Existence of company-specific strategies (e.g. Business continuity management System ISO 22301)News, investor relations, websiteNumber of previous disruptions (last 3 years)News, global official indices
Situation in vulnerable area (infectious diseases, pandemic) Existence of company-specific strategies (e.g. Business Continuity Management System ISO 22301)News, investor relations, websiteNumber of previous disruptions (last 3 years)News, global official indices
PoliticsPolitical stability in the country Current political anomalies/crisis eventsOwn evaluation, news, official indicesPolitical Stability Index (World Bank Index)World Bank/World Governance Indicators (Political Stability)
Economic stability (currency) Current anomalies regarding central bank strategyOwn evaluation, news, official indicesCredit ranking countryCountry Credit Ranking (e.g. World Bank/IMF/Rating Agencies)
Customs and trade Current anomalies regarding trade restrictionsOwn evaluation, news, official indicesRegulatory Quality Index (World Bank Index)World Bank/Worldwide Governance Indicators (Regulatory Quality)
Administrative stability/integrity Current anomalies/eventsOwn evaluation, news, official indicesControl of Corruption Index (World Bank Index)World Bank/Worldwide Governance Indicators (Control of Corruption)
SocietyCompliance with international standards (human rights/labor protection) Current anomalies/eventsOwn evaluation, news, official indicesFreedom IndexFreedom House
Strike culture   Number of strike-related disruptions (last 3 years)News, global official indices
InfrastructureReliability of energy supply   Number of disruptions due to energy shortages (last 3 years)News, global official indices
Logistics infrastructure Existence of critical transport routesIndustry alliance query, investor relationsDelays or cancellations due to infrastructure problemsNews, global official indices
OrganizationITStability of the IT system Use of standard software (ERP/MRP systems)Investor relations, websiteNumber of known IT outages (last 3 years)News, global official indices, query
Data protection ISO/IEC 27001 and ISO/IEC 27002, ISO/IEC 90003, regular internal data protection trainingInvestor relations, website  
Vulnerability of the IT system (cyber-attacks) Certification in accordance with ISO 27001/27701, ISO 22301 or other action plansInvestor relations, websiteNumber of known IT outages due to external attacks (last 3 years)News, global official indices, query
QMStability of the business processes Certification in accordance with ISO 9001 or industry-specific standardsInvestor relations, websiteInternal quality control processes and metrics (according to own QM assessment)Own evaluation, industry alliance query
Sustainability of the business processes Certification in accordance with ISO 14.001/Life Cycle Assessment (ISO 14040/44)/EMAS/ISO 50001/Energy audits (ISO 16247)   
Social standardsCompliance with social standards Certification according to SA 8000/BSCI/SMTA/BRGS ETRS RA Compliance violations and ethical scandals (last 3 years)News
Occupational health and safety/Health management Certification according to ISO 45001 or SCC Negative public statements (last 3 years)News
Ecological standardsCO2 footprint NFRD/CSRD   
Prohibited substances (PFAS/REACH and RoHS) Identify affected materials, RoHS Directive   
Energy and resource efficiency and recycling ESPR, AW, EfbV, NachwV (depending on necessity)   
Cooperation and communicationQuality of the interface (orga.)   Quality of contract people (dependability/language)Own evaluation
Quality of communication (orga.)   Average response timeIndustry alliance query, own evaluation
Quality of the IT interface (tech.) Primary communication mediumIndustry alliance query, investor relationsData transmission errorsOwn evaluation
OperationsSourcingProcurement strategy Single/dual/multi-sourceIndustry alliance query, investor relationsNumber of advance service-related delivery failures (last 3 years)Industry alliance query, own evaluation
Transparency Disclosure of upstream sourcesIndustry alliance query, investor relationsNumber of known production-related delivery failures/delays (last 3 years)Industry alliance query, own evaluation
ProductionProcess quality Existence of QM system (ISO 9001 and/or industry-specific)Investor relations, websiteDelivery reliability (quality ppm) (last 3 years)Industry alliance query, own evaluation
 Certification according to DIN EN ISO 14001Investor relations, website  
Stability of production processes Existence of dedicated management concepts (e.g. production system)Investor relations, websiteDisclosure of internal quality indicators (rejected rate, …)Industry alliance query, own evaluation
 Existence of emergency plans for productionInvestor relations, website  
Transparency/Redundancy Transparency of production location (in case of multiple locations)Investor relations, website  
 Existence of redundant capacities (plants, lines)Investor relations, website  
Outbound logisticsStability of outbound logistics Reliability of transport logistics (harbor, airport)Industry alliance query, investor relations, own evaluation  
 Logistical structure on the supplier's siteIndustry alliance query, investor relations, own evaluationNumber of logistics-related delivery failures (last 3 years)Industry alliance query, own evaluation
 Potential use of different transport mediaIndustry alliance query, investor relations, own evaluation  
Long-term, corporate governanceStrategic importanceStrategic importance of the supplier for the company Existence of independent companies with comparable expertise in the marketFinancial data providerPublic relations/investor relationsInvestor relations
Ownership structureOwnership structure Critical majority owner (e.g. financial investor or origin from critical countries)Official database, financial data provider  
Management structure Distribution of management responsibilityFinancial data provider, Industry alliance query  
 Stability in the company managementIndustry alliance query, news, financial data provider  
Financial situationLiquidity RatingDun & Bradstreet, S&P Rating, financial data provider, credit reform SCHUFA  
Source(s): Authors' own elaboration based on literature review and expert validation
Table 4

Future research agenda for supplier risk and resilience assessment

Research streamGuiding future research questionsCandidate theoriesRecommended methodological approaches
ValidationHow well do distinct configurations of anticipatory and responsive supplier capabilities predict disruption exposure and resilience outcomes (e.g. time-to-recover, time-to-survive, performance persistence) across industries, beyond the explanatory power of traditional risk and cost factors?Resource-Based View (RBV); Institutional Theory (across industry comparability)Large-scale surveys; Regression analysis; Structural Equation Modeling (SEM); Confirmatory Factor Analysis (CFA)
 How do learning effects after disruptions and path-dependent capability investments (e.g. in redundancy vs. information-sharing) alter supplier capability trajectories and their impact on network-level disruption propagation and plasticity?Dynamic Capabilities Theory (DCT); Information Processing Theory (OIPT)SD simulation; ABM modeling; Network analysis; Longitudinal Empirical studies
EvaluationWhat are the cost-benefit trade-offs of resilience measures from a managerial decision perspective?Transaction Cost Economics (TCE); Behavioral Decision Theory (BDT)Multi-objective optimization; Sensitivity analysis; Scenario experiments
ExtensionHow can digital twins and hybrid simulation models integrate supplier-level indicators with network structure and disruption scenarios to test how alternative capability configurations and governance strategies affect plasticity metrics?Information Processing Theory (OIPT); Socio-Technical Systems Theory (STS)Machine Learning; Digital Twin simulation; Hybrid simulation (SD + ABM); Big Data Analytics
 Which additional dimensions or attributes should supplier evaluation frameworks incorporate to better support managerial decision-making under uncertainty?Decision Support Systems (DSS) Theory; Behavioral Decision Theory (BDT); Cognitive Fit TheoryQualitative Expert Interviews/Delphi-Studies; Mixed-Methods (Survey + Experiment); Decision Experiments/Simulation Games
Source(s): Authors' own elaboration

Contents

Supplements

Supplementary data

References

Adobor
,
H.
and
McMullen
,
R.S.
(
2018
), “
Supply chain resilience: a dynamic and multidimensional approach
”,
The International Journal of Logistics Management
, Vol. 
29
No. 
29
, pp. 
1451
-
1471
, doi: .
Ahmadian
,
N.
,
Lim
,
G.J.
,
Cho
,
J.
and
Bora
,
S.
(
2020
), “
A quantitative approach for assessment and improvement of network resilience
”,
Reliability Engineering and System Safety
, Vol. 
200
, 106977, doi: .
Ambulkar
,
S.
,
Blackhurst
,
J.
and
Grawe
,
S.
(
2015
), “
Firm's resilience to supply chain disruptions: scale development and empirical examination
”,
Journal of Operations Management
, Vols
33-34
No. 
1
, pp. 
111
-
122
, doi: .
Bai
,
H.
,
Chen
,
Y.
and
Zhang
,
Z.
(
2025
), “
Exploring the mitigating role of sustainable innovation in supply chain disruption risks under the digital economy
”,
International Review of Economics and Finance
, Vol. 
103
, 104372, doi: .
Barney
,
J.
(
1991
), “
Firm resources and sustained competitive advantage
”,
Journal of Management
, Vol. 
17
No. 
1
, pp. 
99
-
120
, doi: .
Baryannis
,
G.
,
Dani
,
S.
,
Validi
,
S.
and
Antoniou
,
G.
(
2019
), “Decision support systems and artificial intelligence in supply chain risk management”, in
Zsidisin
,
G.A.
and
Henke
,
M.
(Eds),
Revisiting Supply Chain Risk
,
Springer International Publishing
,
Cham
, Vol. 
7
, pp. 
53
-
71
, doi: .
Biedermann
,
L.
and
Kotzab
,
H.
(
2021
), “
Supply chain risk management und supply chain resilienz
”,
WiSt Wirtschaftswissenschaftliches Studium
, Vol. 
50
No. 
4
, pp. 
4
-
12
, doi: .
Bruckler
,
M.
,
Wietschel
,
L.
,
Messmann
,
L.
,
Thorenz
,
A.
and
Tuma
,
A.
(
2024
), “
Review of metrics to assess resilience capacities and actions for supply chain resilience
”,
Computers and Industrial Engineering
, Vol. 
192
, 110176, doi: .
Bruneau
,
M.
,
Chang
,
S.E.
,
Eguchi
,
R.T.
,
Lee
,
G.C.
,
O'Rourke
,
T.D.
,
Reinhorn
,
A.M.
,
Shinozuka
,
M.
,
Tierney
,
K.
,
Wallace
,
W.A.
and
von Winterfeldt
,
D.
(
2003
), “
A framework to quantitatively assess and enhance the seismic resilience of communities
”,
Earthquake Spectra
, Vol. 
19
No. 
4
, pp. 
733
-
752
, doi: .
Bryman
,
A.
(
2016
),
Social Research Methods
, (5th ed.) ,
Oxford University Press
,
Oxford
.
Burke
,
L.I.
and
Ignizio
,
J.P.
(
1992
), “
Neural networks and operations research: an overview
”,
Computers and Operations Research
, Vol. 
19
Nos
3-4
, pp. 
179
-
189
, doi: .
Carnovale
,
S.
,
DuHadway
,
S.
,
Patrucco
,
A.S.
and
Yeniyurt
,
S.
(
2025
), “
Balancing risk and resilience: how network structures and firm strategies mitigate supply chain disruptions
”,
International Journal of Physical Distribution and Logistics Management
, Vol. 
55
No. 
7
, pp.
761
-
790
, doi: .
Cerè
,
G.
,
Rezgui
,
Y.
and
Zhao
,
W.
(
2017
), “
Critical review of existing built environment resilience frameworks: directions for future research
”,
International Journal of Disaster Risk Reduction
, Vol. 
25
, pp. 
173
-
189
, doi: .
Chopra
,
S.
and
Sodhi
,
M.S.
(
2014
),
Reducing the Risk of Supply Chain Disruptions
,
MIT Sloan Management Review
,
London
.
Chowdhury
,
M.M.H.
and
Quaddus
,
M.
(
2017
), “
Supply chain resilience: conceptualization and scale development using dynamic capability theory
”,
International Journal of Production Economics
, Vol. 
188
, pp. 
185
-
204
, doi: .
Cimellaro
,
G.P.
,
Fumo
,
C.
,
Reinhorn
,
A.
and
Bruneau
,
M.
(
2009
), “Das Forschungsdesign dieser Studie basiert auf einem qualitativen Multi-Methoden-Ansatz, der einen systematischen Literatur-Review mit Workshops mit Experten kombiniert. Der Literatur-Review dient dazu, theoretische Grundlagen sowie die zentralen Komponenten des angestrebten Rahmenwerk für das Supplier Assessments zu identifizieren”, in
In den Experten-Workshops werden die aus der Literatur erhobenen Komponenten sowie deren Aufbau anschließend auf ihre Praxisrelevanz geprüft und validiert. Dieser Ansatz verbindet Theorie und Empirie, indem er wissenschaftlich fundierte Inhalte durch die praktische Perspektive von Experten unterschiedlicher Industiebranchen ergänzt
,
MCEER University at Buffalo, State University of New York
, No. 
10
,
Technical Report MCEER-09-0009
.
Craighead
,
C.W.
and
Ketchen
,
D.J.
(
2024
), “
Energizing a literature review to boldly go where no one has gone before
”,
Journal of Business Logistics
, Vol. 
45
No. 
2
, e12377, doi: .
Creswell
,
J.W.
and
Plano Clark
,
V.L.
(
2018
),
Designing and Conducting Mixed Methods Research
, Vol. 
3
,
SAGE Publications
,
Thousand Oaks
.
Culot
,
G.
,
Podrecca
,
M.
and
Nassimbeni
,
G.
(
2024
), “
Artificial intelligence in supply chain management: a systematic literature review of empirical studies and research directions
”,
Computers in Industry
, Vol. 
162
, 104132, doi: .
Dolgui
,
A.
,
Ivanov
,
D.
and
Sokolov
,
B.
(
2018
), “
Ripple effect in the supply chain: an analysis and recent literature
”,
International Journal of Production Research
, Vol. 
56
Nos
1-2
, pp. 
414
-
430
, doi: .
Dubey
,
R.
,
Gunasekaran
,
A.
,
Wamba
,
S.F.
,
Childe
,
S.J.
,
Roubaud
,
D.
and
Foropon
,
C.
(
2019
), “
Empirical investigation of data analytics capability and organizational flexibility as complements to supply chain resilience
”,
International Journal of Production Research
, Vol. 
59
No. 
3
, pp. 
110
-
128
, doi: .
Dubey
,
R.
,
Bryde
,
D.J.
,
Dwivedi
,
Y.K.
,
Graham
,
G.
,
Foropon
,
C.
and
Papadopoulos
,
T.
(
2023
), “
Dynamic digital capabilities and supply chain resilience: the role of government effectiveness
”,
International Journal of Production Economics
, Vol. 
258
, 108790, doi: .
Durach
,
C.F.
,
Kembro
,
J.
and
Wieland
,
A.
(
2017
), “
A new paradigm for systematic literature reviews in supply chain management
”,
Journal of Supply Chain Management
, Vol. 
53
No. 
4
, pp. 
67
-
85
, doi: .
Euler
,
L.
(
1736
), “
Comm. Acad. Science. Imp. Petrop
.”, Vol. 
8
, pp. 
128
-
140
.
Fattahi
,
M.
and
Govindan
,
K.
(
2022
), “
Data-driven rolling horizon approach for dynamic design of supply chain distribution networks under disruption and demand uncertainty
”,
Decision Sciences
, Vol. 
53
No. 
1
, pp. 
150
-
180
, doi: .
Guntuka
,
L.
,
Carnovale
,
S.
and
Falcone
,
E.
(
2024
), “
Supply chain plasticity: a responsive network capability to ensure resilience
”,
Journal of Business Logistics
, Vol. 
45
No. 
4
, e12398, doi: .
Guo
,
Y.
,
Liu
,
F.
,
Song
,
J.-S.
and
Wang
,
S.
(
2025
), “
Supply chain resilience: a review from the inventory management perspective
”,
Fundamental Research
, Vol. 
5
No. 
2
, pp. 
450
-
463
, doi: .
Hajarath
,
K.
and
Vummadi
,
J.
(
2024
), “
Enhancing supply chain resilience: proactive strategies for disruptive events
”,
International Journal of Supply Chain Management
, Vol. 
9
No. 
3
, pp. 
1
-
11
, doi: .
Han
,
N.
and
Um
,
J.
(
2024
), “
Risk management strategy for supply chain sustainability and resilience capability
”,
Risk Management
, Vol. 
26
No. 
2
, p.
6
, doi: .
Hendriksen
,
C.
(
2023
), “
Artificial intelligence for supply chain management: disruptive innovation or innovative disruption?
”,
Journal of Supply Chain Management
, Vol. 
59
No. 
3
, pp. 
65
-
76
, doi: .
Hohenstein
,
N.-O.
,
Feisel
,
E.
,
Hartmann
,
E.
and
Giunipero
,
L.
(
2015
), “
Research on the phenomenon of supply chain resilience
”,
International Journal of Physical Distribution and Logistics Management
, Vol. 
45
Nos
1/2
, pp. 
90
-
117
, doi: .
ISO
(
2018
),
ISO 31000:2018 – Risk Management – Guidelines
,
International Organization for Standardization (ISO)
,
Geneva
.
Ivanov
,
D.
(
2018
),
Structural Dynamics and Resilience in Supply Chain Risk Management
,
Springer
,
Berlin
.
Ivanov
,
D.
(
2020
), “
Viable supply chain model: integrating agility, resilience and sustainability perspectives–lessons from and thinking beyond the COVID-19 pandemic
”,
Annals of Operations Research
, Vol. 
319
, pp.
1411
-
1431
, doi: .
Ivanov
,
D.
(
2023
), “
Intelligent digital twin (iDT) for supply chain stress-testing, resilience, and viability
”,
International Journal of Production Economics
, Vol. 
263
, 108938, doi: .
Ivanov
,
D.
(
2025
), “
What network and performance indicators can tell us about supply chain and sourcing resilience (and what they cannot)
”,
Journal of Purchasing and Supply Management
, Vol. 
31
No. 
3
, 101014, doi: .
Ivanov
,
D.
and
Dolgui
,
A.
(
2021
), “
A digital supply chain twin for managing the disruption risks and resilience in the era of Industry 4.0
”,
Production Planning and Control
, Vol. 
32
No. 
9
, pp. 
775
-
788
, doi: .
Kamble
,
S.S.
,
Gunasekaran
,
A.
,
Parekh
,
H.
,
Mani
,
V.
,
Belhadi
,
A.
and
Sharma
,
R.
(
2022
), “
Digital twin for sustainable manufacturing supply chains: current trends, future perspectives, and an implementation framework
”,
Technological Forecasting and Social Change
, Vol. 
176
, 121448, doi: .
Kembro
,
J.
,
Selviaridis
,
K.
and
Naslund
,
D.
(
2014
), “
Theoretical perspectives on information sharing in supply chains: a systematic literature review and conceptual framework
”,
Supply Chain Management An International Journal
, Vol. 
19
Nos
5/6
, pp. 
609
-
625
, doi: .
Kim
,
Y.
,
Chen
,
Y.-S.
and
Linderman
,
K.
(
2015
), “
Supply network disruption and resilience: a network structural perspective
”,
Journal of Operations Management
, Vol. 
33
No. 
34
, pp. 
43
-
59
, doi: .
Kinra
,
A.
,
Ivanov
,
D.
,
Das
,
A.
and
Dolgui
,
A.
(
2020
), “
Ripple effect quantification by supplier risk exposure assessment
”,
International Journal of Production Research
, Vol. 
58
No. 
18
, pp. 
5559
-
5578
, doi: .
Koberg
,
E.
and
Longoni
,
A.
(
2018
), “
A systematic review of sustainable supply chain management in global supply chains
”,
Journal of Cleaner Production
, Vol. 
207
, pp.
1084
-
1098
, doi: .
Kumar
,
S.
,
Himes
,
K.J.
and
Kritzer
,
C.P.
(
2014
), “
Risk assessment and operational approaches to managing risk in global supply chains
”,
Journal of Manufacturing Technology Management
, Vol. 
25
No. 
6
, pp. 
873
-
890
, doi: .
Li
,
Y.
and
Zobel
,
C.W.
(
2020
), “
Exploring supply chain network resilience in the presence of the ripple effect
”,
International Journal of Production Economics
, Vol. 
228
, 107693, doi: .
Li
,
F.
,
Wu
,
C.-H.
,
Zhou
,
L.
,
Xu
,
G.
,
Liu
,
Y.
and
Tsai
,
S.-B.
(
2021
), “
A model integrating environmental concerns and supply risks for dynamic sustainable supplier selection and order allocation
”,
Soft Computing
, Vol. 
25
No. 
1
, pp. 
535
-
549
, doi: .
Lücker
,
F.
,
Timonina-Farkas
,
A.
and
Seifert
,
R.W.
(
2024
), “
Balancing resilience and efficiency: a literature review on overcoming supply chain disruptions
”,
Production and Operations Management
, Vol. 
34
No. 
6
, pp. 
1495
-
1511
, doi: .
Manuj
,
I.
and
Mentzer
,
J.T.
(
2008
), “
Global supply chain risk management
”,
Journal of Business Logistics
, Vol. 
29
No. 
1
, pp. 
133
-
155
, doi: .
Norrman
,
A.
and
Jansson
,
U.
(
2004
), “
Ericsson's proactive supply chain risk management approach after a serious sub-supplier accident
”,
International Journal of Physical Distribution and Logistics Management
, Vol. 
34
No. 
5
, pp. 
434
-
456
, doi: .
Öztek
,
G.
and
Kabak
,
M.
(
2022
), “
A multi-criteria approach to sustainable risk management of supplier portfolio: a case study at defense industry
”,
Gazi University Journal of Science
, Vol. 
35
No. 
4
, pp. 
1504
-
1519
, doi: .
Patrício
,
L.D.
,
Ferreira
,
J.J.
and
Gerschewski
,
S.
(
2025
), “
A network of networks: building resilience in the globalised era
”,
Global Networks
, Vol. 
25
No. 
3
, e70014, doi: .
Pettit
,
T.J.
,
Fiksel
,
J.
and
Croxton
,
K.L.
(
2010
), “
Ensuring supply chain resilience: development of a conceptual framework
”,
Journal of Business Logistics
, Vol. 
31
No. 
1
, pp. 
1
-
21
, doi: .
Pettit
,
T.J.
,
Croxton
,
K.L.
and
Fiksel
,
J.
(
2013
), “
Ensuring supply chain resilience: development and implementation of an assessment tool
”,
Journal of Business Logistics
, Vol. 
34
No. 
1
, pp. 
46
-
76
, doi: .
Pettit
,
T.J.
,
Croxton
,
K.L.
and
Fiksel
,
J.
(
2019
), “
The evolution of resilience in supply chain management: a retrospective on ensuring supply chain resilience
”,
Journal of Business Logistics
, Vol. 
40
No. 
1
, pp. 
56
-
65
, doi: .
Ponomarov
,
S.Y.
and
Holcomb
,
M.C.
(
2009
), “
Understanding the concept of supply chain resilience
”,
The International Journal of Logistics Management
, Vol. 
20
No. 
1
, pp. 
124
-
143
, doi: .
Rahman
,
T.
,
Paul
,
S.K.
,
Shukla
,
N.
,
Agarwal
,
R.
and
Taghikhah
,
F.
(
2022
), “
Supply chain resilience initiatives and strategies: a systematic review
”,
Computers and Industrial Engineering
, Vol. 
170
, 108317, doi: .
Rethlefsen
,
M.L.
and
Page
,
M.J.
(
2022
), “
PRISMA 2020 and PRISMA-S: common questions on tracking records and the flow diagram
”,
Journal of the Medical Library Association
, Vol. 
110
No. 
2
, pp. 
253
-
257
, doi: .
Sawik
,
T.
(
2013
), “
Selection of resilient supply portfolio under disruption risks
”,
Omega
, Vol. 
41
No. 
2
, pp. 
259
-
269
, doi: .
Smith
,
P.
,
Hutchison
,
D.
,
Sterbenz
,
J.P.G.
,
Schöller
,
M.
,
Fessi
,
A.
,
Karaliopoulos
,
M.
,
Lac
,
C.
and
Plattner
,
B.
(
2011
), “
Network resilience: a systematic approach
”,
IEEE Communications Magazine
, Vol. 
49
No. 
7
, pp. 
88
-
97
, doi: .
Torres-Ruiz
,
A.
and
Ravindran
,
A.R.
(
2018
), “
Multiple criteria framework for the sustainability risk assessment of a supplier portfolio
”,
Journal of Cleaner Production
, Vol. 
172
, pp. 
4478
-
4493
, doi: .
Tummala
,
R.
and
Schoenherr
,
T.
(
2011
), “Assessing and managing risks using the supply chain risk management process (SCRMP)”,
edited by Xie, C.
,
Supply Chain Management: An International Journal
, Vol. 
16
No. 
6
, pp. 
474
-
483
, doi: .
Urbaniak
,
M.
,
Zimon
,
D.
,
Madzik
,
P.
and
Šírová
,
E.
(
2022
), “
Risk factors in the assessment of suppliers
”,
PLoS One
, Vol. 
17
No. 
8
, 0272157, doi: .
van Hoek
,
R.
and
Wong
,
C.
(
2025
), “
Transformative and disruptive or incremental time wrinkles? How to advance thinking and practice in supply chain sustainability, risk management and digitalization
”,
International Journal of Physical Distribution and Logistics Management
, Vol. 
55
No. 
4
, pp. 
311
-
340
, doi: .
Wagner
,
S.M.
and
Bode
,
C.
(
2008
), “
An empirical examination of supply chain performance along several dimensions of risk
”,
Journal of Business Logistics
, Vol. 
29
No. 
1
, pp. 
307
-
325
, doi: .
Wiedenmann
,
M.
and
Größler
,
A.
(
2021
), “
Supply risk identification in manufacturing supply networks
”,
The International Journal of Logistics Management
, Vol. 
32
No. 
2
, pp. 
650
-
672
, doi: .
Wieland
,
A.
and
Wallenburg
,
C.M.
(
2012
), “
Dealing with supply chain risks: linking risk management practices and strategies to performance
”,
International Journal of Physical Distribution and Logistics Management
, Vol. 
42
No. 
10
, pp. 
887
-
905
, doi: .
Wortmann
(
2023
),
Effektive Methoden Der Literaturauswahl Und-Bewertung Für Wissenschaftliche Arbeiten - Ein Leitfaden Für Theoretische Literaturarbeiten, Abschlussarbeiten Und Hausarbeiten
,
IHRO – Institut für Human Resource Management und Organisationspsychologie
,
Hamburg
.
Yang
,
C.
,
Tian
,
K.
and
Gao
,
X.
(
2023
), “
Supply chain resilience: measure, risk assessment and strategies
”,
Fundamental Research
, Vol. 
5
No. 
2
, pp. 
4
-
436
, doi: .
Zsidisin
,
G.A.
(
2003
), “
A grounded definition of supply risk
”,
Journal of Purchasing and Supply Management
, Vol. 
9
Nos
5-6
, pp. 
217
-
224
, doi: .

Languages

or Create an Account

Close Modal
Close Modal