


The tendency shows that more customers will bring and use their mobile devices in-store. This study proposes a further analysis of the complementary role of the mobile device in an in-store purchase providing a characterisation of those customers and analyses their usage preferences and behaviour intentions, presenting new insights concerning gender and generation preferences.
Quantitative research with customers of electronic stores was conducted based on a questionnaire applied at the store’s exit. To assess the differences between genders and among generations were used the parametric T-Test and one-way ANOVA.
The results demonstrate divergencies between generations when using mobile devices. In addition, they indicate that males have more intention to manage shopping tasks efficiently and consequently are less affected by in-store marketing stimuli and less predisposed to impulse purchases.
Although real customers participated, a convenience sample was used. The results should be compared with research on other retailer types. The customer shopping motivations and the types of mobile device usage should be further investigated since they can change the experience and the retailer’s outcomes.
Contributing to related specific research areas such as shopping behaviour and technology in retail settings by showing the usage preferences, the study also provides information for retailers, especially those needing to approach the Gen Z customers, improving the development of strategies.
This research explores further the complementary role of the mobile device in an in-store purchase. By conducting the study in a new setting, it brings new insight into a less explored, yet important sector.
1. Introduction
In the last decade, mobile devices, such as smartphones, tablets and wearables, have changed the way we manage our everyday lives. The mobility they provide and the increased improvement in their software and hardware allow us to have a completely different lifestyle from what we have been used to so far. Therefore, it is understandable that the evolution of mobile phones has also revolutionised consumer behaviour (Fuentes and Svingstedt, 2017; McKinsey, 2020; Varnali and Toker, 2010). Researchers have been studying this phenomenon (mostly in the past decade) (Cavalinhos et al., 2021), but in the context of the global pandemic and its aftermaths, this topic of the relationship between customer and technology has gained new relevance (MSI, 2020).
In order to meet customers’ needs and improve their experience, retailers currently adopt new in-store technologies and act to improve their online presence, whether through a website, app or on social media, providing an omnichannel experience (Savastano et al., 2019). However, this omnichannel environment requires motivation from consumers (Zhang et al., 2018). In a brick-and-mortar store, where the environment tends to be as controlled as possible by the retailer, the mobile device has several roles that can help the customer manage the variables in their favour and further help in the purchase decision process. Their use affects customers’ decisions, in a way that the retailers cannot control (Bèzes, 2019).
Previous research confirmed that customers of different genders have different preferences when using their devices for multiple purposes (Bhatnagar and Papatla, 2019; Kiba-Janiak, 2014; Pantano and Gandini, 2017) and also have different preferences when using mobile devices for decision support. In addition, showroom intention (customers go to stores to choose products and then buy them online), was also found to be different between genders (Eriksson et al., 2017, 2018). Previous experience, proficiency and habit can play a role in the frequency of use and types of use (Tyrväinen and Karjaluoto, 2019), which makes it potentially an interesting topic to analyse from the perspective of gender. Also, according to Taylor (2021), the analysis of different generations’ perspectives is still relevant and there is a need for more research on generational cohorts.
This study aims to investigate the role of mobile devices in the in-store decision-making process and, at the same time, also verify demographic characteristics related to the way customers use their mobile devices, namely the differences between genders and generations (X, Y and Z) in usage preferences in-store.
One of the sectors which is most affected by this phenomenon is the technical consumer goods, more specifically the electronic retailers. Due to the characteristics of the products that require greater involvement in the purchase decision-making process and their associated perceived risk, electronic retailers dread this type of consumer behaviour. The showroom behaviour makes retailers uncomfortable, even though some studies point to the benefits of the showroom. The opposite behaviour does not seem to concern them (webroom) (Arora and Parida, 2022; Spaid et al., 2019; Viejo-Fernández et al., 2020).
By conducting the study in a new setting, such as electronic retailers, it brings new insight into a less explored, yet important sector. Concerning the retailer sector, this research enriches the preparation of strategic decisions on the management of the in-store shopping experience. Hence, the study on this particular topic intends to provide a characterisation of the customers who use their mobile devices in-store and analyse their usage preferences, focusing on possible generational and gender differences (Bailey et al., 2019) and also explores different settings and categories of products (besides groceries stores) (Grewal et al., 2018; Dorie and Loranger, 2020).
Because this research offers an understanding of the phenomenon, it helps retailers develop interactive marketing solutions most beneficial for customers and at the same time in a way that would be most convenient for the retailers. It also contributes with guidelines to create marketing strategies aligned with customers’ usage preferences.
The following research questions allow for narrowing the focus of its main purpose:
Is the usage type of mobile devices different between genders and among generations?
Is the use of mobile devices for decision support different between genders and among generations?
Is the intention of showroom behaviour different between genders and among generations?
This paper is organised as follows. In the next section, the theoretical background is presented, and the study hypotheses are formulated, followed by the methodology, including the sample, data collection and data analysis of the quantitative study. Further, the results are presented and further discussed, presenting the theoretical and managerial implications. Afterwards, the conclusions of the study, containing identified limitations and future research directions.
2. Research background and hypotheses
2.1 In-store shopping behaviour and mobile device usage
Customers use their mobile device in-store for shopping tasks (e.g. looking for competitors’ prices, shopping lists, coupons redemption, etc.) and for non-shopping tasks (e.g. social media, entertainment, job tasks, etc.), generating different outcomes for retailers (Bellini and Aiolfi, 2017, 2019; Sciandra and Inman, 2014, 2015; Sciandra et al., 2019).
According to Bellini and Aiolfi (2017), mobile devices can assist customers in the pre-purchase and purchase decision stages, making them more prepared for the shopping tasks, thus reducing the perceived risk and making the purchase process faster.
The services developed by retailers mainly allow a more efficient decision-making process (Pantano and Priporas, 2016; Spaid and Flint, 2014; Tyrväinen and Karjaluoto, 2019). This makes customers feel empowered and in control when they use their mobile devices for shopping assistance. Moreover, it makes them feel entertained due to the features of the mobile device that allow customers to customise their experience through online touchpoints, redesigning the retail environment (Cavalinhos et al., 2021). For example, in a situation where the customer is alone, the mobile device can become an element of socialisation (Spaid and Flint, 2014) and can provide a connection with a person of trust, family, a friend or an expert (Rippé et al., 2017). Social media and mobile devices are also essential elements since they can increase in-store sales (Nakano and Kondo, 2018).
Some authors pointed out the differences between the types of tasks performed with mobile devices and their effects (Bellini and Aiolfi, 2017, 2019; Grewal et al., 2018; Sciandra and Inman, 2014, 2015; Sciandra et al., 2019). The outcomes are different and the results of the studies diverge. When used for non-shopping activities, the displays recall and in-store stimuli are negatively affected (Bellini and Aiolfi, 2017; Sciandra et al., 2019; Sciandra and Inman, 2015), but customers buy more and it is explained by the distraction factor. According to Grewal et al. (2018), the negative effects have a higher impact on older customers.
Due to the distraction factor, customers buy more unplanned items, and the ads near the products have a more negligible effect (Bues et al., 2017), they also travel further and walk more and spend more time in-store (Hui et al., 2013). The multitask effects also impact negatively the accomplishment of shopping goals (Atalay et al., 2017).
The use of mobile devices for shopping tasks and supporting the decision-making process makes customers less prone to impulsive purchases and not effectively recall the marketing communication after shopping. Therefore, the decision-making process becomes more conscious (Bellini and Aiolfi, 2019). The role of salespeople also diminishes in influence on the decision-making process, since mobile devices allow customers to access a wide variety of information, including the opinion of experts and other customers (Rippé et al., 2017).
When looking for the different stages of the decision-making process, the stage where mobile devices play an important role, according to Lemon and Verhoef (2016), Ewerhard et al. (2019), Holmes et al. (2014) and Rippé et al. (2017) is the information search. Customers preferably search online and buy offline (Webroomers) (Arora and Sahney, 2017).
In sum, it is certain that mobile devices affect the decision-making process. Grewal et al. (2018) state that overall, the effect for the retailers is positive.
2.2 Gender differences in mobile device use and shopping behaviour
According to Faqih (2016), gender can play an essential role in individual behaviours and perceptions and it can influence technology adoption and usage types. Males and females use the Internet differently (Zhitomirsky-Geffet and Blau, 2016) and shop in-store for different motivations (Babin et al., 1994; Cardoso and Pinto, 2010). Therefore, there are differences between types of gender in the use of devices with Internet access.
Analysing the use of mobile devices in-store and gender preferences, in a study by Eriksson et al. (2018) including young students related to shopping activities, it was found significant differences between genders in use for different product categories. Young males use mobile devices more for high-involvement products, mainly searching for products and information about electronics, while young females ask for advice on fashion products more often than males. According to Eriksson et al. (2017), there also are different tendencies to showroom intention between genders.
In non-shopping activities related, females showed preferences for, e.g. managing social media, calling and texting friends as well as multitasking. Therefore, females seem to value more social interaction with their mobile devices (Bhatnagar and Papatla, 2019; Kiba-Janiak, 2014; Pantano and Gandini, 2017). Consequently, the following research hypotheses are formulated:
There are significant differences in the usage type of mobile devices in-store between genders.
There are significant differences in the use of mobile devices for decision support between genders.
There are significant differences in the showroom behaviour intention between genders.
2.3 Generation differences in mobile device use and shopping behaviour
A group with a similar age shares similar consumption patterns, social values and attitudes (Bilgihan, 2016). Therefore, it is expected that members of the same generations demonstrate similar behaviours when using their mobile devices.
Although there is no consensus on the definition of each generation's age range, when analyzing the three generations most likely to shop at the store using their mobile devices, the dates adopted are similar to those present in other studies. (Dimock, 2019; Priporas et al., 2017; Zhitomirsky-Geffet and Blau, 2016): Generation X (Gen X) was born between 1965 and 1980; they grew up without information technologies and was exposed to mobile devices only when being adults. The customers born between 1981 and 1995 are the members of Generation Y (Gen Y), or most popularly known as Millennials. This generation experienced the advent of smartphones during their adolescence and has more technological savviness than the previous generation. The customers born between 1996 and 2005 are Generation Z members (Gen Z); they are “mobile natives” and grew up with smartphones.
From a perspective of online shopping behaviour, despite the younger adult generations being online shopping fans, the Gen Z cohort has an intrinsic passion for technology solutions whereas Gen Y uses it with a purpose in mind (Agrawal, 2022).
The knowledge about the differences between generations, mainly the youngest ones, as well as the different uses of mobile devices in-store is scattered and still under study (Dorie and Loranger, 2020; Ewerhard et al., 2019; Priporas et al., 2017; Sullivan and Hyun, 2016). Nevertheless, the relationship between age and mobile device use and some effects has already been seen.
The older the customers, the higher the effect of distraction when using their mobile devices, spending more time in-store and looking at the shelves (Grewal et al., 2018). On the other hand, younger customers do more mobile shopping than older customers (Marriott et al., 2017); they avoid interaction with salespeople and rely on the information they find on the Internet (Rippé et al., 2017). Gen Y and Z are the technology-savvy groups and use mobile devices frequently in retail settings (Priporas et al., 2017).
Ewerhard et al. (2019) mentioned that different generations are drawn to different channels in different decision-making stages. The showroom behaviour related to products with high involvement, such as electronics, is more expected among young males (Dorie and Loranger, 2020; Eriksson et al., 2018). Therefore, there is expected that the use and effects of mobile devices can vary according to generation, presenting the following hypotheses:
There are significant differences in the usage type of mobile devices in-store between generations.
There are significant differences in the use of mobile devices for decision support between generations.
There are significant differences in the showroom behaviour intention between generations.
3. Methodology
Quantitative empirical research allows to measure and analyse the primary data collected for the study purpose. Therefore, the data collection was based on a questionnaire (written survey). A 7-point Likert-type scale (“1 – Never” to “7 – Very frequently”) was used to measure the mobile usage frequency, types of usage and in what product categories.
After designing the questionnaire, it was handed over to two professors and two researchers to assess the design and the content. In addition, two store managers were interviewed and gave their opinion about the questions and if they were suitable for the reality of the store. In order to reach customers similar to our sample, we designed an online survey as a pretest through which we tried to increase validity.
For the pretest, we used a convenience sample of 200 participants. After data analysis, the results showed a high rate of participants over 50 years old, with little representation of other age groups. In addition, 38.5% of the respondents were not users of mobile devices in-store and they did not proceed with the questionnaire. We also interviewed some respondents about the ease of understanding the questions. As a result, two questions were dropped and limited the age of the respondents to 45 years. Hence, reducing the age range of Gen X to 35–45 years old. The minimum age of the participants is related to the use of mobile devices and its relevance to the study as customers of this type of store, therefore, the minimum age was considered to be 16 years. As stated by Taylor (2021, p. 684), “within-cohort variance is an issue that very much complicates doing generational research”.
The respondents’ difficulty in recalling the experiences influenced the answers and they did not have in mind the store setting mistaken for online store. Therefore, the application settings changed, and the questionnaire’s administration was a face-to-face interview.
To be aligned with the current knowledge about the use of mobile devices in-store and test the hypotheses, we decided to reduce the number of items of the types of mobile device usage in-store and the number of categories where the use of mobile devices supported the decision-making (Bellini and Aiolfi, 2017, 2019; Sciandra and Inman, 2014, 2015; Sciandra et al., 2019). We also created the variable “showroom intention” based on the work of Viejo-Fernández et al. (2020).
From six items used to assess the use of the mobile device in different types of tasks, three new categories were obtained as types of mobile device use: “Shopping-Related”, “Non-Shopping-Related – Hedonic” and “Non-Shopping-Related – Utilitarian”.
Concerning the categories of products, the initial five items were reduced into three categories: “Home Appliances”, “Technologies” and “Entertainment and Culture”. Then, we analysed the results by type of usage, support in the decision-making process, and purchase and showroom intention.
The survey was applied by the researcher individually and in person at the store’s exit. The data collection was performed during winter 2019/20 in the major electronic retailer’s stores (Box Auchan, Fnac, Media Market, Radio Popular and Worten) in 12 different store locations in Lisbon’s metropolitan area (Portugal). The collection was done in different counties, on different weekdays and at different times of the days, during the store’s operating period. Qualtrics was chosen for the online survey, using a tablet with a mobile Internet connection.
Given the specific characteristics of the needed respondents and the interview place, the sampling process had to be a convenience sample. The sample was selected according to the availability and accessibility of the elements that constitute the sample.
To be a valid participant, the customer had to recall the use of their mobile device in-store. A screening question asking, “During your visit, did you use any of these mobile devices: smartphone, tablet or smartwatch?” was used to exclude the respondents who do not use their mobile device in-store. The participants’ age and the use of mobile devices in-store were the selection criteria. The survey included 393 participants, but only 309 used a mobile device in-store, excluding the participants who did not complete all answers. The final sample included 301 valid participants.
The analysis started with demographic characterisation of the sample using descriptive statistics (frequency, means and standard deviations). When analysing mobile devices in-store, particularly the types of use, the frequency of use and decision-making support, we looked for differences between genders and generations. To assess the differences between genders, we used a parametric T-Test (H0: µ1 = µ2), and for studying differences between generations, we used one-way ANOVA (H0: σ21 = σ22 = σ23). A significance level of 0.05 was considered. Therefore, gender and generation were the independent variables, and the types of use of mobile devices, consumer electronics categories, showrooming behaviour intention and purchase intention were the dependent variables of interest. To find significant differences between the generation groups, we performed ANOVA post hoc tests (Tukey HSD).
4. Results
The sample was divided between 164 females (54.5%) and 137 males (45.5%). To assess the differences among generations, the age groups were divided as follows: Gen X (35–45 years old), Gen Y (25–34 years old) and Gen Z (16–24 years old). The most represented age group was Gen Y with 38.9%, followed by Gen X with 32.6% and then Gen Z with 28.6%.
Most respondents have higher education (66%) and are salaried workers (72.7%). As far as monthly income level is concerned, 39.9% earn between 1,001€ and 2,000€, followed by 34.2% that earn 580€ to 1,000€, 18.9% of the respondents earn the same or less than the minimum wage (mostly students – 17.9%), and only 6.6% earn more than 2,000€. The sample characterisation is summarised in Table 1.
Socio-demographic characterisation of the sample
| N | % | ||
|---|---|---|---|
| Gender | Male | 137 | 45.5 |
| Female | 164 | 54.5 | |
| Generation | 16–24 years (Gen Z) | 86 | 28.6 |
| 25–34 years (Gen Y) | 114 | 38.9 | |
| 35–45 years (Gen X) | 98 | 32.6 | |
| Education | Basic Education | 6 | 12 |
| Secondary Education | 94 | 31.2 | |
| Higher Education | 200 | 66.4 | |
| Individual income level | <580€ | 57 | 18.9 |
| 580€–1,000€ | 103 | 34.2 | |
| 1,001€–2,000€ | 120 | 39.9 | |
| >2,001€ | 20 | 6.6 | |
| Missing | 1 | 0.3 | |
| Current occupation | Salaried worker | 218 | 72.7 |
| Self-employed worker | 12 | 4 | |
| Unemployed | 6 | 2 | |
| Student | 53 | 17.6 | |
| Other | 10 | 3.3 | |
| Missing | 2 | 0.7 |
4.1 Frequency and types of mobile device usage in-store
Regarding the analysis of the descriptive results, the frequency of mobile device use in-store shows a higher mean for males (5.04) and Gen Y (5.09), all with a mean above 4.00, meaning that respondents often use their mobile devices in the store (Table 2).
Frequency means of mobile device usage in-store by gender and generation (1 = Never to 7 = Very frequently)
| N | Mean | SD | ||
|---|---|---|---|---|
| Gender | Male | 137 | 5.04 | 1.613 |
| Female | 164 | 4.55 | 1.666 | |
| Total | 301 | 4.78 | 1.657 | |
| Generation | Gen Z | 86 | 4.66 | 1.635 |
| Gen Y | 117 | 5.09 | 1.617 | |
| Gen X | 98 | 4.51 | 1.682 | |
| Total | 301 | 4.78 | 1.657 |
The frequency of mobile device usage has different mean levels for different types of tasks. The use of mobile devices to “Find information about products/services” and “Socialising with friends and family” had the highest mean frequency levels with 4.66 and 4.83, respectively. All the other tasks (“Entertainment”, “Professional tasks”, “Manage purchase” and “Manage personal finances”) had lower means (less than 4), meaning that the respondents have a lower-frequency use for these tasks in-store.
The results of the T-test show that only in the general frequency of use (sig. = 0.01) and regarding the use to “Find information about products/services” (sig. = 0.03), there were significant differences between males and females (sig. <0.05), with higher mean levels for men. The other items about different tasks performed with the mobile device did not reveal significant differences in the means.
The ANOVA results provide considerable differences in most variables among generations. The different tasks performed with mobile devices in-store only when used to “Manage shopping” had no significant values (sig. = 0.106), meaning no differences between generations. The other items scored notable differences between generations. Gen Z scores were higher for “Mobile device use for entertainment” and “Socialising with family and friends”. Gen Y has a higher frequency for mobile device usage and specific types of use, and scores higher in “Find information about products/services” and “Manage personal finances”. More frequently than younger generations, the older generation (Gen X) uses mobile devices for professional tasks.
After analysing the types of mobile device usage by three categories of tasks, only “Shopping-Related” tasks presented differences between genders, with men having a higher usage frequency mean (Table 3).
Gender differences within mobile device usage types and between categories with T-test
| Dependent variable | Gender | Mean | SD | Std. error mean | t/df | Sig. |
|---|---|---|---|---|---|---|
| Shopping-Related Tasks | Male | 4.32 | 1.632 | 0.139 | 2.110/299 | 0.036 |
| Female | 3.92 | 1.640 | 0.128 | |||
| Non-Shopping-Related Tasks – Utilitarian | Male | 3.61 | 1.707 | 0.146 | 0.016/299 | 0.987 |
| Female | 3.61 | 1.828 | 0.143 | |||
| Non-Shopping-Related Tasks – Hedonic | Male | 4.03 | 1.778 | 0.152 | 0.260/299 | 0.795 |
| Female | 3.98 | 1.595 | 0.125 |
Among generations, there are significant differences in the way they use their mobile devices (“Shopping-Related” sig. = 0.002; “Non-Shopping-Related – Utilitarian” sig. = 0.039; and “Non-Shopping-Related – Hedonic” sig. = 0.000). When looking at the results of the Tukey HSD post hoc (probability of type I error at 5%), we observed significant differences in the Gen Y and Gen X for “Shopping-Related” tasks. Regarding “Non-Shopping-Related – Utilitarian”, Gen Y has considerable differences with higher mean levels, while for “Non-Shopping-Related – Hedonic”, Gen X and Gen Z had substantial differences between means (Table 4).
Generation differences within mobile device usage types and between categories with ANOVA
| Dependent variable | Gender | Mean | SD | Std. error mean | df | F | Sig. |
|---|---|---|---|---|---|---|---|
| Shopping-Related | 6.256 | 0.002 | |||||
| Gen Z | 3.86 | 1.603 | 0.173 | 2 | |||
| Gen Y | 4.51 | 1.556 | 0.144 | 2 | |||
| Gen X | 3.82 | 1.703 | 0.172 | 2 | |||
| Non-Shopping-Related – Utilitarian | 3.274 | 0.039 | |||||
| Gen Z | 3.27 | 1.797 | 0.194 | 2 | |||
| Gen Y | 3.90 | 1.705 | 0.158 | 2 | |||
| Gen X | 3.57 | 1.786 | 0.180 | 2 | |||
| Non-Shopping-Related – Hedonic | 9.296 | 0.000 | |||||
| Gen Z | 4.61 | 1.539 | 0.166 | 2 | |||
| Gen Y | 3.90 | 1.560 | 0.144 | 2 | |||
| Gen X | 3.59 | 1.793 | 0.181 | 2 |
4.2 The mobile device usage in the decision-making process
The use of mobile devices as a decision support tool in electronic stores has different mean levels of frequency for different products: “Smartphones and mobile phones” have higher mean scores with 4.87, followed by “Electronics and computers” with 4.68. “Home appliances” and “Tv, video and home cinema” had similar frequency levels with 4.05 and 4.06, respectively. Only the “Entertainment and culture” category had the mean scores below 4 (3.83), meaning that respondents use their mobile devices less when choosing products/services for entertainment or cultural purposes while seeking help in the decision process when dealing with more sophisticated technology products, such as smartphones.
Regarding the use of the mobile device for support in the decision-making, the differences between genders are significant in the categories of “Electronic and computers” (sig. = 0.00), “Smartphones and mobile phones” (sig. = 0.00) and “Tv, video and home cinema” (sig. = 0.00). In the other categories, “Home appliances” (Sig. = 0.33) and “Entertainment and culture” (sig. = 0.40) did not score significant differences. Where notable differences were registered, the highest frequency mean of use records belonged to the male participants.
The ANOVA results provide significant differences in only two variables among generations. For the use of the mobile device as support in the decision-making, the differences among generations were considerable for “Entertainment and culture” (sig. = 0.016) and “Home appliances” (sig. = 0.004).
When analysing the mean differences in the use of the mobile device to support decision-making in “Entertainment and culture” is not significantly different between genders (sig. = 0.404) but in “Home Appliances” and “Consumer Electronics”, the use of the mobile device is higher in the male participants, reaching the mean of 5.33 in the “Consumer Electronics” category for males (sig. = 0.000) (Table 5).
Gender differences within mobile device usage for purchase decision support by categories type with T-test
| Dependent variable | Gender | Mean | SD | Std. error mean | t/df | Sig. |
|---|---|---|---|---|---|---|
| Home appliances | Male | 4.21 | 1.599 | 0.137 | 2.511/298 | 0.013 |
| Female | 3.72 | 1.800 | 0.141 | |||
| Consumer electronics | Male | 5.33 | 1.516 | 0.130 | 5.327/299 | 0.000 |
| Female | 4.31 | 1.809 | 0.141 | |||
| Entertainment and culture | Male | 4.15 | 1.977 | 0.169 | 0.836/299 | 0.404 |
| Female | 3.96 | 1.950 | 0.152 |
The frequency of mobile device use for decision-making support in different categories is different among generations (Table 6). Despite the results of p = 0.052 for the category “Consumer Electronics”, the post hoc test shows significant differences between Gen X and Gen Y (sig. 0.042).
Generation differences within mobile device usage for purchase decision support by categories type with ANOVA
| Dependent variable | Gender | Mean | SD | Std. error mean | df | F | Sig. |
|---|---|---|---|---|---|---|---|
| Home appliances | 3.101 | 0.046 | |||||
| Gen Z | 3.56 | 1.701 | 0.183 | 2 | |||
| Gen Y | 4.15 | 1.745 | 0.161 | 2 | |||
| Gen X | 4.03 | 1.689 | 0.171 | 2 | |||
| Consumer electronics | 2.989 | 0.052 | |||||
| Gen Z | 4.74 | 1.788 | 0.193 | 2 | |||
| Gen Y | 5.06 | 1.560 | 0.144 | 2 | |||
| Gen X | 4.47 | 1.904 | 0.192 | 2 | |||
| Entertainment and culture | 4.177 | 0.016 | |||||
| Gen Z | 4.10 | 2.024 | 0.218 | 2 | |||
| Gen Y | 4.38 | 1.799 | 0.166 | 2 | |||
| Gen X | 3.61 | 2.029 | 0.205 | 2 |
4.3 The purchase intention and showroom intention
By analysing the respondents’ purchase intention that used their mobile device in-store, we intended to observe some possible showroom intention or intention to buy in another store (online and offline). The results showed that both genders have the same mean for purchase intention in-store (with high levels of 5.46). The scores for the purchase intention are higher than for the other choices. The probability of buying in another physical store (4.42) is higher than buying online in the same store (4.14) or even higher than in another store online (3.81).
The preferences for intention purchase of the respondents by gender only had significant differences in “purchase in another store (physical)” (sig. = 0.02) and in “purchase in another store (online)” (sig. = 0.00). Also, in this section, male participants had higher mean scores.
Regarding the differences within purchase intention, the only substantial difference was in “Purchase in another store (online)” (sig. = 0.028), where the Gen Y had a higher score, which means a higher predisposition to showroom intention in this generation.
Concluding, the T-test analysis for gender has significant differences in the showroom intention (Sig. = 0.005). Again, male participants scored higher and thus, they are more likely to expose this behaviour (Table 7).
T-Test for gender differences within showroom intention
| Dependent variable | Gender | Mean | SD | Std. error mean | t/df | Sig. |
|---|---|---|---|---|---|---|
| Showroom intention | Male | 4.41 | 1.421 | 0.121 | 3.096/297 | 0.002 |
| Female | 3.88 | 1.497 | 0.117 |
Among generations, the ANOVA tests reveal significant differences (Table 8). At least one or two of the group generations have different means of frequency of use or probability of showroom intention. There are notable differences between generations (sig. = 0.002; sig. = 0.039; sig. = 0.000). In the “showroom intention” between generations, Gen Y has a considerable difference (p = 0.05) compared with others.
ANOVA for generations’ differences within tasks performed with the mobile device, product categories and showroom intention
| Dependent variable | Gender | Mean | SD | Std. error mean | df | F | Sig. |
|---|---|---|---|---|---|---|---|
| Showroom intention | 3.168 | 0.044 | |||||
| Gen Z | 3.99 | 1.510 | 0.162 | 2 | |||
| Gen Y | 4.39 | 1.496 | 0.139 | 2 | |||
| Gen X | 3.92 | 1.412 | 0.142 | 2 |
Figure 1 summarises the results of the analysis of customers’ behaviours when using their mobile devices in-store and examines the average usage differences between males and females and among three generations (Gen X, Gen Y and Gen Z).
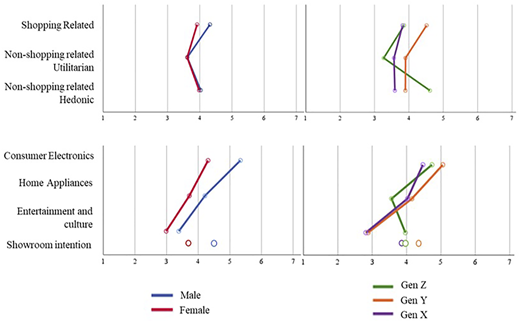
Summary of the analysis of differences found between genders and generations in mobile devices average frequency usage in-store
Summary of the analysis of differences found between genders and generations in mobile devices average frequency usage in-store
In brief, the results show differences in behaviour, either between genders or between generations, which shows that the use given to mobile devices in-store can vary according to gender and age, supporting H3, H4, H5 and H6. Hypothesis H2 is partially supported because in the categories “Home Appliances” and “Consumer Electronics” the differences are significant, however, the “Entertainment and culture” category is not significantly different between genders. Only in Non-Shopping-Related tasks, there was no record of significant differences between gender preferences, hence not supporting H1.
5. Discussion and implications
Following the research questions, the results show significant differences between genders and among generations when using their mobile devices for different tasks and when using them for decision-making support in various categories. The frequency of use of mobile devices in-store is above the mean level of the scale, which implies a recurrent behaviour that cannot be overlooked. Significant higher levels of frequency use are reported by males and by members of the Gen Y group. These results align with previous research, presenting the two groups as the main users of mobile devices in consumer electronics stores (Eriksson et al., 2018; Marriott et al., 2017).
Concerning gender differences, and when analysing tasks separately, males show significantly higher scores in finding information about the products or services on a mobile device, with no differences in performing other tasks. This is also true when analysing “shopping tasks” and “non-shopping tasks”, meaning that males use their devices more to assist the shopping process. When looking at the results of the differences between genders when using their mobile devices for decision-making, males show higher scores in all product categories. However, more sophisticated and technically complex products, such as smartphones, show the highest frequency.
Of all the different types of tasks that were analysed, the information search and the socialisation tasks are the most important, which could mean that males seek information and people online. By avoiding contact with salespeople, they look for opinions and companies online (Rippé et al., 2017).
In relation to gender and purchase intention, no differences were found. Nevertheless, males score a higher probability level when examining the showroom behaviour intention. This can be related not only to the search for the best deal (Schneider and Zielke, 2020) but also to the intention to minimise the perceived risk of purchasing a product with high involvement by visualising the products physically (Ewerhard et al., 2019).
In sum, by using mobile devices more frequently to perform tasks related to shopping, it is considered that males have more intention to manage the shopping tasks efficiently and consequently are less affected by in-store marketing stimuli and less predisposed to impulse purchases (Bellini and Aiolfi, 2017; Grewal et al., 2018; Sciandra et al., 2019).
Regarding differences among generations, starting with the general frequency use, Gen Y was found to have higher values. When analysing types of tasks, it is possible to see that for “shopping tasks” and “non-shopping tasks – utilitarian”, Gen Y also have higher frequency use, but in “non-shopping tasks – hedonic”, the Gen Z use their mobile devices more frequently. Although Gen Z results showed lower results than Gen Y in frequency use, they specifically use mobile devices for “Entertainment” and “Socialising with family and friends”, indicating the importance of the Internet for socialisation (Hall and Towers, 2017). Because they are younger and have less income due to still being students, it is possible that the shopping management can be done by the parents or someone responsible for household purchases. Thangavel et al. (2021) mentioned that Gen Z customers favour online shopping than their millennial counterparts, however, according to our results when Gen Z customers visit a store, they have the intention to purchase in-store.
Even though Gen X generation represents lower levels of mobile device usage, it does not mean that they are not influenced by it. In this case, proficiency in using technology can play an essential role in the frequency and types of use (Tyrväinen and Karjaluoto, 2019). When looking at the differences among generations in the use of mobile devices for decision-making support, Gen Y is the one which shows higher frequency in all categories. These results align with previous research (Dorie and Loranger, 2020; Agrawal, 2022) and highlight avoidance towards salespeople, but show trust in the information on their mobile devices.
The difference in showroom behaviour intention is significant for Gen Y (above 4 points). According to Hall and Towers (2017), this behaviour is expected among the youngest generations, especially in Gen Y. Although Gen Z showed the lowest level (below 4 points) in the showroom behaviour intention and the highest (mean of 5.55) for the purchase intention in-store, this could mean a more loyal generation. However, the showroom is a complex phenomenon and as Schneider and Zielke (2020) claim, many factors can influence it and there are many types of groups of showroomers. The purchase intention is high in every generation and gender. Even if they use their mobile, they use it to assist the decision-making process, highlighting the mobile device’s complementary role to an in-store purchase.
Another perspective on the data can show that the use of mobile devices in-store is less relevant for entertainment activities, especially for females and for Gen X. As Ham et al. (2022, p. 389) state, “utilitarian value is more significantly perceived by younger generations than by older generations”. This is relevant since hedonic activities are the ones that can contribute most for a better shopping experience (Cavalinhos et al., 2021).
5.1 Theoretical implications
The research extends the knowledge in the field by confronting the previous findings. The present analysis has the singularity of the collected data from actual customers right after the shopping experience while being the first study of this kind on the consumer electronic retail sector (high involvement categories). Previous research on the topic focused their studies on groceries stores or lab settings (Bellini and Aiolfi, 2019; Grewal et al., 2018; Hui et al., 2013; Mills and Zamudio, 2018; Viejo-Fernández et al., 2020). Furthermore, this study contributes to related specific research areas such as communications in-store, shopping behaviour and technology in retail settings by showing the usage preferences of different gender and generations.
The research also contributes to a better characterisation of the customers who use their mobile devices in-store and analyses their preferences in-store. Furthermore, it sheds light on the differences between gender preferences and demonstrates divergencies between generations when using mobile devices.
Previous empirical studies were restricted to young adults, mainly students. This is the first study that carried out a survey (using face-to-face interviews in retail settings) with a sample of actual customers, in addition to making it more heterogeneous and concerning age and socio-economic status (Bailey et al., 2019; Fagerstrøm et al., 2020; Fuentes and Svingstedt, 2017; Ono et al., 2012; Pantano et al., 2018). Few studies include the Generation Z, still focusing on the Millennials (Gen Y) (Bailey et al., 2019; Bilgihan, 2016; Dorie and Loranger, 2020; Sullivan and Hyun, 2016), this investigation contributes with evidence that their in-store usage preferences are different.
5.2 Managerial implications
The present study demonstrates that mobile devices certainly affect the decision-making process. Most of the services developed by retailers so far allow for a more efficient decision-making process focused on the utilitarian aspects of shopping management (Pantano and Priporas, 2016; Spaid and Flint, 2014; Tyrväinen and Karjaluoto, 2019).
Sciandra et al. (2019) claim that the type of use can affect the retailers’ outcome. The Non-Shopping-Related activities are more prone to negatively impact the shopping activities and consequently the retailer outcome (fewer purchases). On the other hand, in what regards the customer experience, they can result in more enjoyment. These behaviours are often discouraged in-store, but they bring hedonic feelings to customers and ultimately benefit retailers. Therefore, to maximise customer experience and the retailer outcome and create a seamless experience, the first step is to make the in-store environment as technology-friendly as possible. From the Wi-Fi signal to the search and purchase solutions, all staff members in-store must be aware of this reality and be prepared to face it. An integrated approach certainly provides insights, control and flexibility to interact as needed (Alonso, 2021).
This study gains ever higher relevance at a time when customers resort to technology solutions, avoiding direct human contact due to restrictive measures imposed during the pandemic (COVID-19), as the role of the physical store is changing and the omnichannel services are increasing (Accenture, 2020; Briedis et al., 2020). When customers shop, they use the mobile device as their advisor, assistant and shopping companion (Fuentes et al., 2017). This implies an opportunity for retailers to play an active role and be present in the crucial moments, making the customer’s participation in the shopping process more dynamic.
Physical retailers still fear the showroom behaviour (search offline and buy online), but as mentioned in Viejo-Fernández et al. (2020) research, showrooming, when performed in-store using mobile devices, is more likely to make the purchase action more expensive. Therefore, it is important to create a way to direct customers to the retailer’s online platforms where all the necessary information is available, but at the same time to guarantee a competitive price concerning potential online competitors.
Retailers can improve the service by developing and targeting technological solutions considering the gender and generations differences. For example, if males are more heavy users than females, the product design for men (e.g. shaving machines) can have a more significant investment in mobile marketing. As for females, the investment can be shared in different channels, but with special attention to social media, since they present slightly higher levels than males. The same with the Gen Z that presents significant higher values of use for socialisation.
For customers that already use their mobile devices, in-store Wi-Fi-enabled devices let retailers track a store’s traffic and personalise mobile advertising. Retailers also can create or improve a retail app for those who seek product comparison and/or self-service technology that helps customers in the decision-making process. This would reduce the perceived risk and the deal-hunting behaviour, particularly of the younger generations (Agrawal, 2022; Arora et al., 2021; Johnson and Ramirez, 2021).
In-store signage solutions that are able to interact with mobile devices and provide the necessary information while making the activity enjoyable can be valuable for mobile users and provide a better experience and increase results for retailers, especially in terms of communication effectiveness. The combination of utilitarian aspects, sought by Gen Y, and hedonic elements, appreciated by Gen Z, can improve the shopping experience (Agrawal, 2022; Cavalinhos et al., 2021).
6. Conclusion
This paper analysed whether the gender and generation cohort aspects impacted usage preferences. We wanted to know what customers do with their mobile devices while they are in-store, and by analysing the differences between genders and generations, we collected relevant information, both at theoretical as well as managerial levels.
Overall, males use their mobile devices more frequently and can be more influenced by mobile information when shopping and be less influenced by the in-store stimuli. As for age, the differences between generations and the types of use are in line with previous research about behaviour on the Internet and general use of mobile devices (Dorie and Loranger, 2020; Eriksson et al., 2017; Eriksson et al., 2018; Ewerhard et al., 2019; Hall and Towers, 2017), meaning that GenY is the heavy user age group.
As for purchase intention and showroom, the main conclusion is that there are no differences in the purchase intention. Yet, the showroom intention can be considered as related to the levels of mobile device use, since Gen Y is the only group that has significant values for showroom behaviour intention and that also uses the mobile devices more. This demonstrates the impact of mobile devices in the information search stage. Following the results, this generation can have loyalty issues towards the retailers.
When looking at the product categories, the higher the technological complexity, the higher the probability of the use of mobile devices to support the decision-making. All generations and gender demonstrate the relation between high-involvement products and the use of mobile devices.
Findings highlight the complementary role of the mobile device in an in-store purchase since the purchase intention is high in every generation and gender. Even if they use their mobile, they do it to assist the decision-making process. These conclusions contribute to how we should design better solutions for interacting with this type of customer who uses their mobile devices in-store.
Concerning the quantitative study, although real customers were used and there was a search for diversity regarding age, gender and use of face-to-face interviews, a convenience sample was used. When using only two categories to indicate gender, even if respondents self-identified as male and female, may lead to certain respondents who identify as non-binary to feel excluded, even if that was not reported by any respondent. Hence, conclusions hold for the collected sample and cannot be directly generalised.
Our results should be compared with the results obtained from electronic retailers from other countries, as the specificities of a small country and a small market can influence the results. Furthermore, the present research results could be compared with research on other retailer types (e.g. clothing, toys, furniture and home decor). The customer shopping motivations and the types of mobile device usage should be further investigated since they can change the experience and the retailers’ outcomes.
The use of mobile devices continues to change our daily lives, and it has also proven to change the customer behaviour. Therefore, the subject deserves increasing curiosity and constant investigation by academics and retailers.
Funding: This work was supported by Fundação para a Ciência e a Tecnologia, grant UIDB/00315/2020.
Ethics approval statement: This research was performed under the ethical scientific rules.

