


The purpose of this study is to develop and validate a scale for measuring the uptake of process innovations by SMEs in the food industry, from a resource-based view perspective.
Based on the Resource-Based View (RBV) theory and the existing literature, a measurement scale was proposed. The scale was then empirically validated through a survey of 315 SMEs. Exploratory Factor Analysis (EFA) and Confirmatory Factor Analysis (CFA) were utilized for scale validation.
The findings suggest that the uptake of food process innovation can be measured from a resource-based view perspective, but not with respect to all dimensions of RBV. Particularly, the items related to value and inimitability of new food processing equipment and methods were confirmed as valid measures. Nevertheless, the findings do not confirm the validity of measurement items related to the rareness and non-substitutability of new processing methods and equipment.
The main limitation of this study is the lack of consideration beyond the resource-based view perspective. In this respect, it is worth validating this measurement scale using samples beyond the SMEs and in other countries. Furthermore, the statistical analysis is limited to EFA and CFA, which may be prone to the exploratory nature and subjectivity in factor selection.
The main contribution of this study is the development and validation of a scale for measuring the uptake of food process innovations. Hence, firms can utilize this scale to evaluate the efficiency of food process innovations in the quest for maximizing output. Furthermore, researchers can utilize this scale for further explorations and investigations on aspects related to the uptake of food process innovations.
The utilization of Resource Based View (RBV) opens a rather different approach for measuring process innovation from a resource-based view perspective. While the existing literature in the food industry has measured innovation from a general approach, this study offers a different approach by paying specific attention to process innovation from a resource-based view perspective.
1. Introduction
Process innovation has recently become the focal point in the quest for maximizing efficiency (Almeida & Wasim, 2023; Chai, Li, Tangpong, & Clauss, 2020; Jin, Cedrola, Kim, & Lauren, 2019). In the food industry, process innovation has unarguably been motivated by a call for efficient food systems (FAO, 2014, 2019; UN, 2016). Subsequently, there has been a surging research interests on aspects related to process innovation among scholars in the food industry. Such research have paid attention to a wider range of topics including efficiency and complementarity with product innovation (Hullova, Simms, Trott, & Laczko, 2019), the outcome of process innovation (Oltra-mestre, Hargaden, Río, & Coughlan, 2020), factors affecting process innovation (Maietta, Barra, & Zotti, 2017) and the determinant of process innovation (Bigliardi & Dormio, 2009; Ghazalian & Fakih, 2016). Despite an increase of research interests, aspects related to food process innovation and its uptake have received inadequate attention. Consequently, a specific scale for measuring food process innovation and its uptake is lacking (Naila, Nandone, & Makindara, 2024). In this respect, previous studies (Baregheh, Rowley, Sambrook, & Davies, 2012a, b; Bruce Traill & Meulenberg, 2002; Naila et al., 2024) have called for research endeavour’s focusing on developing and validating a standardized measure of innovations in the food industry, including process innovation. Therefore, the present study attempts to address this scale deficiency by paying specific attention to the uptake of process innovation in the food industry.
In doing so, the efforts of previous studies which have attempted to measure innovation in the food industry are recognized. The study argues for a specific focus on the uptake of food process innovations due to three reasons. First, previous studies have measured innovation with a general perspective which lacks specific focus on different innovation types such as product, process, market and organization innovation. In doing so, some studies have attempted to measure various aspects such as customer acceptance of innovation (Carlucci et al., 2023; Nazzaro, Lerro, Stanco, & Marotta, 2019), home demand conditions enhancing firm innovation (Lee, Moon, & Jeong, 2022), dynamic drivers for managing innovation capability (Kafetzopoulos & Skalkos, 2019) and drivers of green innovation (McCarthy, Liu, & Chen, 2016). However, these studies have paid more attention to aspects related to demand for innovation, especially from customer perspective, leaving inadequate attention to firm perspective.
Secondly, although some studies (Baregheh, Hemsworth, & Rowley, 2014; Dadura & Lee, 2011) have included process innovation as part of general scales for measuring food innovations, aspects related to resources are lacking. Accordingly, the current study argues for consideration of resources; this is because previous studies (Demirkan, 2018; Taleb, Hashim, & Zakaria, 2023) on the other hand, suggests the relationship between resources and innovation. In this respect, measuring process innovation and its uptake from a resources-based view perspective becomes imperative.
Thirdly, a study by Tantanee et al. (2019) have recognized the role of relevant policies in promoting innovation in developing countries. Consequently, various policy initiatives have been introduced to promote innovation across Africa (Daniels, Dosso, & Amadi-Echedu, 2020; Mohamed et al., 2018). Such initiatives have largely focused on promoting innovation among the Small and Medium Enterprises (SMEs), which characterise most businesses in Africa. For example, in Tanzania, the Small Enterprise Development Policy of 2003 recognizes various institutions for development and promotion of innovation related initiatives. In this respect, the Small Industries Development Organization (SIDO) is tasked with the responsibility of ensuring access to innovation among the SMEs, including those involved in food processing. To fulfil its responsibilities, SIDO has been promoting the uptake of process innovation among food processing SMEs (SIDO, 2024). Despite such promotional efforts, records indicate the prevalence of low transfer of innovations from SIDO to SMEs. For instance, within the past five years only 42% of technologies produced by SIDO were transferred to small agro-processors (Control Auditor General & AG, 2023). Furthermore, recent audit reports suggest that SIDO spends an average of TSH 14 billion (approximately 5.5 million USD) to finance its operations, including the promotion of the uptake of process innovation among small food processors (Control Auditor General & AG, 2018, 2023). This implies significant investment of resources – a situation which calls for evaluation. Despite these initiatives, a specific scale for measuring the uptake as an evaluation tool is lacking.
Furthermore, the level of uptake of process innovation among the food processing SMEs is not well documented. To the best of our knowledge, and after extensive literature review, we have not found any published empirical study addressing the extent of the uptake of process innovation among small food processors. In this respect, the present study builds on the assumption that this lack of empirical evidence could be partly due to the lack of measurement scale. Following this assumption, we argue that since innovation promotion campaigns involve commitment of resources, it is important to evaluate their performance and success. In doing so, organizations such as SIDO need to evaluate the success of their efforts in various aspects, including the extent and the performance of the uptake of process innovation. Thus, a standardized scale for process innovation and its uptake is needed.
Therefore, the aim of this study is to develop and validate a scale for measuring the uptake of process innovation, from a resource-based view perspective. In doing so, the Resource Based View (RBV) theory (Barney, 1991; Wernerfelt, 1984a) is utilized to propose latent constructs for measuring the uptake of process innovation. Particularly this study attempts to answer the following research question: can the uptake of food process innovations by SMEs be measured from RBV perspective? The choice of RBV is motivated by a study by Naila et al. (2024) which proposed the description of food process innovation from RBV perspective. Moreover, previous studies (Indrawati, Caska, & Suarman, 2020; Khan, Atlas, Ghani, Akhtar, & Khan, 2020) suggest that both tangible and intangible resources are among the determinants of innovation performance for SMEs. Thus, because SMEs operating in African countries are likely to be constrained by limited resources (Li, 2018; Ringo, Kazungu, & Tegambwage, 2023), the present study assumes that it is also likely that SMEs in Africa strive to reorganize the limited resources in the quest for efficiency.
This study contributes knowledge to both practitioners and researchers. To practitioners, the proposed scale offers a basis for evaluating the uptake of process innovation. To researchers, the proposed scale sets the point of departure for exploring and investigating aspects related to the uptake of food process innovations. The rest of this study is organized as follows: in the next section the empirical and theoretical review is presented and research hypothesis together with four proposed latent constructs for measuring the uptake of process innovation. Then, the methodology of study is described, followed by findings and discussion. Finally, conclusion and recommendations for future research agenda are provided.
2. Literature review
2.1 Empirical review
Innovation refers to the setting up of a new production function (Schumpeter, 1934). Mostly, the existing literature has described innovation in two perspectives, a process or an outcome perspective (Quintane, Casselman, Reiche, & Nylund, 2011). This study recognizes two scholarly contributions (Earle, 1997; Ruttan, 1977) to the emergence of innovation studies in food industry. Ruttan (1977) included technological change in the model for agricultural development, implying that technological innovation plays a role in agricultural development. Earle (1997) made two major contributions. First, the study described the nature of innovation in the food industry by paying attention to the interrelationships among cultural, political and social aspects. The description focused on the buyer-supplier relationships. Secondly, the study predicted that innovation trends in the food industry would be on the aspects related to packaging, food qualities, nutrition and food safety.
However, despite the aforementioned contributions, empirical studies on innovation in food industry gained pace after a framework by Grunert, Harmsen, Meulenberg, and Traill (1997). The framework proposes three constructs for describing innovation in food industry, namely process orientation, market orientation and product orientation. Following the framework, previous studies have paid more attention to product orientation (Gehlhar & Regmi, 2009; Khan, Kiat, & Grigor, 2017; Nazzaro et al., 2019) and market orientation (Bonjean, 2019; Nova et al., 2020; Nyagango, Sife, & Kazungu, 2023; Wyrwa & Barska, 2017), than to process orientation. Consequently, a standardized tool for measuring food process innovation and its uptake is lacking (Naila et al., 2024). Therefore, the current study addresses this deficiency by developing and validating a measurement scale for food process innovation and its uptake.
In doing so, previous attempts to measure innovation in the food industry are recognized. For instance, Kafetzopoulos and Skalkos (2019) proposed a scale for measuring a set of dynamic drivers for managing innovation capability in agri-food sector. Also, Dadura and Lee (2011) developed a scale to measure innovation ability of Taiwan’s food industry. However, these studies have not paid specific attention to process innovation and its uptake. This contrasts previous studies (Baregheh et al., 2012a, b; Grunert et al., 1997) which have established some clear distinctions between process innovation and other types of innovations, implying that there is a need for using distinct approaches to studying and measuring different types of innovation.
Furthermore, the present study recognizes a study by Baregheh et al. (2014), which has included process innovation as part of a general innovation measurement tool. Although the scale has recognized resources in terms of process, positioning and paradigm innovations, the contribution of such resources is not extensively explored. For instance, the scale has not adequately captured aspects related to value, rareness, inimitability and non-substitutability of both tangible and intangible resources. The current study argues for consideration of such aspects because other studies (Indrawati et al., 2020; Khan et al., 2020) suggest that both tangible and intangible resources may have some influence on the performance of innovation. Furthermore, a conceptual study by Crowther (2023) argues for consideration of sustainability during the implementation or the adoption of technological development. This means that, SMEs must be open and careful during the uptake of process innovation by paying attention to important aspects, including those related to resources.
2.2 Theoretical review
This study builds upon seminal works of Penrose (1959), Wernerfelt (1984) and Barney (1991) that have advanced theoretical foundations for the RBV. Penrose (1959) acknowledges the existence of a firm as a bundle of resources, categorizing two types of firm’s resources namely new resources (acquired or developed) and the existing resources. Wernerfelt (1984), explored the usefulness of analyzing firms from resources perspective instead of products perspective, viewing acquisition as a purchase of bundle of resources in a highly imperfect market. The pillars of RBV are resources heterogeneity and mobility barriers (Barney, 1991). In this respect, RBV assumes that the acquired resources vary across firms, and such different resources cannot be freely transferred across firms without incurring additional costs. Acknowledging the proposition of RBV, this study is embedded in three assumptions. First, the purchase of new food processing equipment or introduction of new food processing methods can be viewed as the acquisition of resources. Thus, the uptake of process innovation is viewed as the purchase of new processing equipment or the introduction of new processing methods. Secondly, the re-organization of acquired resources together with the existing ones leads to the introduction of new processing methods that may provide a firm with process innovation. Considering the condition of limited resources faced by SMEs operating in developing economies such as Tanzania (Li, 2018; Ringo et al., 2023), it is further assumed that SMEs struggle to acquire new resources while combining them with the existing ones, to enjoy unique benefits.
Following the underlying assumptions, the current study utilizes the dimensions of RBV (Barney, 1991), namely value, rareness, inimitability and non-substitutability to develop and validate a scale for measuring the uptake of food process innovations by SMES. In doing so, the efforts of previous studies which have utilized RBV in attempt to measure innovations are recognized. For instance, Lukovszki, Rideg, and Sipos (2020) utilized the RBV to identify corporate functions that contribute to the innovation success of SMEs with limited resources. The study identified management and Research and Development (R&D) as crucial functions in attaining the effectiveness of innovations for SMEs. Briefly, the study proposed the conceptual model of an RBV of product innovation in SMEs. Another study (Terziovski, 2010) utilized RBV to measure the effects of innovation practices on SMEs performance. The study found that SMEs and large firms are similar with respect to the way formality and innovation strategies are the key determinants to their performances; however, the SMEs do not appear to capitalize on innovation culture strategically and in structurally. Furthermore, other studies (i.e. Abu Bakar & Ahmad, 2010) utilized RBV to measure the contribution of firms resources to product innovation performance in Malaysia. The study established that, intangible resources are the main drivers of product innovation. The findings from these studies align to the expectations of RBV, suggesting that RBV can be utilized to measure aspects related to innovation. However, the studies have not paid adequate attention to different innovation types on separate accounts; especially on aspects related to process innovation and its uptake. According to García-Piqueres, Serrano-Bedia, López-Fernández, and Pérez-Pérez (2020), the relatedness among types of innovation (e.g. product, process marketing etc.) may not be necessarily strong. Hence, considering RBV while paying specific attention to process innovation may offer a different perspective.
2.3 RBV theory and process innovation
RBV is embedded in two pillars namely resources immobility and heterogeneity (Barney, 1991; Wernerfelt, 1984a). Building on these pillars, proponents of RBV assumes that, for firm’s resources to yield unique benefits, they must be different from other resources, and not being easily transferable to other firms. In this respects, Barney (1991) suggests that such resources must be valuable, rare, inimitable and non-substitutable. The connection between RBV and food process innovation is manifested in the framework for describing the uptake of process innovation, proposed by Naila et al. (2024). Building on systematic literature review, the framework identifies two approaches to describing the uptake of food process innovations, the acquisition of new food processing equipment (Capitanio, Coppola, & Pascucci, 2009) and the introduction of new food processing methods (Brewin, Monchuk, & Partridge, 2009; Sua, Ramis-pujol, & Estrada-robles, 2012). Considering the new equipment and methods as resources, the framework proposes that, such resources must be valuable, rare, inimitable and non-substitutable, for their acquisitions to be considered as the uptake of food process innovations.
Another connection between RBV and process innovation is exhibited in the proposed resource-based product and process innovation model by Cho and Linderman (2020). Particularly, the model posits that those firms which rely extensively on knowledge-based resources are more likely to prioritize process innovation over product innovation. Building on the RBV perspective (Barney, 1991), the model view resources as all assets under a firm's control that empower it to design and execute strategies aimed at enhancing efficiency and effectiveness. Building on the connection between RBV and process innovation the present study describes the uptake of food process innovations in terms of value, rareness, inimitability and non-substitutability of new food processing equipment and methods.
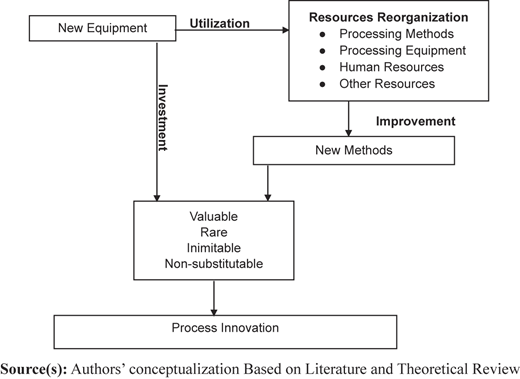
In this respect, the proposed conceptual framework in Figure 1 assumes that the uptake of food process innovation may start with investing in new processing equipment. Furthermore, for new processing equipment to be efficiently utilized, other resources must be involved – a situation which may require reorganization of resources. Subsequently, the reorganization of the existing resources together with new equipment may pave a way to the introduction of new processing methods. Furthermore, the framework assumes that processing equipment and methods cannot reflect the uptake of process innovation, simply because of their novelty. Instead, the uptake of process innovation may be reflected by the new processing equipment and methods that are valuable, rare, inimitable and non-substitutable.
2.4 RBV insights on process innovation and hypothesis development
2.4.1 Value of new processing equipment or methods
RBV considers resources to be valuable if they can facilitate a firm to design and execute strategies of improving efficiency and effectiveness (Barney, 1991). However, the description of valuable resources in the context of RBV has received its share of criticism. Some of the critics (i.e. Lockett, Thompson, & Morgenstern, 2009; Priem & Butler, 2001a, b) have challenged RBV due to its tautological nature observed in the explanation of the relationship between value of resources and sustainable competitive advantage. To avoid the effect of such a tautological nature, this study adopts the approach suggested by Kraaijenbrink, Spender, and Groen (2010), by assuming that a combination of acquired resources (new equipment and new processes) can provide a firm with unique benefits, if combined with the existing resources. In this respect, sustainable competitive advantage is not the focus of this study.
Furthermore, recent studies in Africa (Agyabeng-Mensah, Ahenkorah, Afum, & Owusu, 2020; Grosse, Wocke, & Mthombeni, 2023) have shown that sustainable competitive advantage may be influenced by a firm’s size. Considering the small size nature of SMEs in Tanzania, the present study assumes that sustainable competitive advantage may be a wider concept, which is pragmatically limited to larger firms, and cannot be easily achieved by SMEs, especially those operating in developing countries such as Tanzania. In this respect, the focus of this study is limited to the SME’s utilization of newly acquired resources (new food processing equipment and methods) together with the existing resources to enjoy unique benefits that are not enjoyed by others.
Therefore, in this study, the value dimension is limited to costs and benefits of the uptake of process innovation. According to Perrea, Grunert, and Krystallis (2014), the value of innovation within food industry can be perceived in terms of the respective economic benefits and costs. In the context of SMEs in Africa, economic benefits and costs of innovation can be measured in terms of reduced production costs, reduced bottlenecks, reduced delivery costs and improved quality costs (Oduro, 2019). Following this approach, some studies in Africa (Papagianni et al., 2021; Serumaga-Zake & van der Poll, 2021) have attempted to address the aspects related to measuring costs and benefits of innovation by SMEs. However, such studies appear to have been biased towards customer perspective than firm perspective. To address this biasness, the present study focuses on costs and benefits of the uptake of process innovation. In doing so, the cost and benefits will be limited to the operations that are within the SMEs. Hence, regarding the value dimension, the following research hypotheses are proposed.
The purchase of new food processing equipment provides a firm with value.
The introduction of new food processing methods provides a firm with value.
2.4.2 Rareness of new processing equipment or methods
The RBV posits that being only valuable, firm resources cannot guarantee the sustainability of unique benefits (Barney, 1991; Wernerfelt, 1984a). In this regard, a firm can continue to enjoy the unique benefits if it can utilize its resources to formulate and execute valuable strategies that are not simultaneously executed by other firms (Barney, 1991). In this respect, the present study assumes that new food processing equipment or methods can enable the firm to enjoy unique benefits, if such equipment or methods can be utilized in unique ways (rare) among other firms. Following this assumption, rareness is proposed as a construct for measuring the uptake of process innovation.
The choice of rareness as a construct is motivated by previous studies (Li, 2018; Ringo et al., 2023), which suggest that SMEs in developing countries operate under limited resources – implying the possibility of an SME to introduce rare ways of utilizing its limited resources (both the existing and acquired). In that respect, the success of such SMEs depends on the ability to utilize such resources in unique and unpopular manners that enable them to sustain their operations (Li, 2018). Thus, regarding the rareness construct, the following research hypotheses are proposed:
The purchase of new food processing equipment provides a firm with rareness.
The introduction of new food processing methods provides a firm with rareness.
2.4.3 Inimitability of new processing equipment or methods
The RBV posits that a firm can only enjoy the benefits associated with valuable and rare resources if firms that do not have such resources cannot obtain or copy them (Barney, 1991). Following this position, the present study assumes that a firm’s acquisition and utilization of new equipment or processes in a way that cannot be easily copied by other firms determines the uptake of process innovation. Furthermore, Barney (1991) proposes three conditions for firms valuable and rare resources to be inimitable. These conditions are firm’s unique historical conditions, causal ambiguity of the link between the rare valuable resources and the benefits that can be obtained from such resources, and social complexity surrounding the utilization of rare and valuable resources. This study acknowledges these conditions. However, given the life span of SMEs, that is mainly characterized with short history, the unique historical condition is not considered in this study. Also, because competitive advantage is not the subject matter in this study, causal ambiguity of the link between resources and sustained competitive advantage is not considered. Instead, inimitability is considered from the perspective of the ability of other firms to easily acquire new processing equipment or copy the newly introduced processing methods.
Therefore, the present study proposes inimitability as a measurement construct for the uptake of process innovation. The consideration of inimitability is embedded on the assumption that the transferability of the way firms utilized newly acquired processing equipment or introduced processing methods describes the uptake of process innovation. In this respect, Barney (1991) recognizes that for physical resources such as new equipment to offer unique benefits to a firm, they must be utilized uniquely in a way that other firms cannot copy. Hence, the following research hypotheses are proposed.
The purchase of new food processing equipment provides the firm with inimitability.
The introduction of new food processing methods provides the firm with inimitability.
2.4.4 Non-substitutability of new processing equipment
According to Barney (1991), substitutability can take at least two forms. First, the possibility of the firm substituting two similar resources, which can be used to perform similar tasks, and hence attain similar benefits. Secondly, the possibility of a firm to substitute two different resources, which can be used to perform similar tasks, and hence attain similar benefits. Following this position, the present study builds on three assumptions. First, the purchase of new equipment or introduction of new processing methods can be considered as the acquisition of resources, which can be used to enable a firm gain unique benefit. Secondly, for valuable, rare and inimitable resources to enable a firm outperform others, other firms must not have similar resources, which can be utilized to perform the same tasks. Thirdly, for a firm to uniquely benefit from valuable, rare and inimitable resources, other firms must not be able to gather different resources, which can be used to perform similar tasks. Hence, the following research hypotheses are proposed.
The purchase of new food processing equipment provides a firm with non-substitutability.
The introduction of new food processing methods provides a firm with non-substitutability.
3. Methodology
3.1 Study area and design
This study was conducted in Dar es Salaam, Morogoro, Dodoma and Mwanza regions in Tanzania. These regions were selected because of time and financial constraints. In this respect, the location of the selected regions enabled the minimization of time, and financial resources required during data collection. Furthermore, Mwanza, Dodoma, and Morogoro regions hosted the national agricultural exhibitions for the lake, central and coastal zones respectively – a condition which provided easy access to the respondents who were participating in the exhibitions.
A cross-sectional research design was adopted and guided by critical realism as a philosophical research paradigm. Critical realism is embedded on the assumption that there is a reality; however, inquiry from multiple sources is required to reveal it (Healy & Perry, 2000). In this regard, inquiries such as quantitative data collection approaches may be required to experience and confirm the truth behind the existing reality. Critical realism was deemed appropriate for this study because of two reasons. First, critical realists argue that if something is not observable, it does mean it does not exist (Nandonde, 2016). Following this argument, the present study assumed that even though process innovation and its uptake may not be physically observed, that does not mean it cannot be investigated and measured. Secondly, critical realism also assumes that the researcher has prior knowledge of the research topic, and that knowledge is based on the existing theory and empirical literature (Easton, 2010; Roberts, 2014).
Therefore, the present study utilizes prior knowledge in the existing literature and theoretical foundations of RBV to develop and validate a scale for measuring process innovation and its uptake, through a survey of owners/managers for food processing SMEs. The choice of SMEs’ owner-managers as a unit of analysis was motivated by Ismail (2023) who exhibited that owner/managers are in a good position to offer information related to SMEs they manage.
3.2 Sample and sampling design
This study involved a survey conducted in four selected regions of Tanzania, namely Dar es Salaam, Morogoro, Dodoma and Mwanza. These regions were purposively chosen for several reasons. First, Tanzanian urban centers, particularly Dar es Salaam, Dodoma and Mwanza, are known to host a significant concentration of SMEs, including those operating in the food processing sector (FSTD, 2012). Second, Dodoma and Morogoro were identified as strategic hubs for agricultural process innovations, attributed to their high levels of agricultural productivity and the presence of research institutions such as the University of Dodoma and Sokoine University of Agriculture (Peter & Mwanyoka, 2023). Furthermore, these regions were selected due to their role in hosting zonal agricultural and agribusiness exhibitions for the coastal, central and lake zones, thereby facilitating access to food processing SMEs participating in these exhibitions.
Two sampling techniques were employed in this study. The initial approach involved systematic sampling, whereby samples were drawn from lists of food processing SMEs obtained from the respective SIDO regional offices. As recommended by Chernick and Friis (2003), systematic sampling is appropriate when a comprehensive list of the target population is available. This method initially yielded responses from 111 SMEs in Dar es Salaam and Mwanza. However, the response rate was insufficient for conducting multivariate analysis, as per the recommendations of Hair, Black, Babin, and Anderson (2019). The low response rate was attributed to the geographical dispersion of respondents and their reluctance to participate in the study. Consequently, a supplementary sampling method was deemed necessary.
The second sampling approach involved the use of convenience sampling to identify respondents from SMEs participating in regional agricultural and agribusiness exhibitions. This method is considered suitable in contexts where the target population is concentrated in a single location and can provide relevant data (Clark, 2017). Additionally, convenience sampling is noted for being cost-effective, efficient and straightforward to implement (Jager, Putnick, & Bornstein, 2017). To mitigate potential biases associated with convenience sampling, the approach was complemented with probabilistic techniques. Specifically, exhibition sites showcasing products from food processing SMEs were identified, and lists of participating SMEs were obtained from exhibition organizers. Systematic sampling was then applied to these lists, consistent with the guidelines provided by Chernick and Friis (2003). After this approach, a total of 317 sample size was obtained, which is appropriate for multivariate analysis as recommended by Hair et al. (2019).
3.3 Questionnaire development and testing
This study adopted the generally accepted steps for instrument design and validation (Churchill, 1979), namely identification of the domain of the construct, items generation, categorization of the items, data collection, reliability test and validity tests. The “uptake of process innovation” was identified as the domain of the construct. The description of process innovation and its uptake was guided by the conceptual framework in Figure 1. Item generation and categorization were guided by previous studies (Churchil, 1979; Rasoolimanesh, Ali, Mikulić, & Dogan, 2023) which suggest several procedures for items generation and categorization, including literature review, expert survey and or group discussion. The, RBV theory was utilized to develop four latent constructs, namely value, rareness, inimitability and non-substitutability of new food processing equipment and methods. Based on the propositions of RBV theory (Barney, 1991; Wernerfelt, 1984a) and a literature review-based study by Naila et al. (2024), 22 measurement items were proposed. To attain rigor, the items were shared with experts comprising PhD students, academic staff in the fields related to business and innovation, and innovation experts from SIDO. The major refining done after experts’ review was the inclusion of the items relating to the reduction of operation costs.
Following the measurement items, a questionnaire was developed and pre-tested. The questionnaire had two parts, the respondents’ profiles, and the proposed measurement items. During pre-testing, it was observed that the “initiation of new processing methods” was not an applicable term among the respondents. Following the pre-testing, the questions were refined by replacing “initiation of new processing methods” with “introduction of new processing methods.” Then, a five-point Likert scale was utilized to collect data for scale validation. The respondents were required to indicate their level of agreement on the items based on how well they reflect the situation in their SMEs, ranging from 1 = strongly disagree to 5 = Strongly agree. The questionnaires were administered by enumerators who visited the respondents, to their business sites for those who were accessed through a list obtained from SIDO, and to their exhibition sites for those who were accessed through the agricultural and agribusiness exhibitions. Before data collection, the enumerators were trained to familiarize with the questions and procedures for administering the questionnaires. A total of 317 responses were obtained. Two responses were dropped due to missing data in most variables. Therefore, 315 responses were available for analysis. The response size is satisfactory for multivariate data analysis (Hair et al., 2019). Table 1 provides a summary of respondents’ profiles.
Characteristics of respondents
| Location | Gender | ||||
|---|---|---|---|---|---|
| Region | Frequency | Percentage | Gender | Frequency | Percentage |
| Morogoro | 101 | 31.86 | Male | 139 | 44.13 |
| Mwanza | 97 | 30.6 | Female | 176 | 55.87 |
| Dar es Salaam | 70 | 22.08 | |||
| Dodoma | 49 | 15.46 | |||
| Total | 317 | 100 | 315* | 100.00 | |
Note(s): *Two respondents were dropped due to missing data in most variables
Source(s): Research survey (2023)
3.4 Methods of data analysis
Data were analyzed using Statistical Package for Social Sciences (SPSS) and Smart Partial Least Squares (Smart PLS4)-SEM software, for Explanatory Factor Analysis (EFA) and Confirmatory Factor Analysis (CFA) respectively. Sphericity test and Measure of Sampling Adequacy (MSA) were performed to test the suitability of factor analysis method in data reduction. The Bartlett test which measures sphericity was significant at p < 0.01. The Kaizer-Meyer-Olkin (KMO) test, which measures MSA was found to be 0.98, which is acceptable (Cleff, 2019).
The EFA was conducted on four latent constructs, using varimax rotation and involved two stages. In the first stage, the analysis was limited to four predetermined factors, based on the framework for describing food process innovation (Naila et al., 2024), and the theoretical propositions of RBV (Barney, 1991; Wernerfelt, 1984b). The factors were value, rareness, inimitability and the non-substitutability of the new food processing equipment and methods. After the first stage, two factors namely, rareness and non-substitutability with seven respective measurement items were dropped. The retention criteria was based on factors having items with ladings of 0.7 and above, as recommended by Hair et al. (2019) In the second stage, the EFA was conducted using varimax rotation and limited to the two remaining factors. Eight items were dropped because of cross loading (Hair et al., 2019). Therefore, the proposed scale was reduced to two constructs (value and inimitability) with seven measurement items. The cumulative total variance explained, which measures explanatory power of the model was 93.2%, exceeding a threshold of 60% as recommended by Hair et al. (2019). Tables 2 and 3 provide details related to the variance explained, and a list of proposed constructs and their respective items, indicating the dropped items and reasons for dropping.
Total variance explained
| Component | Initial eigenvalues | Extraction sums of squared loadings | Rotation sums of squared loadings | ||||||
|---|---|---|---|---|---|---|---|---|---|
| Total | % of variance | Cumulative % | Total | % of variance | Cumulative % | Total | % of variance | Cumulative % | |
| 1 | 5.581 | 79.723 | 79.723 | 5.581 | 79.723 | 79.723 | 3.599 | 51.418 | 51.418 |
| 2 | 0.945 | 13.505 | 93.228 | 0.945 | 13.505 | 93.228 | 2.927 | 41.810 | 93.228 |
| 3 | 0.120 | 1.720 | 94.949 | ||||||
Source(s): Authors’ analysis
Proposed measurement constructs and items
| Construct | Items | Code |
|---|---|---|
| Value | The processing methods introduced during the last three years have reduced the time required to produce our products | V1** |
| The processing equipment purchased during the last three years have reduced time required to produce our product | V2** | |
| The processing methods introduced during the last three years have reduced the operations costs | V3 | |
| The processing equipment purchased during the last three years have reduced the operations cost | V4 | |
| The processing methods introduced during the last three years have reduced the number of rejects | V5 | |
| The processing equipment purchased during the last three years have reduced the number of rejects | V6 | |
| The processing methods introduced during the last three years have reduced the quantity of raw materials used per product | V7** | |
| The processing equipment purchased during the last three years have reduced the quantity of raw materials used per product | V8** | |
| The processing methods introduced during the last three years have reduced labor costs per month | V9** | |
| The processing equipment purchased during the last three years have reduced labor cost per month | V10** | |
| The processing methods introduced during the last three years have increased the number of customers | V11** | |
| Non-substitutability* | Task performed using the processing equipment purchased during the last three years can be performed by other equipment | S1 |
| The benefits of using processing methods introduced during the last three years can be obtained through other processing methods | S2 | |
| The benefits of using processing equipment purchased during the last three years can be obtained from other equipment | S3 | |
| Inimitability | The processing methods Introduced during the last three years can be easily adopted or initiated by other food processors | I1 |
| The knowledge required for implementing the processing methods introduced during the last three years can be easily acquired by other food processors | I2 | |
| The processing equipment purchased during the last three years can be easily acquired by other food processors | I3 | |
| The knowledge required for using the processing equipment purchased during the last three years can be acquired by other processors | I4** | |
| Rareness* | The processing methods introduced during the last three years are highly unique compared to methods which existed before | R1 |
| The processing equipment purchased during the last three years are highly unique compared to equipment which existed before | R2 | |
| The processing methods introduced during the last three years are not commonly used among other food processors | R3 | |
| The processing equipment purchased during the last three years are not commonly used among other food processors | R4 |
Note(s): The dropped constructs and items are italicized; *Dropped constructs; **dropped items
Source(s): Authors’ analysis
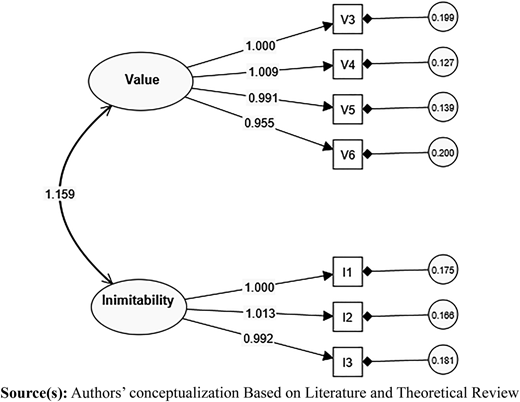
Eigenvalues was computed to determine the amount of variance explained by each factor. Literature (Cleff, 2019; Hair et al., 2019) recommends a cut-off point of a factor with Eigenvalue greater or equal to 1, in determining the number of factors to retain. However, in the case of the present study, the number of factors to retain were already predetermined from theoretical and empirical basis. In this respect, the Eigenvalues and respective variances were utilized to explain the extent to which the retained factors explain the variations (Hair et al., 2019). The CFA was performed to display a visual representation of a measurement scale and to determine the strength of the relationships between the constructs and their respective measurement items. The visual outcome of CFA is displayed in Figure 2. The correlation between the constructs and their corresponding measurements items were significant at p < 0.05 significant levels, implying that the constructs are related to the same domain.
4. Findings
4.1 Demographic characteristics of respondents
Table 4 provides a summary of demographic characteristics of respondents. Among the 315 respondents, 54.9% were female, while 45.1% were male. This indicates that most surveyed SMEs were owned by females. This finding contrasts with the Statistical Business Register Report (NBS, 2016), which reports that 51% of registered businesses in Tanzania are male-owned. The discrepancy may be attributed to recent efforts and incentives aimed at fostering women’s investments in Tanzania, particularly in agricultural processing. For instance, the Equal Opportunities for All Trust Fund (EOTFTZ), through its Women in Poverty Eradication (WIPE) program, has played a significant role in promoting women’s participation in agricultural processing activities.
Demographic characteristics of respondents
| Frequency | Percentage | |
|---|---|---|
| Gender | ||
| Male | 142 | 45.08 |
| Female | 173 | 54.92 |
| 315 | 100.00 | |
| Location | ||
| Morogoro | 101 | 32.06 |
| Mwanza | 97 | 30.79 |
| Dar es Salaam | 70 | 22.22 |
| Dodoma | 47 | 14.92 |
| 315 | 100.00 | |
| Business registration | ||
| Registered | 243 | 77.14 |
| Unregistered | 72 | 22.86 |
| 315 | 100.00 | |
| Taxpayer identification number | ||
| Yes | 235 | 74.60 |
| No | 80 | 25.40 |
| 315 | 100.00 | |
| TBS certification | ||
| Certified | 161 | 51.11 |
| Not certified | 154 | 48.89 |
| 315 | 100.00 | |
| Average age of business | 4.57 years | |
| Average number of workers | 4 | |
Source(s): Authors’ analysis
In terms of geographical distribution, most of the surveyed SMEs were in Morogoro (32.06%), followed by Mwanza, Dar es Salaam and Dodoma. These findings align with the Annual Survey of Industrial Production Statistical Report (NBS, 2016a), which highlights Morogoro as one of the regions with the highest concentration of agricultural processing establishments. The data further reveal that 77.14% of the surveyed SMEs were registered, reflecting a high level of formalization among respondents. Similarly, 74.6% of SMEs possessed a taxpayer registration number, reinforcing the observed trend of formalization. These results are consistent with the MSMEs National Baseline Survey Report (FSTD, 2012), which documented a high degree of formalization among SMEs in Tanzania.
However, regarding certification by the Tanzania Bureau of Standards (TBS), there was minimal difference between registered and unregistered SMEs. This may be explained by the stringent procedures required to obtain TBS certification. Additionally, the findings indicate that the average age and number of employees among the surveyed SMEs were 4.7 years and four workers, respectively. This suggests that most of the surveyed SMEs are relatively young, with an operational lifespan of less than five years. This trend may be attributed to the low survival rate of SMEs, a phenomenon commonly observed across Africa.
4.2 Construct validity and reliability
The Average Variance Extracted (AVE), Composite Reliability (CR) and Cronbach’s Alpha coefficients were tested to determine the validity and reliability of the latent constructs. Table 5 provides a summary of reliability and validity tests. AVE for all constructs exceed a threshold of 0.5 as recommended by Hair et al. (2019), confirming convergent validity. This implies that, the model explains more than 50% of variations among indicators measuring the same construct. Discriminant validity was tested by comparing the AVE with shared variance (i.e. square of correlation) between the two latent factors (Corr2). For both factors, the AVE was greater than Corr2, confirming the discriminant validity (Hair et al., 2019). Composite Reliability (CR) for both constructs were within the acceptable values of above 0.7 (Hair et al., 2019). Cronbach’s Alpha coefficients for both constructs exceeded a minimum value of 0.7, confirming internal reliability (Cleff, 2019). This implies that all the items constantly measure their respective constructs.
Constructs validity and reliability
| Constructs | Item | Loading* | Corr2** | AVE | CR |
|---|---|---|---|---|---|
| Value | 0.524 | 0.910 | 0.976 | ||
| V3 | 0.947 | ||||
| V4 | 0.966 | ||||
| V5 | 0.961 | ||||
| V6 | 0.942 | ||||
| Inimitability | 0.524 | 0.895 | 0.962 | ||
| I1 | 0.946 | ||||
| I2 | 0.949 | ||||
| I3 | 0.943 |
Note(s): *Represent unstandardized loadings, **Squared correlations between the factors
Source(s): Authors’ calculations based on SMEs survey (2023)
The fitness tests were conducted to determine the fitness of the proposed scale to the measured data. Notably, the findings in Table 6 indicates that the chi-square test generated a probability level (p-value) of 0.04, which is below the recommended threshold of equal or greater than 0.05. However, it is recognized that the chi-square test is sensitive to sample size and model complexity (Hair et al., 2019). This means that this slight discrepancy may not exhibit model misfit. Except for the chi-square test, all the fit indices are within the acceptable values. For instance, The Root Mean Square Error of Approximation (RMSEA) value of 0.066 is within the recommended value of less than 0.08 (Hu & Bentler, 1998). This means that the measurement model captures the data, although not perfectly. In this respect, the RMSEA implies that the model rationally approximates the suitable population structure without being over-stated. Moreover, Comparative Fit Index (CFI) and Tucker–Lewis’s Index (TLI) of 0.994 and 0.991 respectively are within the acceptable values of greater than 0.9 (Hair et al., 2019). CFI evaluates the model fit by examining the divergence between the assumed model and data, while considering the aspect of sample size. In the context of this study, the CFI value implies that the discrepancy between hypothesized model and data is within the statistically acceptable limits. This is augmented by the TLI value which is also within the acceptable limit.
Goodness fit indices
| Fit indices | Measurement scale | Acceptable fit indices* |
|---|---|---|
| Absolute fit indices | ||
| Chi-square (x2) | 30.752 | 0 ≤ χ2 ≤ 2df |
| Degrees of freedom (df) | 13 | |
| Probability level | 0.004* | p > 0.05 |
| Root mean square of approximation (RMSEA) | 0.066 | <0.08 |
| Incremental fit indices | ||
| Tucker–Lewis’s Index (TLI) | 0.991 | >0.90 |
| Comparative fit index (CFI) | 0.994 | >0.90 |
| Parsimonious fit indices | ||
| Chi-square/degrees of freedom (χ2/df) | 2.36 | <3.0 |
| Normed fit index (NFI) | 0.99 | >0.50 |
| Goodness of fit index (GFI) | 0.973 | >0.50 |
| Adjusted goodness of fit index (AGFI) | 0.941 | >0.50 |
Note(s): *Acceptable under large sample size (N > 250), and when other fit indices (RMSEA, TLI, CFI, NFI, GFI and AGFI) are within the acceptable threshold (Hair et al., 2019)
Source(s): Authors’ analysis
The normed chi-square (χ2/df) of 2.36 is within the acceptable limit of less than 3, suggesting a good fit. This implies that the hypothesized model satisfactorily expounds the relationships in the data. Furthermore, the Normed Fit Index (NFI), Goodness Fit Index (GFI) and Adjusted goodness of fit index (AGFI) of 0.99, 0.973 and 0.941 respectively are withing the recommended threshold of greater than 0.5. NFI measures the improvement fit of the hypothesized model in comparison to the null model – which assumes that variables are uncorrelated. GFI measures the amount of covariance matrix which is accounted for the hypothesized model. In doing so, it implies the extent which the model replicates the real data. AGFI assesses the share of variance and covariance explained by the model, fine-tuning for the loss of degrees of freedom due to the approximation of parameters. Together, the acceptable values of NFI, GFI and AGFI confirm the Parsimonious fit of the model.
5. Discussion and implications
This study aims to develop and validate a scale for measuring the uptake of process innovation in the food industry through a survey of food processing SMEs. In doing so, four constructs namely value, rareness, inimitability and non-substitutability of new processing equipment and methods, were proposed to describe the uptake of process innovation. The analysis of findings confirms the uptake of process innovation can be measured using seven measuring items related to value and inimitability of the new food processing equipment and methods. Contrary to our initial proposition, the findings suggest that the items related to non-substitutability and rareness are not statistically confirmed as valid measures of the uptake of food process innovations. There may be two possible explanations for these observations. First, as contended by Nandonde, Lubawa, and Liana (2015), the uptake of innovation by SMEs in developing countries such as Tanzania is merely based on what is available in the market. In this respect, the new processing equipment, and methods available in the market may be easily purchased or accessed by food processing SMEs. Thus, such new equipment and methods cannot be rare or non-substitutable. This implies that items related to rareness and non-substitutability may not be reliable measures of the uptake of food process innovations.
Secondly, previous studies (César, Nascimento, Jeronimo, Granja, & Mendes Primo, 2021; Deschênes, 2023) suggest that resources management practices may vary across SMEs in the quest for attaining efficiency. This implies that although SMEs may have similar unlimited access to non-rare and substitutable resources, the approaches and practices deployed to manage such resources may vary. Related to these observations, the present study has confirmed that SMEs can have unlimited access to substitutable resources but attain difference in value by applying inimitable resource management practices. In this respect, measuring the uptake of process innovation from resource-based view perspective may be described by items related to value and inimitability.
Therefore, the findings strongly support the acceptance of hypotheses related to Value and inimitability (RH1a, RH1b, RH3a and RH3b) and rejections of the hypotheses related to rareness and non-substitutability (RH2a, RH2b, RH4a and RH4b). This implies that the new processing equipment and new processing methods provide the firm with value and inimitability. In this respect, the uptake of process innovation can be measured using seven indicators related to value and inimitability of the new food processing equipment and methods. The value of new processing equipment and methods assumes four items. The four items reflect the contribution of new processing equipment and methods to reduce defects and operations costs. These observations are consistent with Barney (1991), who defines value in terms of effectiveness and efficiency.
Also, the findings suggest that inimitability of new processing equipment and methods can be measured by three items. The items reflect two measurement aspects, the possibility of the new equipment to be acquired by other firms, and whether other firms can easily copy the knowledge used to apply new processing equipment and methods. These observations are consistent with Barney (1991), who recognizes that for new resources to add unique benefits they must be utilized in such a way that others cannot copy.
Furthermore, this study has attempted to address the lack of measurement scales for innovation in food industry. In doing so, this study has attempted to answer previous studies (Avermaete & Morgan, 2003; Baregheh et al., 2012a, b; Bruce Traill & Meulenberg, 2002; Naila et al., 2024), which have called for development of measurement scale for innovation in food industry. Subsequently, the present study has initiated a discussion on theoretical foundations behind the uptake of food process innovations, from a resource-based view perspective. Furthermore, the present study has utilized the empirical foundations from previous studies to show that the description of process innovation as an investment in new processing equipment (Capitanio et al., 2009) and methods (Brewin et al., 2009; Sua et al., 2012) can be utilized as a point of departure in an attempt to measuring the uptake of food process innovations.
Following the findings, the present study has three practical implications. First, the study informs food processors, managers and owners that the uptake of food process innovations can be described or viewed from the perspective of investment in new processing equipment and processing methods. Furthermore, a process innovation can be measured from RBV perspective with respect to value and inimitability. The proposed scale can be used by organizations such as SIDO and other innovation promoters to evaluate the uptake of process innovation by food processing SMEs. Secondly, the scale advanced in this study offers a starting point for further research on aspects related to the uptake of process innovation by food processing SMEs. Finaly, the proposed scale can be used as a point of departure for measuring the uptake of innovation in other contexts as well as beyond food industries. This can be achieved under resource-based view perspective, in the context of this study and the descriptive framework by Naila et al. (2024), which alt together view the uptake of innovation as acquisition of resources which are valuable, rare, inimitable and non-substitutable.
6. Conclusion and recommendations
This study has advanced a scale for measuring the uptake of food process innovations from resources-based perspective. The study confirms that the uptake of process innovation can be described in terms of valuable and inimitable new food processing equipment and methods. In this respect, value and inimitability of new food processing equipment and methods are confirmed as valid constructs for describing the uptake of process innovations by food processing SMEs.
The limitation of this study is threefold. First, the development of latent constructs is limited to the conceptual framework based on the RBV, implying the lack of consideration of external environment, as well as aspects related to dynamic capabilities and absorptive capacity. Secondly, the proposed scale is tested and validated based on a sample of small food processors in Tanzania – a condition, which may limit its generalizability. Following these limitations two avenues for further studies are proposed. Furthermore, this study has not established significant evidence to support the utilization of items related to rareness and non-substitutability of new food processing equipment and methods, as valid measure of the uptake of food process innovation. While the reasons for this insignificance are highlighted in the discussion section, it may also be considered as a limitation resulting from the nature of sampled SMEs.
First, further study may extend the proposed scale by considering external factors and theoretical assumptions, which are beyond the framework adopted in the present study. In this respect, the network and social exchange theories, and consideration of aspects related to dynamic capabilities and absorptive capacity may offer a wider perspective. Furthermore, to address the second limitation, more studies can be conducted to test the proposed scale in countries other than Tanzania, and under considerations which are beyond the SMEs. In doing so, such studies may pay attention to all dimensions of RBV, because the insignificance of items related to rareness and no-substitutability implies in the present study, could be due the nature of SMEs in Tanzania where the sampling frame was based on.
Funding: The data collection phase was funded by the African Economic Research Consortium (AERC).

