


The research explores the impact of e-commerce reverse logistics practices on the circular economy. It uses the Five R’s model to evaluate these practices. The objectives are to assess the effectiveness of these strategies, identify areas for improvement and develop practical recommendations for e-commerce companies to integrate sustainable practices into their operations.
The study analyzes data on reverse logistics partnerships and recovery services in southern India using a Non-probabilistic sampling method. The data was collected from 208 samples, spanning from December 2023 to March 2024. Structural Equation Modeling (SEM) was used to validate the model and hypotheses. A structured questionnaire was created to explore reverse logistics practices and their connection to the circular economy.
The study found that circular economy principles, reverse logistics practices, technology information systems and supply chain design significantly impact productivity and sustainability. These factors account for 36% of performance metrics variation, with productivity standing at 38% and sustainability at 27%. To enhance sustainability, e-commerce businesses should adopt comprehensive strategies, including consumer education, optimizing reverse logistics systems, investing in technology and collaborating across the supply chain. Expanding research, benchmarking against industry best practices and addressing consumer behavior challenges can also contribute to a circular economy.
The research explores the integration of circular economy principles into e-commerce, focusing on reverse logistics and circular economy initiatives. It introduces the Five R’s model for developing customized sustainability strategies and validates these frameworks through factor analysis and statistical modeling.
1. Introduction
The rapid expansion of e-commerce has reshaped global retail, offering consumers convenience and accessibility while simultaneously intensifying environmental challenges, particularly concerning product returns and end-of-life disposal. The increasing volume of returned goods and inefficient disposal practices contribute to resource depletion, waste accumulation and higher carbon emissions, necessitating the urgent adoption of sustainable solutions (Agrawal, Singh, & Murtaza, 2016). Businesses are increasingly implementing green supply chain strategies in response to environmental concerns, regulatory requirements and competitive market pressures. A circular economy approach has emerged as a key strategy to mitigate the environmental footprint of e-commerce operations by integrating reverse logistics and sustainable supply chain practices to enhance resource efficiency and minimize waste. While traditional brick-and-mortar retailers have long invested in infrastructure for repair, refurbishment and material recovery to reduce waste, e-commerce businesses face unique challenges in managing returned products, necessitating innovative sustainability frameworks. This study applies the Five R’s model–refuse, reduce, reuse, repurpose and recycle–to assess the effectiveness of circular economy initiatives in e-commerce reverse logistics, focusing on key areas such as return management, packaging optimization, sustainable transportation and consumer engagement. The findings will offer insights into how businesses can enhance sustainability through eco-friendly packaging, optimized logistics, strategic collaborations with recycling partners and the integration of emerging technologies like AI and blockchain for greater supply chain transparency. Furthermore, this research examines the role of regulatory frameworks, technological advancements and consumer awareness in driving sustainable practices, emphasizing the importance of continuous innovation, strategic partnerships and performance indicators (KPIs) to track sustainability progress. By bridging theoretical circular economy models with practical business applications, the study provides actionable recommendations for fostering environmental responsibility in e-commerce. The core research problem lies in the inefficiencies and environmental costs associated with managing returned products, as the rising volume of online shopping has led to an unprecedented increase in returns, often resulting in excessive waste and resource consumption that contradicts consumer and regulatory demands for sustainability. Without a strategic shift toward circular economy practices, e-commerce companies risk exacerbating environmental damage and failing to meet evolving sustainability standards. The research evaluates the effectiveness of the five R’s model in reverse logistics, establishes key performance metrics and identifies areas for improvement. It addresses the critical need for e-commerce businesses to integrate circular economy principles into their supply chains to mitigate environmental impacts while optimizing cost savings, inventory management and revenue opportunities from repurposed or recycled products. Through an in-depth analysis of circular economy applications in e-commerce, this study contributes to academic discourse while also raising consumer awareness about sustainable e-commerce practices. The primary objectives include assessing how the five R’s model can enhance sustainability in e-commerce reverse logistics, exploring how circular economy adoption can drive business efficiency and competitiveness and identifying innovative technologies and best practices that support the implementation of sustainability principles. Research questions focus on how the five R’s model can be effectively integrated into e-commerce supply chains, which areas hold the greatest potential for waste reduction and resource reuse, and how businesses can proactively adopt sustainability practices to maintain long-term competitiveness. By structuring the study around these core themes, this research aims to provide strategic recommendations and practical insights for businesses seeking to integrate circular economy principles into their supply chains, ultimately driving a more sustainable e-commerce landscape.
2. Review of literature and hypotheses development
2.1 Supply chain management and circular economy
Transitioning from ownership to leasing in supply chains enhances structural flexibility, integrates open and closed material loops, fosters collaboration and leverages procurement strategies from both the public and private sectors. These factors play a crucial role in developing circular business models (De Angelis, Howard, & Miemczyk, 2018). Circular economy (CE) initiatives are transforming production and consumption patterns across different regions. By applying a CE perspective to supply chain management (SCM), this study explores strategies for transitioning from linear to circular models. Additionally, it provides a conceptual framework and research agenda to guide practitioners and researchers in adapting existing supply chain processes (Hazen, Russo, Confente, & Pellathy, 2021). Packaging significantly influences product movement while also generating waste. The increasing complexity of global supply chains has resulted in excessive packaging layers. A review of sustainable packaging in supply chain management (SPSCM) over 18 years highlights its alignment with circular economy principles but lacks consideration of product interaction with packaging systems (Meherishi, Narayana, & Ranjani, 2019). Food waste reduction in supply chains can be achieved using a two-stage model. The primary chain produces, utilizes and discards waste, while the secondary chain collects and recycles it into livestock products. This model circulates waste efficiently and demonstrates cost reduction through sensitivity analysis (Sarkar, Debnath, Chiu, & Ahmed, 2022). Organizations are adopting sustainable practices to address environmental, social and economic challenges. Transitioning to a circular economy optimizes resource use, energy efficiency and waste management. Analyzing supply chain transformation from linear to circular models, this study emphasizes six key principles–recover, reuse, remanufacture, recycle, redesign and reduce–while exploring Industry 4.0 opportunities (Manavalan & Jayakrishna, 2019). Successful CE transitions require integrating product design with SCM decisions. Insights from 15 interviews in New Zealand highlight four key factors: end-of-life product design, circular SCM, business model innovation and sustainable organizational values (Burke, Zhang, & Wang, 2021). The link between sustainability and circular economy practices in supply chains is analyzed through structural equation modeling using UAE-based supply chain data. The study develops a framework emphasizing process facilitators and persuasive organizational narratives in circular supply chains (Hussain & Malik, 2020). Environmental commitment, social pressure and green economic incentives shape SCM, sustainable design and circular economy capabilities. A study of 212 SMEs confirms that green incentives and environmental commitment positively impact SCM, with social pressure playing a crucial role (Centobelli, Cerchione, Esposito, Passaro, & Shashi, 2021). Green Supply Chain Management (GSCM) is essential for optimizing resources in a circular economy, addressing environmental concerns and shifting consumption patterns. Companies must balance environmental, economic, logistical, organizational and marketing performance indicators (Kazancoglu, Kazancoglu, & Sagnak, 2018). The circular economy initiative in agriculture and agro-based industries supports waste-to-energy (WTE) conversion. However, efficient energy supply chain systems are necessary for success. This study examines key enablers such as life cycle assessment, economic potential cycles and value chain analysis, with survey data from Malaysian companies confirming their impact on WTE practices (Fernando, Tseng, Aziz, Ikhsan, & Wahyuni-TD, 2022).
2.2 E-commerce reverse logistics
Effectively managing e-commerce returns is crucial for businesses integrating circular economy principles. A structured three-stage circular reverse logistics framework has been developed, incorporating hierarchical clustering, a circular economy network and a mixed-integer linear programming model. Validated through a consumer electronics case study, this framework supports firms in optimizing reverse logistics networks and improving sustainability (Nanayakkara, Jayalath, Thibbotuwawa, & Perera, 2022). Reverse logistics is essential for the efficiency and expansion of B2C e-commerce, particularly in China. A proposed IoT-based system enhances operational effectiveness by establishing regional consortia led by local governments and fostering collaboration between businesses and policymakers. Cost and responsiveness are key factors in designing reverse logistics networks for the fashion e-commerce industry. A model integrating initial collection centers and warehouses has been developed, assigning each customer index to a specific collection center. Sensitivity analyses provide managerial insights for optimizing decision-making (Das, Kumar, & Rajak, 2020). The increasing volume of returned products in India’s e-commerce sector calls for a sustainable reverse logistics model. A weighted goal programming approach balances economic, environmental and social objectives, aiding facility location decisions and the adoption of efficient processing technologies (Dutta, Mishra, Khandelwal, & Katthawala, 2020). Managing online returns presents significant challenges due to rising costs. A conceptual framework has been introduced to streamline return tracking and management, improving overall business performance (Nel & Badenhorst, 2020). The COVID-19 pandemic has intensified product returns, necessitating robust reverse logistics strategies. A decision support system evaluates third-party reverse logistics providers using a hybrid fuzzy multicriteria decision-making approach. This model considers economic, environmental, social and risk factors, emphasizing key criteria such as lead time, customer feedback, cost, service quality and delivery (Wang, Dang, & Nguyen, 2021). A sustainable closed-loop supply chain (CLSC) framework for e-commerce electronics aligns with circular economy principles. Utilizing a mixed-integer nonlinear programming model, it optimizes both forward and reverse logistics, reducing costs while maximizing revenue. Sensitivity analysis with LINGO 19 software offers insights for policymakers (Prajapati, Pratap, Zhang, & Huang, 2022). To enhance e-commerce supply chains and manage high return rates, a reverse logistics network model leveraging hierarchical clustering and mixed-integer linear programming has been introduced. In the consumer electronics sector, this model has achieved a 39.9% average cost reduction (Thibbotuwawa et al., 2023). The courier, express and parcel (CEP) industry has experienced rapid growth during the Covid-19 pandemic, with projected annual expansion rates of 10.8% in Asia-Pacific, 5.2% in South America, 5.1% in Europe and 7–8% in Poland. Key challenges include managing higher order volumes, meeting customer expectations and reducing direct contact. Further research is needed on e-customer expectations, enhanced collaboration between CEP companies and online retailers and automation in reverse logistics. In Internet direct sales, customers cannot physically inspect products before purchasing, leading to dissatisfaction and increased returns. A well-defined and generous return policy can drive demand and boost manufacturer revenue, though it also raises costs. A profit-maximization model has been proposed to determine the optimal balance between pricing and return policies (Mukhopadhyay & Setoputro, 2004).
2.3 Performance metrics in circular economy
Creating products within a circular economy (CE) framework requires assessing sustainability performance (PSP) during design while considering production changes over time. Existing methods often assume stable production, leading to inaccuracies. To address this, a metrics-based framework for forecasting PSP across multiple production periods with closed-loop flows has been developed. A numerical analysis reveals significant PSP variations influenced by demand shifts, reinforcing PSP as a dynamic measure (Hapuwatte, Seevers, & Jawahir, 2022). Measuring product performance under CE principles involves selecting appropriate indicators and assessment methods. A prototype evaluation tool, developed using a points-based questionnaire, provides a straightforward result within set limits. While user-friendly and efficient, it may oversimplify decision-making and rely on contextual assumptions. The tool was tested in the chemical processing industry (Cayzer, Griffiths, & Beghetto, 2017). Similarly, a review of CE assessment methods highlights the complexity of measuring circularity performance. Testing three existing approaches in an industrial case study revealed limitations in their practical application (Saidani, Yannou, Leroy, & Cluzel, 2017). Developing CE indicators is crucial for bridging research, policy and practice. A novel framework incorporating expert and participatory practices identifies seven key indicators focusing on environmental regeneration, resource efficiency and minimizing negative externalities (Nika et al., 2021). Addressing the need for simplified assessment tools, an alternative set of indicators was tested in Spanish companies, proving applicable across industries and economic scales (Rincón-Moreno, Ormazábal, Álvarez, & Jaca, 2021). The shift from a linear to a circular economy aligns with global sustainability goals, requiring effective monitoring. A review highlights gaps in waste metrics and suggests that adopting CE strategies improves efficiency, reduces costs and meets green consumer expectations (Voukkali et al., 2023). However, the absence of a standardized CE measurement framework results in varied methodologies. A structured analysis groups existing metrics into three clusters: resource efficiency, material flows and product-centric approaches (Parchomenko, Nelen, Gillabel, & Rechberger, 2019). While numerous tools exist for planning and evaluating CE strategies, confusion remains over what aspects to measure. A review of CE’s environmental impact across micro, meso and macro levels highlights challenges in integrating indicators and assessing long-term effects (Harris, Martin, & Diener, 2021). To enhance assessment, a new Circular Economy Performance Assessment (CEPA) methodology combines Life Cycle Assessment and Costing with KPIs, addressing both positive and negative impacts in manufacturing transitions (Sassanelli & Terzi, 2023).
2.4 5R’s model & sustainability
The European Union is prioritizing sustainability, and a framework combining TRIZ methodology with the 5Rs of sustainability can aid in designing innovative solutions. Applied to an Italian SME, this approach reduces virgin material consumption, eliminates high-impact materials and establishes a circular economy (CE) business model. Its adoption could increase sustainability awareness and encourage broader implementation (Carrara, Morandi, & Tandoi, 2021). Water scarcity has driven interest in water reuse, reclaimed water and recycled wastewater. The European Union and IWA recognize treated wastewater as a potential solution to this issue, offering economic, social and environmental benefits while attracting private-sector investment (Timofti & Pienaru, 2022). Similarly, managing water consumption in the oil and gas industry aligns with sustainability goals. The Water Closed-Loop System (WCLS), developed under UNESCO’s Water Reuse initiative, integrates wastewater treatment with circular principles, reducing water use by 28.66% and wastewater generation by 46.33% in an oil refinery (Sarrafzadeh, 2022). Young adults in Finland primarily associate CE with recycling, waste sorting and second-hand shopping. However, adopting the 5R framework highlights overlooked roles such as upcycling and maintenance, broadening citizen engagement in CE. The evolution of CE principles from the 3R to the 10R framework has enhanced waste management efficiency. Stochastic Frontier Analysis (SFA) of OECD data (2000–2017) finds a recovery rate efficiency of 0.84, indicating progress but also highlighting the financial challenges municipalities face in implementing recovery processes. Digitalization plays a crucial role in CE, particularly in waste management and sustainability. Digital solutions could enhance resource efficiency, cut waste management budgets by up to 35% and contribute USD 15.7 trillion to the global economy by 2030 while reducing CO2 emissions by 15% (Kurniawan et al., 2023). Additionally, blockchain technology can improve CE performance monitoring by enhancing traceability, transparency and security in supply chains (Kouhizadeh, Zhu, & Sarkis, 2024). Reverse logistics is vital for reducing fast fashion’s environmental impact, explored through interviews with SMEs and global companies (Nguyen, 2023). Similarly, traditional food value chains like geographically indicated (GI) cheeses integrate CE principles but require further innovation to enhance sustainability (Habli, Dumitras, Schmitt, Maglietti Smith, & Barjolle, 2023).
2.5 Hypothesis development
The implementation of a circular economy follows three primary modes: reinvent and rethink, restore, reduce and avoid and recirculate. Environmental orientation and digital supply chain platforms drive these approaches. While reinvent and rethink, along with restore, reduce and avoid, positively impact financial performance, recirculating does not show a significant relationship (Li et al., 2022). Corporate green commitment plays a crucial role in adopting circular economy practices, which in turn enhance sustainability performance. Additionally, corporate green efficacy moderates the relationship between green commitment and circular economy adoption (Ho & Lin, 2024).
Does the implementation of a circular economy have a significant impact on productivity?
Industrialization has increased raw material consumption, raising environmental concerns. Integrating ecological modernization and environmental laws can help mitigate these issues, particularly in developed economies (Waqas et al., 2021). Reverse logistics (RL) positively influences operational performance and organizational culture further strengthens this effect, contributing to knowledge of RL practices in emerging markets (Saruchera and Asante-Darko, 2021). AI-based RL adoption is driven by factors such as trust, top management support, environmental regulations and government backing, which positively correlate with performance (Mukherjee et al., 2024). Compliance with government policies also enhances environmental performance by fostering RL practices, though firm-specific policies influence this relationship (Kalubanga & Mbekeka, 2023).
Do reverse logistics practices significantly impact productivity?
Trust and system quality are key drivers of e-commerce success (Tam, Loureiro, & Oliveira, 2020). Organizational, technological and information ecology factors shape e-commerce adoption in developing economies (Herzallah et al., 2015). While ICT-based workplace connectivity can increase work stress, maintaining social ties can reduce it (Chesley & Johnson, 2015). IT investment correlates strongly with GDP growth but not directly with productivity, highlighting a paradox (Hajli, Sims, & Ibragimov, 2015).
Do technology and information systems significantly impact productivity?
Cost competitiveness is critical for Indonesia’s e-commerce supply chains (Febransyah & Camelia Goni, 2022). Delivery performance is essential for e-commerce success, emphasizing convenience, quality and customization (Bragin, Panasenko, Nikishin, Pankina, & Aleksina, 2020). Sustainable supply chain management (SSCM) has a positive relationship with social sustainability but not economic or environmental factors. However, when productivity is included as a mediator, all relationships become significant (Razzak, 2022). Sustainable procurement and investment recovery improve cost performance, while sustainable distribution negatively affects it (Khanam & Ghosh, 2022).
Does supply chain design significantly impact productivity?
A sustainable framework for multi-echelon electronics supply chains maximizes revenue within a circular economy model (Prajapati et al., 2022). The circular economy contributes to GDP and employment in the digital era, with businesses needing to address environmental, social and governance (ESG) concerns (Fatimah, Kannan, Govindan, & Hasibuan, 2023). Challenges in CE implementation include poor government policies, technological limitations and lack of awareness (Sharma, Mangla, Patil, & Liu, 2019). Business analytics capability significantly enhances sustainable performance and circular economy implementation, acting as a partial mediator between the two (Tetteh, Atiki, Kyeremeh, Degbe, & Apanye, 2024).
Does the implementation of a circular economy have a significant impact on sustainability?
Reverse logistics positively influences environmental, economic and social performance in FMCG industries (Ali, Zalavadia, Barakat, & Eid, 2018). In Slovakia, green and reverse logistics practices are primarily led by large automotive firms, though financial constraints and environmental challenges persist (Richnák & Gubuva, 2021). A mediated model suggests that resource commitments enhance sustainable RL capabilities, reducing environmental impact (Morgan, Tokman, Richey, & Defee, 2018).
Do reverse logistics practices significantly impact sustainability?
Green IT investments improve energy conservation and profitability in India, with operations-focused implementations yielding better results. ICT adoption is driven by management, quality and information culture, significantly impacting sustainability, though ICT expenditure alone does not (Ziemba, 2018). Environmental sustainability in IS implementation faces gaps between design and deployment, necessitating operational research techniques (Haigh & Griffiths, 2008).
Do technology and information systems significantly impact sustainability?
Overproduction and overconsumption contribute to environmental degradation. Sustainable supply chains aim to encourage green consumer behavior and improve economic and socio-environmental outcomes (Taghikhah, Voinov, & Shukla, 2019). Sustainable supply chain management enhances business performance, making it essential for operational and financial success (Fu, Rahman, Jiang, Abbas, & Comite, 2022). Performance assessment in supply chains increasingly incorporates sustainability metrics, covering economic, environmental and social dimensions (Varsei, Soosay, Fahimnia, & Sarkis, 2014).
Does supply chain design significantly impact sustainability?
2.6 Conceptual model
To test the impact of reverse logistics on the circular economy in the e-commerce industry, the proposed conceptual model is directed from the author self.
3. Methodology
This research gathered data from businesses engaged in reverse logistics partnerships and recovery services using a non-probabilistic sampling approach that combined convenience and snowball sampling techniques. The study surveyed 208 respondents from southern India, covering Andhra Pradesh, Karnataka, Kerala and Tamil Nadu, with participant distribution as follows: 109 from Karnataka, 104 from Tamil Nadu, 83 from Andhra Pradesh and 93 from Kerala. The data collection period spanned from December 2023 to March 2024. To analyze multiple dependent and independent relationships simultaneously, the study employed Structural Equation Modeling (SEM) to validate the conceptual model and hypotheses. The SEM analysis was conducted using the maximum likelihood estimation method with AMOS 21. A structured questionnaire was designed to assess reverse logistics practices and their integration with circular economy principles. It covered key aspects such as reverse logistics operations, circular economy adoption, technology and information systems, supply chain design and respondent demographics. All measurement items were adapted from existing validated scales and refined to align with the objectives of this study.
4. Data analysis
This section evaluates the research instrument used in the study, assessing the reliability, validity, total variance explained by the performance metric factor, and overall model fit using SEM analysis. Measures like Cronbach’s Alpha and Composite Reliability are used to assess internal consistency, convergent validity and discriminant validity. The performance metric factor is analyzed through its eigenvalue and percentage of variance explained, with a high eigenvalue and large percentage explaining the underlying concept. Model fit indices like Chi-Square, NFI, CFI and RMSEA are used to evaluate the overall fit. Hypothesis path analysis is conducted based on the hypothesized relationships between constructs. The data is indicated for factorization and loadings using the KMO measure of sampling adequacy and Bartlett’s test of sphericity. The total variance explained by the factors is reported, providing an overview of the variance in the data.
4.1 Empirical results
The test results in Table 1 show that 52.5% of businesses over 10 years have low reverse logistics practices, 36.7% have moderate practices and 10.7% have high practices. 44.7% of businesses aged 5–10 years have moderate practices, 39.7% have low practices and 15.6% have high practices. The reverse logistics practices range from 29 to 92 for businesses over 10 years, 52.68 for those under 5 years and 50.47 for those under 5 years. There was a significant relationship at 5% level of significance, between the Age of the Business and the level of reverse logistics practices (x2 = 8.49, df = 2, p = 0.04). Hence, H01 was not supported.
Age of the business and level of reverse logistics practices in business
| Age of the business | Mean | Range | Reverse logistics practice | Total | ||
|---|---|---|---|---|---|---|
| Low | Moderate | High | ||||
| Less than 5 years | 50.4706 | 21–90 | 24 | 33 | 11 | 68 |
| 35.3% | 48.5% | 16.2% | 17.6% | |||
| 5–10 Years | 52.6809 | 21–93 | 56 | 63 | 22 | 141 |
| 39.7% | 44.7% | 15.6% | 36.5% | |||
| Above 10 years | 57.9774 | 29–92 | 93 | 65 | 19 | 177 |
| 52.5% | 36.7% | 10.7% | 45.9% | |||
| Total | 54.7202 | 21–93 | 173 | 161 | 52 | 386 |
| 44.8% | 41.7% | 13.5% | 100.0% | |||
| Chi-square = 8.492 | P value = 0.045 | |||||
Source(s): Primary Data, 2024
The test results in Table 2 show a significant relationship between business location and reverse logistics practices. The table showed that 44.8% of businesses adopt low, 41.7% moderate and 13.4% high levels of reverse logistics practices. The financial literacy ranges for urban and rural businesses were 26–93 and 21–92, respectively. Therefore, H02 was rejected.
Location of the business and level of reverse logistics practices adopted by the business
| Location of the business | Reverse logistics practice | Total | ||||
|---|---|---|---|---|---|---|
| Mean | Range | Low | Moderate | High | ||
| Urban | 55.6359 | 26–93 | 96 | 90 | 20 | 206 |
| 46.6% | 43.7% | 9.7% | 53.4% | |||
| Rural | 53.6722 | 21–92 | 77 | 71 | 32 | 180 |
| 42.8% | 39.4% | 17.8% | 46.6% | |||
| Total | 54.7202 | 21–93 | 173 | 161 | 52 | 386 |
| 44.8% | 41.7% | 13.5% | 100.0% | |||
| Chi- square = 5.371 | P value = 0.038 | |||||
Source(s): Primary Data, 2024
The test results in Table 3 factor analysis performed to minimize the factors involved, KMO value and Bartlett’s test of sphericity indicate the suitability of data used for analysis, KMO Value has indicated 0.764 and the significant value is 0.00 at 1% Level of significance, which shows the data used for analysis is valid. The factors have been extracted using principal component analysis, and Varimax rotation has been used for the rotation of indicators. The factors were extracted with the eigenvalue of more than a unit, four factors have been extracted from the twenty statements, the first factor is named as Implementation of circular economy which is loaded into the third component, the third component named reverse logistics practice which is loaded in a first component, third factor named as Technology and information systems is loaded into the fourth component, fourth factor supply chain design is loaded into the second component. From Table 1 factor analysis, all indicators with a loading more than 0.40 is considered, while one indicator SCD6 with a factor loading less than 0.40 was removed from the factor.
Indication of factorization and factor loadings
| Indicators | Communalities | Factor loadings – rotated component matrix | |||
|---|---|---|---|---|---|
| ICE1 | 0.675 | 0.743 | |||
| ICE2 | 0.765 | 0.799 | |||
| ICE3 | 0.698 | 0.748 | |||
| ICE4 | 0.595 | 0.679 | |||
| ICE5 | 0.678 | 0.762 | |||
| RLP1 | 0.687 | 0.780 | |||
| RLP2 | 0.652 | 0.760 | |||
| RLP3 | 0.686 | 0.810 | |||
| RLP4 | 0.740 | 0.823 | |||
| RLP5 | 0.772 | 0.838 | |||
| TIS1 | 0.480 | 0.627 | |||
| TIS2 | 0.753 | 0.828 | |||
| TIS3 | 0.513 | 0.629 | |||
| TIS4 | 0.686 | 0.811 | |||
| TIS5 | 0.671 | 0.793 | |||
| SCD1 | 0.730 | 0.792 | |||
| SCD2 | 0.638 | 0.749 | |||
| SCD3 | 0.650 | 0.761 | |||
| SCD4 | 0.585 | 0.702 | |||
| SCD5 | 0.632 | 0.681 | |||
| SCD6 | 0.290 | 0.036 | |||
Source(s): Primary Data, 2024
The test results in Table 4 indicate that the factors reduced to 4, shows that the Implementation of the circular economy shows 36% of the variation, Reverse logistics practice shows 12% of the variation and Technology and information systems show 8% of the variation and supply chain design show 7% of the variation in the factors.
Total variance of the factor analysis
| S. No | Factors | Eigenvalue | % variance explained | Cumulative % |
|---|---|---|---|---|
| 1 | Implementation of circular economy | 3.597 | 36.634 | 36.634 |
| 2 | Reverse logistics practice | 2.676 | 12.741 | 49.374 |
| 3 | Technology and information systems | 1.716 | 8.174 | 57.548 |
| 4 | supply chain design | 1.490 | 7.093 | 64.642 |
Source(s): Primary Data, 2024
The test results in Table 5 factor analysis has resulted in two factors, the first factor is named productivity and the second factor is named sustainability, the factors are extracted in principal component analysis and varimax rotation has been used. From the Factor analysis, all indicators with loading more than 0.40 is considered.
Performance metrics
| Indicators | Communalities | Factor loadings – rotated component matrix | |
|---|---|---|---|
| PRO1 | 0.619 | 0.785 | |
| PRO2 | 0.790 | 0.885 | |
| PRO3 | 0.759 | 0.867 | |
| PRO4 | 0.591 | 0.768 | |
| PRO5 | 0.727 | 0.843 | |
| SUS1 | 0.727 | 0.846 | |
| SUS2 | 0.662 | 0.814 | |
| SUS3 | 0.534 | 0.719 | |
| SUS4 | 0.666 | 0.810 | |
| SUS5 | 0.578 | 0.690 | |
Source(s): Primary Data, 2024
The test results in Table 6 factors reduced to 2, shows that the Productivity standalone brings a variation of 38% and the sustainability factor shows 27% variation in the performance metrics.
Total variance explained by performance metric factor
| S. No | Factors | Eigenvalue | % variance explained | Cumulative % |
|---|---|---|---|---|
| 1 | Productivity | 3.821 | 38.208 | 38.208 |
| 2 | Sustainability | 2.732 | 27.321 | 65.530 |
Source(s): Primary Data, 2024
The test results in Table 7 show that each construct is measured with the variables, and the reliability and normality of the data are measured with the Skewness, kurtosis and Cronbach’s alpha and composite reliability. The data is found to be normally distributed, and the multi-collinearity issue is also not found, and the loadings of the factors are also above 0.70, and hence all the indicators are considered for the SEM analysis, the Cronbach’s alpha value is also more than 0.70 indicating that the data are reliable.
Reliability and validity of constructs
| Constructs | Item | Skewness | Kurtosis | Loading | VIF | CA | CR | AVE |
|---|---|---|---|---|---|---|---|---|
| Implementation of circular economy | ICE1 | 0.614 | −0.46 | 0.775 | 1.406 | 0.896 | 0.789 | 0.745 |
| ICE2 | 0.706 | 0.861 | 0.879 | 1.184 | ||||
| ICE3 | 0.797 | 0.447 | 0.942 | 1.732 | ||||
| ICE4 | 0.558 | 0.229 | 0.867 | 1.773 | ||||
| ICE5 | 0.579 | 0.558 | 0.751 | 1.517 | ||||
| Reverse logistics practices | RLP1 | 0.771 | 0.854 | 0.755 | 1.218 | 0.769 | 0.856 | 0.732 |
| RLP2 | 0.864 | 0.625 | 0.931 | 1.296 | ||||
| RLP3 | 0.669 | −0.551 | 0.809 | 1.932 | ||||
| RLP4 | 0.572 | 0.336 | 0.973 | 2.014 | ||||
| RLP5 | 0.645 | 0.572 | 0.772 | 1.628 | ||||
| Technology and information systems | TIS1 | 0.736 | −0.803 | 0.881 | 1.403 | 0.865 | 0.734 | 0.821 |
| TIS2 | 0.805 | 0.663 | 0.829 | 1.519 | ||||
| TIS3 | 0.593 | 0.864 | 0.705 | 1.936 | ||||
| TIS4 | 0.841 | 0.833 | 0.883 | 1.441 | ||||
| TIS5 | 0.634 | 0.569 | 0.942 | 1.854 | ||||
| Supply chain design | SCD1 | 0.845 | 0.861 | 0.848 | 1.533 | 0.763 | 0.729 | 0.867 |
| SCD2 | 0.714 | 0.792 | 0.778 | 1.934 | ||||
| SCD3 | 0.691 | 0.447 | 0.879 | 2.103 | ||||
| SCD4 | 0.522 | 0.258 | 0.781 | 2.139 | ||||
| SCD5 | 0.669 | 0.522 | 0.831 | 1.628 | ||||
| Productivity | PRO1 | 0.853 | 0.319 | 0.75 | 1.609 | 0.854 | 0.865 | 0.698 |
| PRO2 | 0.603 | 0.099 | 0.713 | 1.843 | ||||
| PRO3 | 0.794 | 0.663 | 0.886 | 1.895 | ||||
| PRO4 | 0.807 | 0.469 | 0.849 | 1.362 | ||||
| PRO5 | 0.854 | 0.643 | 0.775 | 1.817 | ||||
| Sustainability | SUS1 | 0.703 | 0.538 | 0.664 | 1.628 | 0.765 | 0.734 | 0.687 |
| SUS2 | 0.772 | 0.614 | 0.728 | 1.845 | ||||
| SUS3 | 0.836 | 0.539 | 0.883 | 1.406 | ||||
| SUS4 | 0.755 | 0.534 | 0.771 | 1.239 | ||||
| SUS5 | 0.614 | −0.46 | 0.775 | 1.406 |
Source(s): Primary Data, 2024
The test results in Table 8 HTMT ratio measure the discriminant validity, as the values are less than the threshold limit of 0.85, the discriminant validity of the constructs has been established.
HTMT ratio
| Sustainability | Productivity | SCD | TIS | RLP | ICE | |
|---|---|---|---|---|---|---|
| Sustainability | ||||||
| Productivity | 0.764 | |||||
| SCD | 0.567 | 0.567 | ||||
| TIS | 0.732 | 0.648 | 0.756 | |||
| RLP | 0.645 | 0.572 | 0.567 | 0.691 | ||
| ICE | 0.756 | 0.738 | 0.689 | 0.592 | 0.716 |
Source(s): Primary Data, 2024
The test results in Table 9 model’s fit indices show a statistically significant result, with a P value below the recommended threshold of 0.05. The Chi-square value to degrees of freedom ratio is 2.634, indicating an acceptable fit. The CFI value is above the recommended threshold of 0.90 and the IFI value falls within the range of 0 to 1.0. The TLI value is above the recommended threshold of 0.90 and the RMSEA value is below the recommended threshold.
Model fit indices
| Recommended value | Source | Model value | |
|---|---|---|---|
| P value | >0.05 | Bagozzi and Yi (1988) | 0.000 |
| CMIN/DF | <5 | Schumacker and Lomax (2004) | 2.634 |
| CFI | Above 0.90 | Hair et al. (2009) | 0.913 |
| IFI | 0–1.0 | Bentler (1990) | 0.924 |
| TLI | Above 0.90 | Bentler (1990) | 0.956 |
| RMSEA | <0.08 | Hu and Bentler (1998) | 0.781 |
| SRMR | <0.05 | Hu and Bentler (1998) | 0.068 |
Source(s): Primary Data, 2024
The test results in Table 10 examine the impact of circular economy, reverse logistics practice, technology information systems and supply chain design on productivity and sustainability. The results show positive and significant impacts on productivity, with 73.5% of the variance explained by these factors. The impact on sustainability is also positive, with 56.7% of the variance explained by these factors. The study supports and accepts hypothesis H1, H2, H3, H4, H5, H6, H7 and H8, indicating that these factors significantly contribute to the overall productivity and sustainability of the economy.
Hypothesis pathway analysis
| Hypothesis | P Value | ||
|---|---|---|---|
| H1 | Implementation of circular economy → productivity | *** | Significant |
| H2 | Reverse logistics practice → productivity | *** | Significant |
| H3 | Technology information systems → productivity | *** | Significant |
| H4 | Supply chain design → productivity | *** | Significant |
| H5 | Implementation of circular economy → sustainability | *** | Significant |
| H6 | Reverse Logistics Practice → sustainability | *** | Significant |
| H7 | Technology information systems → sustainability | *** | Significant |
| H8 | Supply chain design → sustainability | *** | Significant |
Note(s): ***- Significant at 1% Level of Significance
Source(s): Primary Data, 2024
Figure 1 depicts that Reverse logistics practices involve planning and controlling the efficient return of consumable products, by-products, waste materials and used products for safe and environmentally friendly disposal. Information technology (IT) is crucial in enabling a circular economy, tracking products throughout their life cycle, optimizing resource use and designing products for easy disassembly and remanufacture. Supply chain design helps businesses maintain product and material use, enhancing productivity and sustainability.
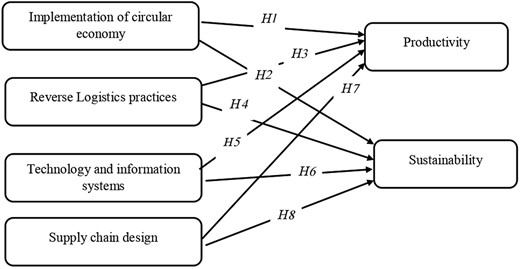
Conceptual model. Source: Authors’ own construct from the literature review, 2024
Conceptual model. Source: Authors’ own construct from the literature review, 2024
Figure 2 is a Structural Equation Model (SEM) used in supply chain management research to illustrate the complex relationships between factors like circular economy principles, reverse logistics practices, technology and supply chain design, highlighting the inherent uncertainty in real-world scenarios.
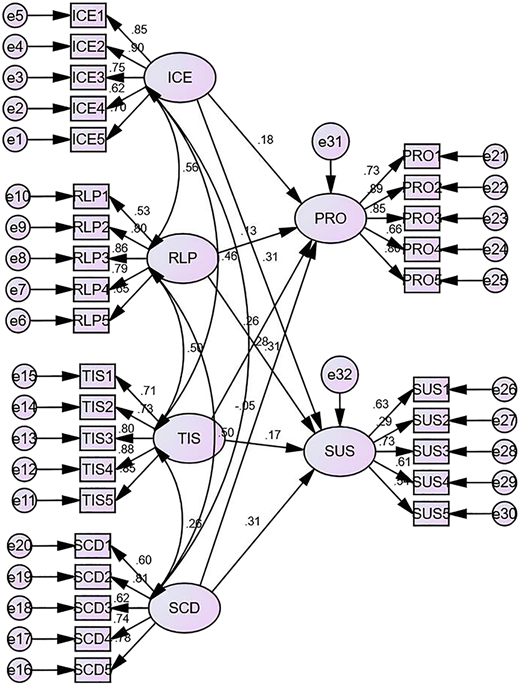
SEM diagram of the constructive variables. Source: Authors’ own construct based on data validation, 2024
SEM diagram of the constructive variables. Source: Authors’ own construct based on data validation, 2024
4.2 Discussions
The study analyzed the impact of circular economy principles, reverse logistics practices, technology information systems and supply chain design on productivity and sustainability. Factor analysis revealed that these factors accounted for 36% of the variation in performance metrics, while “productivity standalone” contributed 38% and “sustainability” accounted for 27%. The data was found to be normally distributed and had a Cronbach’s alpha value above 0.70. The model’s fit indices were statistically significant, with a P value below 0.05. The results showed positive and significant impacts on productivity, explaining 73.5% of the variance and sustainability, explaining 56.7% of the variance. To enhance sustainability, e-commerce businesses should adopt comprehensive strategies aligned with circular economy principles, including consumer education, optimizing reverse logistics systems, investing in technology and collaborating across the supply chain.
E-commerce businesses should adopt comprehensive sustainability strategies, integrating the five R’s model to align with circular economy principles. This involves promoting consumer education and participation, optimizing reverse logistics systems, investing in advanced technologies, collaborating across the supply chain and continuously monitoring and evaluating sustainability initiatives. Expanding research on circular economy practices, benchmarking against industry best practices and establishing partnerships with external organizations can further enhance sustainable initiatives. Addressing challenges in consumer behavior through marketing campaigns, loyalty programs and incentives can influence positive attitudes and actions. Educating internal stakeholders, including employees and management and regularly updating sustainability policies based on industry standards and consumer expectations can foster a shared commitment to environmentally responsible practices. By implementing these recommendations, e-commerce businesses can enhance their environmental impact and contribute to the broader goals of a circular economy.
4.3 Theoretical implications
The true saying of this study aims to enhance the five R’s model for e-commerce reverse logistics, contribute to the understanding of circular economy principles in e-commerce, and provide insights into sustainable competitive advantage. It will also explore how integrating circular practices into reverse logistics can lead to cost reduction, brand differentiation and improved customer loyalty. The study will also contribute to business model innovation in e-commerce, focusing on sustainability-driven technologies and practices. It will also offer insights into supply chain optimization and resource management, contributing to sustainable supply chain management theories. The proposed strategic sustainability framework will help e-commerce businesses stay ahead of sustainability trends and build resilience.
4.4 Practical implications
This study emphasizes the importance of reverse logistics and circular economy practices in enhancing sustainability and operational efficiency in the e-commerce and supply chain sectors. It suggests that businesses should integrate the five R’s model into reverse logistics, which can lead to cost savings, better inventory control and additional revenue streams. Technology-driven solutions like AI and blockchain can streamline reverse logistics processes, enhance tracking and improve transparency. Investing in digital technologies like AI-driven automation, IoT and blockchain can optimize returns and minimize environmental impact. Compliance with evolving regulations and standards is crucial for businesses to meet environmental standards. Consumer awareness and sustainable branding can enhance brand reputation and customer loyalty. Policymakers can use this information to develop initiatives promoting circular economy adoption. Future-proofing business operations is essential for companies to remain competitive.
5. Conclusion
A study highlights the importance of reverse logistics and circular economy integration in e-commerce and supply chain management. It found that many businesses, especially those over ten years old, lack these practices. The study also found a significant relationship between business age, location and reverse logistics adoption, highlighting the need for targeted strategies. Factor analysis identified four key components: circular economy implementation, reverse logistics practices, technology and information systems and supply chain design. Information technology plays a crucial role in enabling circular economy practices, optimizing resource utilization, enhancing traceability and facilitating sustainable supply chain design. The study suggests that businesses adopting sustainable supply chain practices can gain a competitive advantage through cost savings and stronger consumer loyalty.
5.1 Limitations and scope for future research
The study on reverse logistics and sustainability in e-commerce is limited by its specific context, cross-sectional nature, self-reported data and potential response preferences. Future research should consider a comprehensive range of variables, adopt a longitudinal approach, analyze consumer behavior, optimize reverse logistics processes and expand circular economy practices.
Funding: The researchers did not avail of any funding for this research completion from any external funding agencies.
Conflict of interest: There are no conflicts of interest present among the researchers involved in this study.
Patient consent: this study did not involve any human or animal participants.

