
The development of e-grocery allows people to purchase food online and benefit from home delivery service. Nevertheless, a high rate of failed deliveries due to the customer’s absence causes significant loss of logistics efficiency, especially for perishable food. The purpose of this paper is to propose an innovative approach to use customer-related data to optimize e-grocery home delivery. The approach estimates the absence probability of a customer by mining electricity consumption data, in order to improve the success rate of delivery and optimize transportation.
The methodological approach consists of two stages: a data mining stage that estimates absence probabilities, and an optimization stage to optimize transportation.
Computational experiments reveal that the proposed approach could reduce the total travel distance by 3-20 percent, and theoretically increase the success rate of first-round delivery approximately by18-26 percent.
The proposed approach combines two attractive research streams on data mining and transportation planning to provide a solution for e-commerce logistics.
This study gives an insight to e-grocery retailers and carriers on how to use customer-related data to improve home delivery effectiveness and efficiency.
The proposed approach can be used to reduce environmental footprint generated by freight distribution in a city, and to improve customers’ experience on online shopping.
Being an experimental study, this work demonstrates the effectiveness of data-driven innovative solutions to e-grocery home delivery problem. The paper also provides a methodological approach to this line of research.
1. Introduction
Recent developments of e-commerce have had a significant impact on food supply chains. Today, many traditional grocery retailers offer their customers the opportunity to purchase food items online and have them delivered to their home utilizing their existing distribution network (Ogawara et al., 2003; Agatz et al., 2008). At the same time, new companies enter the retail groceries market by providing online supermarkets with no physical stores, fulfilling home deliveries from their warehouses (e.g. the case of Ocado, Saskia et al., 2016). In addition to that, internet-based retailers, like Amazon, exploit their e-commerce expertise to build their own online grocery shops thus extending even more the options end-customers have for purchasing groceries online (Kang et al., 2016).
In e-grocery commerce, home delivery – the process of delivering goods from a retailer’s storage point (e.g. distribution centers, shops) to a customer’s home – plays a crucial role (Punakivi and Saranen, 2001). In fact, due to its convenience to customers, home delivery has become a dominant distribution channel of business-to-consumer e-commerce (Campbell and Savelsbergh, 2006). Nevertheless, a certain challenge faced in e-grocery is that the perishability and storage condition-sensitivity of food and drink items requires the attendance of the customer at the moment of delivery (Hsu et al., 2007). At the same time, this makes alternative methods for unattended delivery, such as delivery boxes, reception boxes and shared reception boxes, hard and unsafe to use. This has led e-tailers to introduce strict policies for deliveries that could not be completed due to the customer’s non-attendance (Ehmke, 2012a), while aiming to increase the probability of an attended delivery by allowing their customers to choose their preferred time slot. However, it is still common for end-customers to be absent at the time of delivery either due to their own fault (e.g. failing to remember) or due to a delayed delivery (e.g. due to traffic).
In this paper, we aim to address the attended home delivery problem (AHDP) (Ehmke, 2012a; Ehmke and Campbell, 2014) in e-grocery motivated by the fact the attendance of the customer is often hard to predict. We do this by investigating a new approach that utilizes customer-related data to improve attended home delivery efficiency. The approach consists of two stages. The first stage concerns a data mining process, whose objective is to estimate the purchaser’s absence probability at a given time window according to his/her electricity consumption behavior. The second stage uses the calculated absence probabilities as an input to an optimization model for managing the fleet of trucks that execute the home deliveries.
This paper aims to make both a theoretical and a practical contribution to the AHDP. With regards to the theoretical contribution, this study is among the first ones applying data mining techniques to AHDP. It provides a novel methodology to investigate the AHDP from the aspect of customer-related data, which can be thought of as a new research line on AHDP. From a practical point of view, the two-stage approach proposed could serve as a decision-making model for e-grocery retailers, or other retail businesses that provide (attended) home delivery service, to organize or enhance their delivery service.
Following this introduction, Section 2 provides a review of related work. Then, Section 3 presents the two-stage approach, that is, respectively, data mining stage and the transportation planning stage. Section 4 presents an application example to demonstrate the practicability and performance of the proposed approach. Finally Section 5 concludes this work.
2. A brief review of e-grocery and its logistics
In this section, we briefly discuss the literature from three related problems: current challenges to grocery and food e-commerce, delivering grocery and food items in e-commerce, and innovations in home delivery.
2.1 Online grocery retailing
Online grocery retailing, also known as e-grocery, is a type of business-to-consumer e-commerce that has enjoyed great growth in the last decade and is expected to continue growing in the years to come (Mortimer et al., 2016). Similarly, to other internet retailing examples, online grocery shopping offers significant benefits to end-customers including time savings, access to multiple retailers and products, and home delivery. Nevertheless, there are a number of factors that can affect the decision of end-customers to use online channels for their grocery shopping. These important factors include:
Ordering interface and product information (Tanskanen et al., 2002; Boyer and Hult, 2005, 2006): a well-designed and easy to use online shop is critical to the overall customer experience of online shopping. In grocery shopping in particular, where customers are used to visually checking the products they buy (for nutrition details, expiry dates, ingredients etc.), it is important that label information and accurate product photos are available to the end-customer via a website or app. Moreover, customers often expect that managing their basket and checking out online should be a straighforward process, similar to placing products in a shopping cart and visiting a cashier in a physical store.
Product range availability (Colla and Lapoule, 2012; Anckar et al., 2002; Zott et al., 2000): customers expect the products they can normally purchase in a physical store to be available online. A certain limitation here has to do with the purchase of non-packaged food (or even fresh packaged food) products, especially in cases when the customer is used to buying a product after visually checking its condition.
Suitable logistical delivery options (Wang, Mao, O’kane and Wang, 2016; Anu et al., 2012; Koster, 2003): having chosen the products they want to purchase, customers need to also make a decision about the delivery of the physical goods. Besides choosing the preferable option, this factor also includes the retailer’s response to delivery problems, cost of different options, and subscription models for delivery services.
Consistency between all sales and media channels (Ishfaq et al., 2016; Hübner et al., 2016; Breugelmans and Campo, 2016): this is a relatively recent trend due to the emergence of omni-channel retail. With retailers offering more and more options for customers to purchase goods, they need to make sure that different channels offer the same information and functionality.
In this paper, we focus on the third factor described above – the delivery options offered to the customer – due to its continuous importance for e-commerce success (Ricker and Kalakota, 1999; Lee and Whang, 2001; Zhang et al., 2011; Ramanathan, 2010). We discuss this challenge in more detail in the next section.
2.2 Delivery challenges in grocery and food e-commerce
Unlike traditional in-store sales where customers are able to receive physical products directly after their purchase, e-grocery requires a set of logistics operations that are crucial not only for the right delivery of a product but also for the overall satisfaction of the end-customer (Hübner et al., 2016). It has been noted that the retailers that provide a grocery home delivery service are the ones that face the greatest logistical challenges (Fernie et al., 2010). These logistical challenges refer to both the back-end fulfillment and the last mile distribution (LMD) of an order (Hübner et al., 2016). Back-end fulfillment mainly deals with the picking and preparation of an order. LMD (which is the focus of this study) involves decisions related to the delivery method, time, and area as well as the returns of unwanted products.
Two methods are commonly available for e-grocery delivery: home delivery and click and collect. As regards the first method, due to the perishability and storage condition-sensitivity of food, attendance of customer (or receiver in general) is often required at the moment of home delivery (Hsu et al., 2007). This problem is known in the literature as the AHDP (Ehmke, 2012a; Ehmke and Campbell, 2014). As the attendance of a customer is hard to predict, home delivery usually results in high rate of failures (Agatz et al., 2011; Gevaers et al., 2011; Lowe and Rigby, 2014) and can lead to high delivery costs, waste of waiting time (for the customer), and waste of energy spent in transportation. Effectively and efficiently tackling AHDP is becoming a key success factor to food delivery, as well as an important challenge with regards to sustainability of freight transportation (Ehmke and Mattfeld, 2012; De Marco et al., 2014; Gevaers et al., 2011).
At the stage of transportation, the AHDP has mainly been addressed as a vehicle routing problem (VRP), or VRP with time windows (VRPTW) if a delivery time window is imposed (Ehmke and Mattfeld, 2012; Hsu et al., 2007). The latter is also studied as time slot management problem (Agatz et al., 2011). Reliability and width of the time windows – slots – strongly impact on the results of routing optimization as well as on customer’s experience. At the stage of reception, some practical solutions can be employed when a customer is absent at delivery (i.e. unattended delivery), such as leaving the package to someone nearby (neighbors, gatekeeper etc.) or at a secure place (mailbox, yard, garage etc.) or calling the purchaser to confirm attendance (Punakivi and Saranen, 2001; Ehmke, 2012a). These solutions are helpful to the problem, but their disadvantages are significant: time wasted for phone calls or for waiting for delivery, product security issues, lockers storage condition issue, reception boxes size issue (Iwan et al., 2016; Lowe and Rigby, 2014; Ehmke and Campbell, 2014). These disadvantages are particularly noticeable in food delivery.
In order to tackle the above challenges and improve home delivery, e-tailers and logistics providers have been driven to invest in delivery innovation and technology (Lowe and Rigby, 2014). In the competitive delivery market, this is expected to create solutions that can better meet customer needs. We discuss relevant innovations in the next section.
2.3 Innovation in home delivery
Innovation in home delivery has received considerable attention in both real-world practice and research in recent years. Generally, innovations can be classified in three lines of research that are constantly and interactively developing: organizational, technology-enabled, and data technique-enabled innovations. Organizational innovations refer to the implementation of innovative organization models or methods for LMD. Examples include urban consolidation centers (Allen et al., 2014; Van Duin et al., 2010), synchronization and horizontal collaboration (De Souza et al., 2014), and crowdsourcing (Paloheimo et al., 2016; Chen et al., 2017). Technology-enabled innovations are the result of the application of emerging technologies in LMD. Automated lockers and drones are the most noticeable examples in this line as both industrial practice (DHL, 2016; Amazon, 2016) and academic work indicate (Gevaers et al., 2011; Iwan et al., 2016).
Data technique-enabled innovations refer to applications of data techniques (data mining, data analytics, big data, etc.) in LMD aiming at improving effectiveness and efficiency. Academic research has concentrated heavily on the exploitation of historical traffic data sets to optimize time-dependent routes in LMD. For example, Ehmke and Mattfeld (2012) and Ehmke et al. (2012) propose mining taxi-Floating Car Data (FCD) to determine time-dependent travel times in a city and use that information to optimize routing. Chen et al. (2017) mines taxi-FCD to plan taxi-based crowdsourcing LMD in big cities. These examples have indicated a great potential for data techniques to improve LMD, especially in the context of city logistics. Nevertheless, data other than historical traffic data are rarely studied, even though they could provide significant benefits to LMD. We notice here that customer-related data have been previously used in the context of e-commerce but mainly for the purpose of marketing. Examples include mining customer data to understand consumption performance and design online shopping services (Liao et al., 2011), or for the purpose of customer relationship management (Mithas et al., 2005; Karakostas et al., 2005).
Inspired by the potential data-enabled techniques have shown for LMD in particular but also for logistics and supply chain management in general (Wang, Gunasekaran, Ngai and Papadopoulos, 2016), this study is focused on this type of home delivery innovation. More specifically, the fact that the attended home delivery could benefit from predictions regarding a customer’s absence makes data-enabled techniques – which are capable of providing such predictions – a promising tool for tackling this problem.
3. A data-driven approach for e-grocery home delivery
The discussion in the previous section has highlighted the importance of the AHDP problem in e-grocery delivery as well as the potential of data usage in last-mile logistics. Motivated by this, this work introduces an innovative approach that utilizes customer-related data to improve the home-delivery service of grocery items. In summary, we attempt to exploit customer-related data in order to provide a method to determine the optimal time slot profiles for carriers or shippers, in order to optimize the success rate of home delivery.
The approach proposed in this paper consists of two stages (see Figure 1). The first stage aims to estimate the probability the purchaser of an online grocery order will be at the chosen delivery location at different points of time during the day. At this stage, customer-related data are collected and used as an input to a data mining model, capable of calculation the customer attendance (or absence) probabilities. A time series of customer telemetry data is taken as the input to the framework. The time series is arranged as a temporally ordered telemetry measurement collected from each customer, noted as (x1, x2, x3, …, xn), as xi to be the measurement obtained at the ith time slot during the whole observation time window. The physical sense of xi depends on the intrinsic of different telemetry sources. For example, if we use in-house electrical power loads data of each customer, xi then denotes the instant power load level of one particular customer measured at the ith time slot. Other examples include water consumption data and historical data from previous deliveries. With more and more data being collected nowadays from households and individuals (due to emerging trends like the Internet of Things, Big Data and Open Data), we expect the availability of customer-related data that can be used in this approach to increase considerably in the years to come. Such an open data set on electricity consumption is provided by the Irish Commission for Energy Regulation (CER) and is used as an example in the remaining of this study.
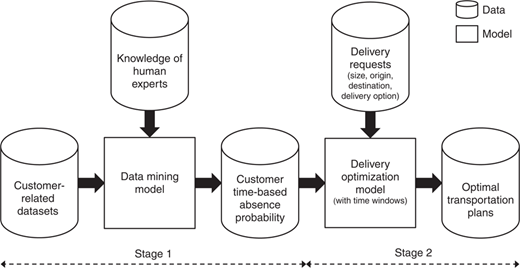
Once the customer-related data are collected, they are used in a data mining model to estimate home attendance. As an extra input, expert knowledge might also be required at this stage, especially with regards to energy consumption, in order to link consumption data with occupancy detection (home attendance or absence). In this paper, we estimate home absence at given time windows according to one’s electricity consumption behavior. Building statistical correlations between energy consumption traces and social-economical factors of customers has received a lot of attention lately. The major purpose of the research topic is to find out the underlying patterns of customers’ daily living habits based on their energy usage behaviors, in order to provide a strong base to not only the energy supplying service, but also to other value added services, such as online shopping recommendation and targeted advertisement.
Generally, the previous research efforts in this domain may be divided into two categories: end-user models and econometric methods. End-user models are commonly used as an alternative to black-box methods (Wood and Newborough, 2003; Abreu and Pereira, 2012; Aman et al., 2011; Kolter and Joseph Ferreira, 2011; Beckel et al., 2012). They require information about housing conditions, electrical appliance usage, and environmental factors. Such background information is used with energy domain knowledge to disaggregate the daily electricity consumption measurements of a specific user into elementary components, including heating/cooling, water usage, cooking, and other behaviors. The disaggregation result is then applied to find out their usage preferences. The shortcoming of end-user models is that forecasting performance depends heavily on the quality of available information, which makes them sensitive to noise and unable to perform automatically. Econometric methods (Beckel et al., 2012; Abreu and Pereira, 2012; Kolter and Joseph Ferreira, 2011) estimate the relationship between energy consumption profiles and the factors influencing consumption behavior using statistical machine learning approaches, such as support vector regressors, decision trees, and so on. Econometric models are built by learning the mapping from pairs of the factors and energy consumption profiles automatically, which is appealing for realistic application deployments. Recently, this category has gained popularity. Most research efforts along this direction focus on estimating the users’ general social-economical factors, such as professions, family status, salary levels, and so on.
The outcome of the first stage, which is in the form of a set of time windows with attendance probabilities for each customer, serves as an input to the second stage. In this stage, the approach aims to provide transportation plans for carriers who need to schedule their home-delivery operations. Here, information about delivery requests, such as origin and destination, delivery option, and order size is combined with the estimated attendance probabilities to decide when and how a delivery should be made. As already discussed in Section 2.2, scheduling of attended home deliveries is often done by first modeling the problem as a VRP (usually with time windows and limited capacity). In short, in the context of last-mile delivery, the VRP involves the planning of a set of routes for a capacitated vehicle that starts from and ends with a (retailer’s) warehouse, aiming at delivering the demanded goods to a set of customers (Ehmke, 2012b; Cattaruzza et al., 2017).
Once the VRP problem is modeled, an optimization technique can be employed to solve it. In this paper, we propose a model that takes into account the customer absence probabilities and aims to establish transportation plans that maximize delivery success rates while minimizing total transportation distances. Other models can also be considered in the second stage of the approach, depending on the key performance indicators defined by each retailer or logistics provider as well as the limitations imposed by each business scenario.
Having introduced our approach, in the next section we will demonstrate its application using an example. We will also evaluate the effectiveness of the approach (and thus the effectiveness of data-driven techniques for e-grocery home delivery) by comparing it with a base scenario where absence probabilities are unknown.
4. Application example
This section aims to illustrate how the proposed methodological approach can be applied in a real-world case. It also demonstrates potential benefits of the approach over conventional solutions. The illustration of the application follows the two-stage approach, in which Stage 1 relates to the customer-related data collection and mining; and Stage 2 to the transportation planning optimization.
4.1 Stage 1
4.1.1 Customer-related data collection
Due to the scarcity of available customer-related data, this work uses a publicly available electricity consumption trace data set, named CER ISSDA, to simulate and demonstrate the use of estimating occupancy patterns of private households for estimating absence probabilities. The CER ISSDA data set is collected by the CER in a smart meter study[1]: it contains electricity consumption data of 4,225 private households and 485 small and medium enterprises (all called customer hereafter); the trace covers 1.5 years (from July 2009 to December 2010). For each customer, the daily load curve is sampled every 30 minutes: energy data can be thought of as a series of timestamps and energy readings. In addition to energy data, the data set includes a series of survey sheets and answers for each customer, describing their housing condition, occupancy, employment status, income level, social class, appliance usage information, and other socio-economic factors. In all, 41 survey questions belonging to five categories were selected that enable the customer profiles to be built based on heating and lighting behavior, hot water and other electrical appliances usage. As a sample for this work, we select 20 private households randomly from the data set to simulate the shipping network in a practical application. To avoid the effects of seasonal variation on the consumption profiles, e.g. air conditioning use in Summer and heating use in Winter changing daily consumption patterns, we only focus on the time period from April 1 to June 30 in 2009 to collect electricity consumption data, which in total involves 91 days.
4.1.2 Data mining model
The detection of occupancy within a residential household is primarily based on activity detection. Activity within a household is often linked to electric consumption (Kleiminger et al., 2013). Therefore, the variance and magnitude of a residential consumption profile can give indications about whether a household is occupied or not. Peaks and high variation in a consumption profile (indicating typical active behaviors) were labeled in our model and then compared to low variation and low overall consumption periods. The combination of low overall consumption and low consumption profile variation indicates a period of inoccupation (absence). Automated devices within a household can interfere with occupancy detection. High overall consumption due to heating devices left on can also interfere with occupancy detection. Thus, it is necessary to identify patterns for each specific client. For each client, a typical profile variation for occupied and unoccupied periods was established in our model. A threshold of average consumption was also determined. When overall consumption was below the threshold and variation of the profile was relatively low, the period was determined to be unoccupied.
Based on the above qualitative analysis, we propose a computational model to estimate occupied periods for a given user, as described below. Hereafter, we use xi,j to denote electricity consumption level at the jth time step of ith day for one specific user. Given the context of shipping programming, we especially focus on estimating occupancy period within the time interval ranging from 8:00 a.m to 8:00 p.m. Our estimation approach is defined into four successive steps as follows:
Indicator estimation: calculating the consumption magnitudes xi,j and the absolute values of the first-order difference and , as defined in the following equation. The three measurements form an indicator cell (xi,j, , ), which is used as the feature to detect occupancy patterns. Given all 91 days in the database, we have in total 91 (days) × 12 (delivery hours per day) × 2 (timestamps per hour) indicator cells for each user:
(1)Label the Lp indicator cells for each user with the most typical active behaviors manually by human experts on energy consumption. Treating occupancy detection as an anomaly detection problem, the labeled Lp indicator cells form a reference set to identify whether the customer’s activities are present within a given time period. Based on the labeled indicator cells, we build a linear kernel one-class SVM-based detector F (Schölkopf et al., 2001). The output Yi,j of the SVM detector is 1 or 0, deciding whether the human activity is present at the given time step or not (1 corresponds to the presence of the customer and vice versa):
(2)Apply the built SVM-based detector on the 24 time steps between 8:00 a.m. to 8:00 p.m. for each day besides the labeled Lp time steps. The binary output of the detector is used as an estimated occupancy label of the concerned time steps. As such, for the ith day, we can obtain a 24-dimensional binary valued vector as the estimated occupancy label vector of the concerned day.
Accumulate estimated occupancy label vectors derived from the total 91 days. For each day of the week (from Monday to Sunday), we calculate the empirical expectation of the occupancy label for each time step as the occupancy probability of the time step j for each day of the week. As a result, we generate a probability map M∈R24×7. Each entryMk,j represents the estimated occupancy probability of the time step (j+16) on the given day of the week. Monday to Sunday is denoted as 0-6.
According to the algorithmic description, the occupancy detection procedure is defined as a one-class anomaly detection problem in our work. Compared with varied inactive consumption behaviors, typical active behavior patterns indicating residences’ occupancy is easier to identify manually for human experts. Therefore, the expected occupancy detector is built to describe the common characteristics of the active consumption profiles and expected to differentiate the active profiles from inactive ones at the same time. This is a typical one-class learning problem in machine learning theory (Schölkopf et al., 2001) and one-class SVM perfectly matches with this goal. In previous research, it is popularly used to detect a concerned events from backgrounds given only limited number of samples belonging to the event are available. The indicator cell designed in this work covers both the instant measurement of the electricity consumption level and the dynamical information about the consumption variation, represented by the two first-order differences. The feature design is based on the theoretical analysis of active consumption profiles. High instant consumption level and high variance of consumption measurement are strong indicators of active behaviors, thus the chosen three features are able to sensitively indicate the potential human activities existing behind the consumption measurements. Finally, the binary output of the occupancy detector can be noisy due to the hard threshold intrinsic. Furthermore, to insert occupancy estimate as a constraint into the shipping programming problem, we need to smooth the binary decision into a soft, continuously valued confidence of residences’ occupancy for each specific time step. As a result, empirical expectation is used as the estimate of the underlying true occupancy probability.
4.1.3 Customer absence probability
Finally, the results of time slots with absence probability by customer are obtained, as shown in Figure 2. Among the 20 customers randomly selected, five are excluded in this study because the variation of their consumption curve is not significant, thus making these cases irrelevant to this study, e.g. absence probability always >90 percent. Moreover, the daily working hours from 8-17 h (common delivery hours in many countries) are chosen. The customer attendance probability is then the inverse of the absence probability (knowing that both staying out or inactive at home are considered as absence here). The results show that most customers have similar absence probability curve during most days of the week except Saturday. The figure shows only the average of weekdays’ probability to compare with Saturday (Sunday is not considered for delivery).
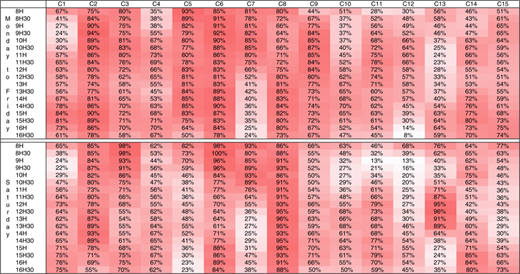
Heat map of time slots with absence probability during working hour (Weekdays vs Saturday)
Heat map of time slots with absence probability during working hour (Weekdays vs Saturday)
From the figure, one can easily observe that during a day some time windows are relatively more favorable for home delivery and such time windows are different for each customer. Accordingly, a suitable best delivery time window profile for every customer can be defined.
4.2 Stage 2
4.2.1 Delivery requests
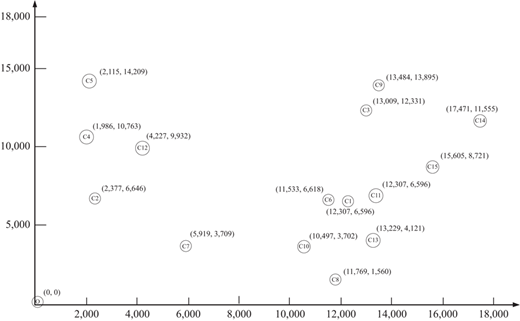
This part aims to set up delivery request for the 15 customers identified in Stage 1. A request is defined by four attributes: size, origin, and destination, and delivery option. In order to describe origin and destinations, we use a two-dimension (x,y) plan to simulate a city of 18×18 km2, in which the 15 customers are randomly located (see Figure 3 and Table I). In particular (0,0) represents e-tailer’s storage point for the city.
Input data
| Coordinate | Optimal time windows in weekdays | Optimal time windows in weekdays or Saturday | |||||||
|---|---|---|---|---|---|---|---|---|---|
| Customer | Order size | x | y | ai | bi | Absence probability (%) | ai | bi | Absence probability (%) |
| C1 | 1 | 12,307 | 6,596 | 60 | 120 | 26 | 60 | 120 | 23 |
| C2 | 1 | 2,377 | 6,646 | 300 | 360 | 75 | 480 | 540 | 62 |
| C3 | 1 | 13,009 | 12,331 | 300 | 360 | 59 | 300 | 360 | 54 |
| C4 | 1 | 1,986 | 10,763 | 0 | 60 | 36 | 0 | 60 | 36 |
| C5 | 1 | 2,115 | 14,209 | 480 | 540 | 52 | 480 | 540 | 23 |
| C6 | 1 | 11,533 | 6,618 | 480 | 540 | 81 | 300 | 360 | 62 |
| C7 | 1 | 5,919 | 3,709 | 480 | 540 | 24 | 480 | 540 | 24 |
| C8 | 1 | 11,769 | 1,560 | 60 | 120 | 65 | 60 | 120 | 65 |
| C9 | 1 | 13,484 | 13,895 | 0 | 60 | 55 | 120 | 180 | 50 |
| C10 | 1 | 10,497 | 3,702 | 60 | 120 | 37 | 120 | 180 | 28 |
| C11 | 1 | 13,321 | 6,989 | 0 | 60 | 40 | 60 | 120 | 17 |
| C12 | 1 | 4,227 | 9,932 | 480 | 540 | 11 | 480 | 540 | 11 |
| C13 | 1 | 13,229 | 4,121 | 180 | 240 | 23 | 180 | 240 | 23 |
| C14 | 1 | 17,471 | 11,555 | 0 | 60 | 45 | 240 | 300 | 41 |
| C15 | 1 | 15,605 | 8,721 | 240 | 300 | 52 | 300 | 360 | 30 |
The objective of this stage is to establish delivery routes that satisfy all delivery requests, while minimizing total distance generated by the first-round delivery and, in case of failure, the rescheduled delivery. Several assumptions are made here:
Every customer has one delivery request of size 1 in a week and the truck capacity is 5.
The delivery option given to the customers would be the day of delivery expected. Then, it is up to the carrier to select the optimal delivery time on that day and propose it to the customers. Two types of days are considered here: weekdays and Saturday. By this assumption we attempt to explore the interest of Saturday delivery.
All customers will accept the proposed delivery time windows. The time window is set to 1 h and the associated absence probability is the average of the values in Figure 2, e.g. the average value of 8 h-8 h30 and 8 h30-9 h for 8-9 h.
Failed delivery due to the absence of customer will be rescheduled as a direct delivery from the e-tailer’s storage point to the customer in the next day. Accordingly, the distance generated by the rescheduling is equal to round trip distance × absence probability for each customer. In other words, we do not consider another VRPTW for the failed deliveries due to the service constraint and the lack of knowledge on new deliveries.
Truck’s speed is set to 20 km/h in city.
Service time per customer is set to five minutes.
4.2.2 Delivery optimization model
We assume that in each time slot the delivery customers’ attendance probability is known and that the optimal time slot for each customer’s delivery is that with the highest attendance probability. It is therefore a typical capacitated VRPTW (Baldacci et al., 2011; Solomon, 1987; Azi et al., 2007), in which the time window is the optimal time slot for delivery. We propose a Mixed Integer Linear Programming (MILP) model for the capacitated VRPTW which follows the guidelines of Toth and Vigo (2002) and incorporates the classical constraints to enforce time windows that can be found in Azi et al. (2007). The MILP can be described as follows. Given a set of customers V={1,2, …, n} with known demands of qi for any i∈V, we have a fleet of homogeneous vehicles of capacity Q to deliver those demands, from a depot noted as 0 to customers. The directed graph can be thus noted as G=(V+,A), where V+=V∪{0} is the set of nodes and A is the set of arcs. Each arc (i,j)∈A is associated with a travel time tij>0 and a distance dij>0. Each customer i∈V is associated with a service time si and a time window [ai,bi] that presents, respectively, the earliest and latest time at which the service must begin at i. The objective is to minimize the total distance traveled to serve all customers while satisfying the capacity and time window constraints:
s.t.:
With decision variables: xij is 1 if arc (i,j) is included in any route, 0 otherwise; ti indicates the start time of service on every node i.
In the model, (4)-(5) guarantee that every customer is visited exactly once and that every route begins from the depot and ends at the depot. Equations (6)-(7) ensure that the total demand on every route will not exceed the vehicle capacity Q, in particular ui is a variable indicating the accumulative total demand on customer i. Equations (8)-(9) ensure feasibility of the time schedule on every route, with N a large number.
4.2.3 Results and optimal transportation plan
Five scenarios are designed for this case, as shown in Table II. S0 serves as baseline scenario that does not consider time windows in transportation planning, thus not taking into account absence probabilities. In other words, S0 is a classic VRP optimizing transportation distance and it represents a conventional approach to the problem. S1 and S2 take into account the customers’ optimal time windows profile only in weekdays. S3 and S4 consider both weekdays and Saturday so that customers are divided in two clusters: one for the customers with highest attendance probability appeared on weekdays and another one for the others. Scenarios 1-4 are therefore used as different ways the proposed approach can be implemented in this business scenario.
Scenarios and results
| Sc. | Time windows | Saturday delivery | Waiting time ⩽60 min | Distance of first delivery (km) | Total distance (km) | Δkm vs S0 (%) | Average probability of successful first delivery (%) |
|---|---|---|---|---|---|---|---|
| S0 | N | N | N | 111 | 367 | – | 37 |
| S1 | Y | N | N | 130 | 320 | −13 | 55 |
| S2 | Y | N | Y | 166 | 356 | −3 | 55 |
| S3 | Y | Y | N | 143 | 295 | −20 | 63 |
| S4 | Y | Y | Y | 176 | 327 | −11 | 63 |
All time windows can be observed from Figure 2. Since the optimal time windows can be dispersive in a day, in S2 and S4 we deliberately added the constraint (12) to limit the waiting time in-between two successive customers to 60 minutes. Constraints (8) and (12) define that, when xij=1, tj−60⩽ ti+ si+ tij⩽ tj:
All scenarios ran using GUSEK on a ThinkPad T440 with 4 GB of RAM. For all scenarios, every single computation process required about one minute, except S0 that required nearly 7 h. The results are summarized in Tables II and III.
Optimal tours in the scenarios
| Sc. | Optimal tours |
|---|---|
| S0 | R1=(0-10-6-1-13-8-0), R2=(0-7-12-5-4-2-0), R3=(0-11-15-14-9-3-0) |
| S1 | R1=(0-4-2-5-12-7-0), R2=(0-8-10-1-13-6-0), R3=(0-11-9-14-15-3-0) |
| S2 | R1=(0-7-0); R2=(0-4-0), R3=(0-6-12-5-0), R4=(0-8-13-15-3-2-0), R5=(0-9-14-11-1-10-0) |
| S3 | WD: R1=(0-4-8-13-12-7-0); Saturday: R2=(0-1-11-14-15-6-0), R3=(0-10-9-3-5-2-0) |
| S4 | WD: R1=(0-4-8-13-0), R2=(0-12-7-0); Saturday: R3=(0-5-2-0), R4=(0-1-11-10-0), R5=(0-9-14-3-15-6-0) |
Theoretically, S0 provides the shortest routes without considering time windows and failure probability, i.e. the first-round delivery. However, this routing plan caused a low rate of successful delivery of 37 percent and, as a result, generated the highest total distance resulted from a significant number of rescheduled deliveries. Low rate of successful delivery can also be seen as poor service to customers, since it means that customers might not receive their orders on time. In terms of total distance, S3 considering Saturday delivery performs the best, reducing 20 percent km comparing to S0, thanks to a higher rate of successful delivery of 63 percent. This is because nine of the 15 customers have lower absence probability on Saturday. As shown by S2 vs S1, or S4 vs S3, the constraint (12) that aims to limit each waiting time made total distance increased. However, without this constraint, the waiting time in-between two successive customers can be longer than 3 h in S1 and S3 (result of timeline is not provided here due to lake of space). In practice, waiting time depends closely on the quantity of customers to deliver in a tour.
5. Conclusions and discussion
With the emergence of e-commerce in grocery retail, the food supply chain faces new challenges. In this paper, we focused on such a challenge regarding the successful delivery of grocery orders placed online. Due to the perishability and sensitivity of some grocery items, customer attendance is often critical for the successful delivery of online orders. As a solution to this problem, this paper introduced a two-stage methodological approach that utilizes customer-related data to schedule transportation plans. This is done by first estimating the probabilities of customer attendance/absence at different point of times during a day and then using these estimations in a way that satisfies a company’s key performance indicators (e.g. maximize the probability of attended delivery while minimizing travel distance covered by delivery trucks).
As an application example, this paper presented an experimental study to investigate how a customer’s historical electricity consumption data can be used to estimate time windows with a lower probability of inoccupation (absence). The best time windows were then used in a VRP model in order to plan the deliveries of online orders to customers aiming at improving delivery success rate. A numerical study has been conducted to demonstrate the effectiveness of the proposed approach that shows its potential in the delivery of online grocery shopping.
Besides increasing the rate of successful deliveries, the proposed approach can help e-tailers better understand the habits of their customers and thus the optimal delivery time for them. It can also be considered as a useful tool for dynamically pricing different delivery options and as a mechanism for time slot management. From a customer’s point of view, the approach can improve customer satisfaction as it can reduce unnecessary traveling to pick up missed orders or long telephone calls required to re-arrange deliveries. It is also obvious that the approach can easily be used in different business cases in urban freight transportation and last-mile logistics (e.g. non-food items, general merchandise) where attended home delivery is critical and alternative solutions cannot be easily offered.
This study is among the first ones integrating data mining techniques in urban freight transportation. Some prospects can thus be identified to this line of research. For example, one may test the approach with other customer-related data sets, e.g. water consumption, historical deliveries, or with different data mining techniques in order to compare accuracy and performance. The attendance probabilities can also be used in different VRP models or for different reasons such as slot pricing. Further, the proposed methodological approach can also be generalized from e-grocery commerce to all businesses that provide home delivery service, i.e. the general AHDP.
Several limitations have to be carefully considered with regards to the proposed approach. First, some legal issues (e.g. data privacy and security) can arise from accessing and using energy consumption data of households by third parties. Second, some e-grocery retailers offer the possibility of time slot selection from the customer during the placement of an order. Even though the proposed approach is generic enough to cover this case, the application example in this paper did not demonstrate this interesting scenario. Finally, as any other data-driven approach, our approach might be limited by computational capacity. The first stage of our approach could be limited by the size of the training data and the data mining algorithms used on them. The second stage is mostly limited by algorithmic efficiency. Further field testing to select the appropriate, case-specific training data, and algorithms is required before putting the approach into practice.
