This study explores the persistence of stock market spillovers and the speed of recovery from global financial market uncertainty across different economic cycles.
We analyse daily stock data from 15 countries spanning 2002 to 2024, covering the Dot-com bubble, the 2008 Global Financial Crisis and the COVID-19 pandemic. A vector autoregression (VAR) model is employed to examine the dynamics of spillover transmission and the resilience of markets across developed, emerging and developing economies.
During the Dot-com recovery, global markets showed moderate interdependence, with the US, UK and Switzerland exerting the largest spillover effects. The 2008 financial crisis significantly increased interconnectedness, with Mexico and other emerging markets showing high contagion, while developed markets remained key transmitters. During COVID-19, markets became increasingly sensitive to global shocks. Notably, countries like Thailand, Japan and Brazil began to exhibit stronger spillover influence, while Russia showed quicker recovery. In the post-pandemic recovery, overall resilience improved, with faster absorption of shocks and stronger internal stability. However, the US, UK and Switzerland remained primary spillover sources throughout all periods.
Findings underscore the need to strengthen economic resilience, especially in vulnerable emerging and developing economies.
This study adds depth to the literature by offering a comparative analysis of spillover persistence and resilience across various market types under changing economic conditions. It provides evidence of evolving spillover dynamics and highlights the growing importance of emerging markets in global volatility transmission.
1. Introduction
Global financial markets have become increasingly interconnected, with shocks originating in one market often echoing across the globe. This growing integration has created a financial landscape where fluctuations in one market can trigger ripple effects, influencing portfolio values, risk management strategies, and global economic outlook. The interconnectedness of global markets raises significant questions about economic stability, investor behaviour, and policy formulation, making it a critical area of study for financial experts and scholars. This phenomenon is especially evident during periods of economic turmoil or financial crises, where volatility in one market often spikes abnormally due to external shocks, regardless of a country’s underlying economic conditions (Forbes and Rigobon, 2002). As financial markets become more integrated, understanding the dynamics of these interdependencies has become essential for crafting effective risk mitigation strategies and fostering economic resilience.
An extensive body of research has explored the nature and extent of interconnection among financial markets. Raddant and Kenett (2021), Eun and Shim (1989), and Gębka and Serwa (2007) demonstrated that market movements are far from isolated events, highlighting that a substantial portion of a market’s returns and volatility are attributed to conditions in other markets. These findings emphasise that while global shocks can trigger synchronous market responses, deeper interlinkages persist among markets beyond the influence of external shocks. Moreover, geographic proximity often plays a pivotal role in market interactions. Raddant and Kenett (2021) observed stronger correlations among markets within the same region, suggesting a regional clustering effect in market responses. In addition, there exists different spillover effects on different sizes of the markets, for instance, markets with smaller capitalisation are disproportionately impacted by fluctuations in larger markets (Nguyen et al., 2020; Baumöhl et al., 2018). Notably, Mukherjee and Mishra (2010) demonstrated the presence of bi-directional spillover effects, indicating that even smaller markets can influence larger ones.
Despite the significant progress made in understanding market spillovers, gaps remain in the existing literature. Many earlier studies, such as Eun and Shim (1989), were constrained by limited datasets; for instance, their analysis covered just five years with 1,560 observations, limiting the generalisability of their findings. Additionally, some studies have overlooked critical factors such as regional clustering, time zones and market opening hours, which can significantly influence the speed and magnitude of spillover effects (Baumöhl et al., 2018). Furthermore, little attention has been paid to how spillover dynamics vary across different economic contexts, such as during crises and recovery periods, or among markets in mature, emerging, and developing economies. The varying responses of these markets remain under-explored, leaving a gap in understanding how market characteristics influence spillover impacts. Addressing these limitations is essential for providing a more systematic and comprehensive understanding of global market interdependencies, particularly given increasing global financial integration.
Our study builds on existing research by offering a comprehensive perspective on global market interconnection to address these critical gaps in literature. First, we conducted a cross-country study and systematically quantified spillover effects across 15 mature, emerging, and developing markets. This provides a detailed understanding of how market characteristics and economic maturity influence spillover dynamics. Our analysis highlights differences in the vulnerability and resilience of various economies and offers insights into the specific drivers of market behaviour within different economic contexts. Second, we conduct a cross-period study, and the data collection spans an extensive period from 2002 to 2024. This period contains major global financial events, including the 2008 Global Financial Crisis, the COVID-19 pandemic, and their respective recovery phases. By covering both crisis and recovery periods, this research provides a robust analysis of market behaviour under diverse economic conditions. It goes beyond existing studies by identifying how spillover dynamics evolve over time, therefore, it offers critical insights into market adjustments during both turmoil and stabilisation phases.
Finally, we examined the duration of spillover effects from the US market, shedding light on how long shocks from a dominant global economy persist and influence other markets. This is particularly important given the central role of the US in global finance, where its market often acts as a transmitter of volatility to other economies. Understanding the persistence of these effects is crucial to help policymakers and investors manage risks and stabilise markets. By addressing these three aspects, market-specific spillover behaviour, temporal analysis across economic conditions, and the duration of spillover effects, our study deepens the understanding of global financial interconnection and provides practical insights for improving economic stability, crafting policy interventions, and developing more resilient investment strategies.
Our study utilises daily close prices from 15 countries across three economic groups: mature, emerging, and developing countries, over the period from 2002 to 2024. We investigate the spillover effects among global stock markets, focusing on key regions including Europe, Asia, and emerging markets. We focus on quantifying the spillover effects of different markets under various economic conditions using VAR models. We analyse each market’s self-resilience, the extent of the spillovers it transmits to other countries, and the degree to which it receives spillovers from other markets. Additionally, we analyse the persistence of the US market’s influence over time and examine how shocks originating from the US affect other markets in terms of volatility transmission, correlation, and market integration.
We find that during the recovery from the Dot.com bubble, global markets displayed moderate interdependence, with a slow absorption of shocks from the US market, taking 9–15 days. Developed economies like the UK, US and Switzerland exhibited the highest spillover effects on other markets, reflecting their strong global integration. During the 2008 financial crisis, intermarket spillovers surged significantly. Markets in India and Mexico experienced prolonged contagion effects lasting 15 days, while Thailand and the UK demonstrated quicker responses to shocks from the US. While the UK, US and Switzerland maintained their roles as major spillover contributors, Mexico emerged as a developing economy with significant outbound spillovers. In the recovery phase following the financial crisis, markets returned to moderate interdependence, but they continued to show high persistence in responding to external shocks. The UK, US, Switzerland, and Mexico remained prominent spillover contributors. During the COVID-19 pandemic, markets witnessed vulnerability to external shocks, though the Russian market demonstrated very short persistence. While spillovers from the US market decreased, they still played a significant role, Switzerland and the UK became the most influential. Additionally, Thailand, Japan, and Brazil emerged as notable sources of spillovers to other markets. In the recovery phase from COVID-19, most markets exhibited greater self-containment and resilience, with faster absorption of shocks. However, the UK, the US, and Switzerland continued to have significant spillover effects on other economies.
Understanding the dynamics of spillovers between markets is critical for designing effective global crisis responses. For instance, during the 2008 financial crisis and the COVID-19 pandemic, coordinated interventions by central banks and governments were instrumental in stabilising global markets. Analysing how markets react to external shocks and propagate spillovers can help policymakers develop targeted strategies to manage economic instability. Additionally, emerging and developing markets, often burdened by structural vulnerabilities such as high external debt, currency volatility, and political uncertainty, are more susceptible to spillover effects. By examining the transmission of shocks from mature economies to these vulnerable markets, policymakers can focus on building economic resilience and addressing weaknesses to mitigate future risks. The second section presents the literature review. The third section illustrates the study design while the fourth section discusses the findings. The fifth section discussed the key findings and made comparisons with existing literatures. The final section summarises the conclusion, practical implications, limitations, and future study directions.
2. Literature review
2.1 Spillover, persistence and speed of adjustment
Spillover has been widely used as an index to assess the connectedness among different financial markets. It was first introduced by Diebold and Yilmaz (2012) as a foundational tool to measure volatility transmission and directional spillovers across markets. Since then, spillover framework has been instrumental in understanding how financial disturbances propagate during stable and volatile periods. Similarly, Engle (2002) developed dynamic conditional correlation (DCC) models to capture evolving correlations between markets, offering deeper insights into the dynamic nature of global financial interconnectedness. Given the dominance of the US stock markets, numerous studies have analysed their influence on other economies. Forbes and Rigobon (2002) noted that contagion effects, where financial shocks in the US spread to other markets, are recurring phenomena during crises. Bekaert et al. (2014) further highlighted the role of the US market in driving global volatility and affecting both developed and emerging economies.
However, studies on the persistence and intensity of the US market spillovers reveal variations based on market conditions and regional characteristics. For example, Sahiner (2024) observed that during crises such as the 2008 Global Financial Crisis and the COVID-19 pandemic, US-driven shocks persisted for weeks to months, with greater intensity during periods of high volatility. Su et al. (2024) found that developed markets like Hong Kong and Japan are particularly sensitive to US shocks; while emerging Asian markets experience more localised and shorter-lived effects. Aloui et al. (2011) demonstrated that US volatility spillovers persist over extended periods, particularly during downturns, raising concerns about the resilience of other economies. However, Kose et al. (2003) argued that while the US remains central, regional hubs such as Europe and Asia are emerging as influential players, challenging the long-existing dominance of the US.
Research on global financial interconnectedness underscores its impact on market stability and systemic risks. Raddant and Kenett (2021) investigated how interdependencies among global financial markets affect risk dynamics. They identified key determinants of network structure, including country-level impacts (e.g. the US, Netherlands, and Hong Kong), sector-specific dynamics (e.g. financial, energy, and materials), regional groupings (e.g. “West” versus “East”), economic development, and country-to-country interactions. Eun and Shim (1989) employed a VAR model to examine interdependencies among national stock markets, demonstrating that US innovations are the most influential globally, with European and Asian-Pacific markets responding strongly within one or two days. Gębka and Serwa (2007) analysed contemporaneous and lagged linkages in emerging markets across Central and Eastern Europe, Latin America, and Southeast Asia. They concluded that spillovers within these regions are driven by both global shocks and local factors, with overlapping trading hours facilitating contemporaneous news absorption.
Several studies have focused on regional contagion dynamics. Nguyen et al. (2022), using DCC-EGARCH models, explored the contagion effects of the US, Japan, China, and other Asian markets during the 2008 crisis and the COVID-19 pandemic. They found strong correlations between the US and Japanese markets with Asian emerging markets, as well as an increasing influence of the Chinese market in the region. Mukherjee and Mishra (2010) applied GARCH models to investigate spillovers between India and 12 other Asian markets, identifying bi-directional intraday return spillovers. However, they noted that volatility spillovers were stronger from foreign markets to India, with information transmission often delayed by a day. Baumöhl et al. (2018) provided additional insights into volatility spillovers during the 2008 crisis, identifying statistically significant spillovers in 40% of observed cases across 40 markets. They observed that while interconnectedness among markets has declined slightly, volatility spillovers remain stable, with larger markets experiencing smaller propagated shocks.
2.2 Economic policy uncertainty and volatility
Numerous studies have examined how economic policy uncertainty (EPU) influences financial market volatility and international spillovers. Sen and Wesselbaum (2023) used a multivariate GARCH model to show that EPU can spill over across countries, especially during the Global Financial Crisis, though spillovers from China were limited outside crisis periods. He et al. (2020) analysed EPU from six major economies and found that the US stock market is mainly a net recipient of EPU spillovers, with Japan having the strongest impact. They also showed that “bad” volatility reacts more strongly to EPU shocks, particularly during debt crises and trade tensions. Nguyen et al. (2020) applied a DCC-GARCH model to explore spillovers between US and EU stock markets. Their findings revealed that the US EPU negatively affects all EU markets, while only some European countries, Spain, Ireland, Sweden, and the UK, have a significant impact on US markets.
The effect of EPU also varies by market conditions: in bear markets, both US and EU EPU have negative effects on EU returns, while in bull markets, only US EPU has a significant impact. Chiang (2020) found that US policy uncertainty, covering monetary, fiscal, and trade areas, negatively affects US stock returns both immediately and with a lag. Similar effects were seen in global markets, including Europe, China, and Japan. Sector-level data also showed a consistent negative relationship between policy uncertainty and stock returns. Li et al. (2023) used spillover indices and network analysis to examine connections between the US EPU and stock markets in the US and Asia. They found strong spillover effects, with EPU being a recipient of shocks and stock markets acting as transmitters. Japanese and South Korean markets were especially sensitive to changes in US EPU, and spillovers peaked in 2020 during the COVID-19 pandemic. Su et al. (2024) confirmed that global stock markets experience strong volatility spillovers, especially during the COVID-19 crisis. They also showed that EPU plays a key role in increasing market connectedness during turbulent times.
To deepen the analysis of cross-country spillover dynamics, several studies have employed Global Vector Autoregressive (GVAR) models to quantify bilateral spillovers of uncertainty across countries. For example, Moramarco (2022) develops a novel approach to jointly measure global macroeconomic uncertainty and its bilateral transmission using a GVAR framework. By integrating a wide range of uncertainty indicators, including financial volatility, survey forecasts, policy-related and econometric measures, he finds that the spillover structure closely mirrors global economic linkages and intensifies during systemic crises such as the Global Financial Crisis and the COVID-19 pandemic. Similarly, Trung (2019) examines how shocks to US policy uncertainty propagate internationally within a GVAR model. He shows that US uncertainty significantly influences global business cycles, but the transmission is heterogeneous across countries. Both studies underscore the importance of accounting for interdependencies and asymmetries when modelling uncertainty spillovers in a globally integrated economy.
In summary, these studies collectively highlight the critical role of the US stock market in global financial spillovers while acknowledging the growing influence of regional financial hubs. The persistence and intensity of these spillovers are influenced by the nature of crises and market conditions, underscoring the importance of understanding global financial dynamics during periods of stability and instability.
3. Study design
3.1 Data collection
Table 1 presents the list of the countries in our sample. We select these 15 stock markets based on their market development, regional representation, as well as economic and financial significance. The matured markets represent highly developed and globally influential economies with well-established stock markets; emerging markets capture the dynamics of fast-growing economies with significant contributions to global GDP while developing markets provide insights into economies with growth potential and less mature financial markets. These 15 countries also represent diverse geographical regions, including North America, South America, Europe, Asia, and Oceania. This ensures the study captures regional variations in economic structures, trade relations, and financial interconnectedness. We collect the daily close, open, highest, and lowest prices of these 15 stock markets. The datasets span from 1st March 2002 to 30th April 2024, encompassing two decades of financial market activity. This timeframe covers periods of both economic booms and crises, especially the 2008 Global Financial Crisis and COVID-19 outbreak, thereby providing a comprehensive view of market dynamics under various economic conditions. We used Yahoo! Finance as our main data source, which aggregates data from credible sources, such as stock exchanges and financial data providers.
Based on the global annual GDP growth rates published by the World Bank (2023), the proposed timeframe is divided into 5 sub-periods, as illustrated in Table 2. The first three windows include 02-01-2002 to 17-09-2007; 18-08-2007 to 27-10-2011; and 28-10-2011 to 31-12-2018, aligning with data availability, with India starting on 18-09-2007, and the Philippines on 28-10-2011.
3.2 Data imputation
To ensure uniformity across time-series data, we addressed missing values caused by non-trading dates, such as bank holidays, which vary across countries. These gaps were filled using linear interpolation, a widely used method that estimates missing values by assuming a linear relationship between adjacent data points. This approach maintains the continuity and consistency of the dataset within the same time window. Additionally, we apply a logarithmic transformation to standardise the stock market data (Erdugan et al., 2019). Since the price data originates from different markets and is denominated in local currencies, the logarithmic function helps normalise the data by stabilising variance and reducing skewness. These transformations ensure that data from various markets are comparable, facilitating more robust and reliable analysis. After that, we compute the volatility of each stock market in each time window (Zhang et al., 2020a, b) and we use the Augmented Dickey-Fuller (ADF) test to assess the stationarity of each dataset.
3.3 VAR model
Building on Diebold and Yilmaz’s methodology (2009, 2012), the extended VAR framework offers a more accurate way to quantify market interactions and dependencies. We estimate the spillover index using the VAR model, as shown in Equation (1):
where Ht is the highest price on day t, Lt is the lowest price on day t, Ct is the closing price and Ot is the opening price. Variance decomposition under the context of the VAR model is a technique that divides the forecast error variances of each variable into components attributable to shocks within the system. The H-step-ahead forecast error variance decomposition, θg, ij (H) is calculated using Equation (2):
where σjj is the standard deviation of the error term for the j-th equation, ei is a selection vector with the i-th element being one, and ∑ is the variance matrix for the error vector ε (Diebold and Yilmaz, 2012). In the variance decomposition matrix, the element in each row is normalised according to Equation (3) to represent how many percent of the total error is attributable to each variable in each row:
We derive directional contagion to determine the contributions of each market to others and vice versa. We use Equation (4) to identify the proportion of volatility contagion that is transmitted from one variable to others, while Equation (5) measures the spillover effect received by that variable from others (Zhang et al., 2020a, b):
In addition, we calculate net pairwise using Equation (6) to measure the net directional spillover effects from one asset to another:
Lastly, this study utilises the Akaike Information Criterion (AIC) to calculate the persistence of the US market’s shock on others, as shown in Equation (7):
where L represents the maximised value of the likelihood function of the model, and k is the number of estimated parameters. By minimising the AIC value, it determines the most appropriate length of lag that best captures the dynamics of how shocks in the US market affect other markets.
4. Results analysis
4.1 Descriptive analysis
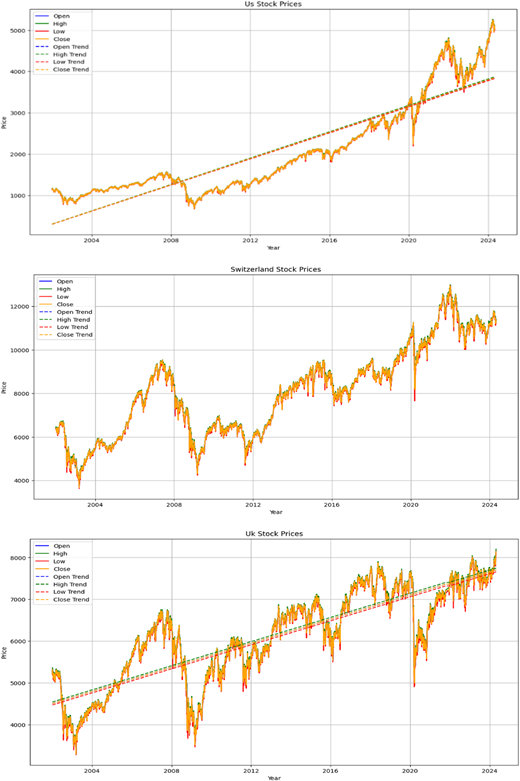
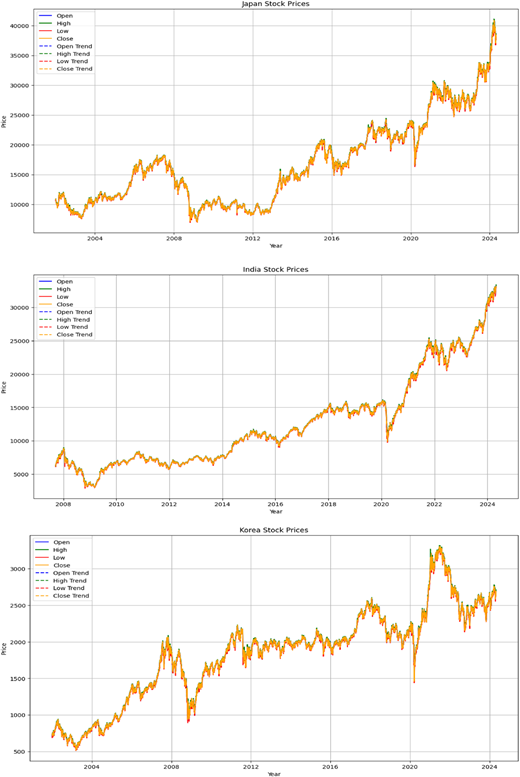
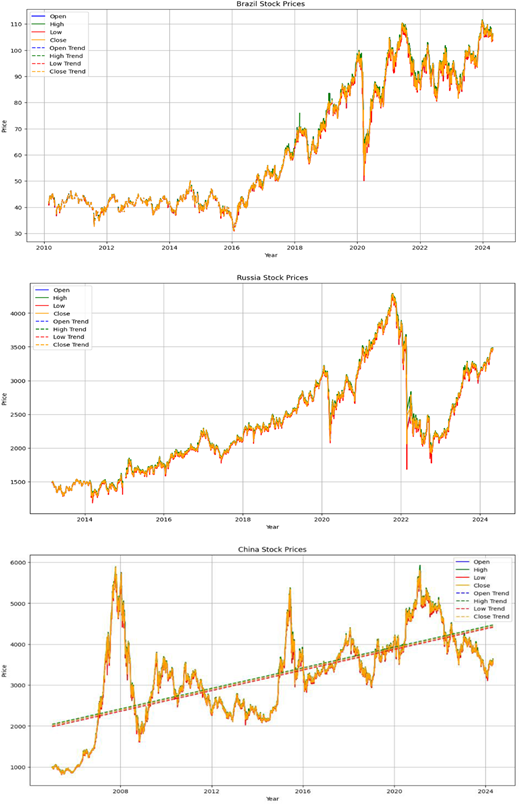
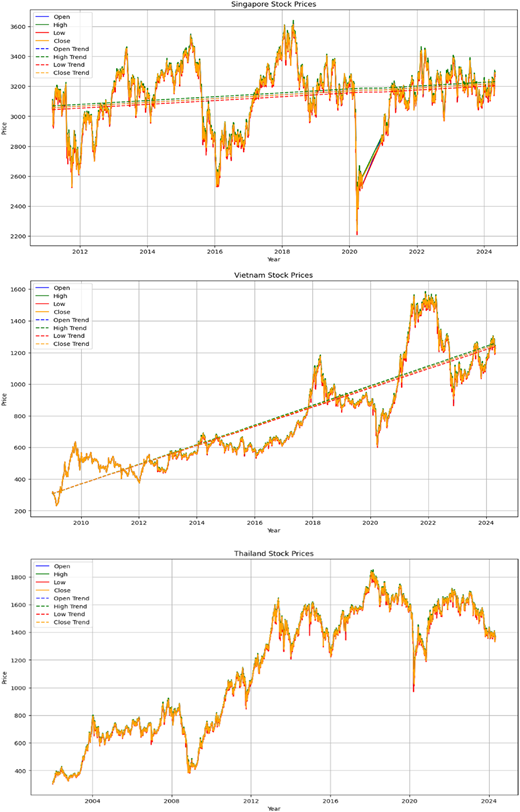
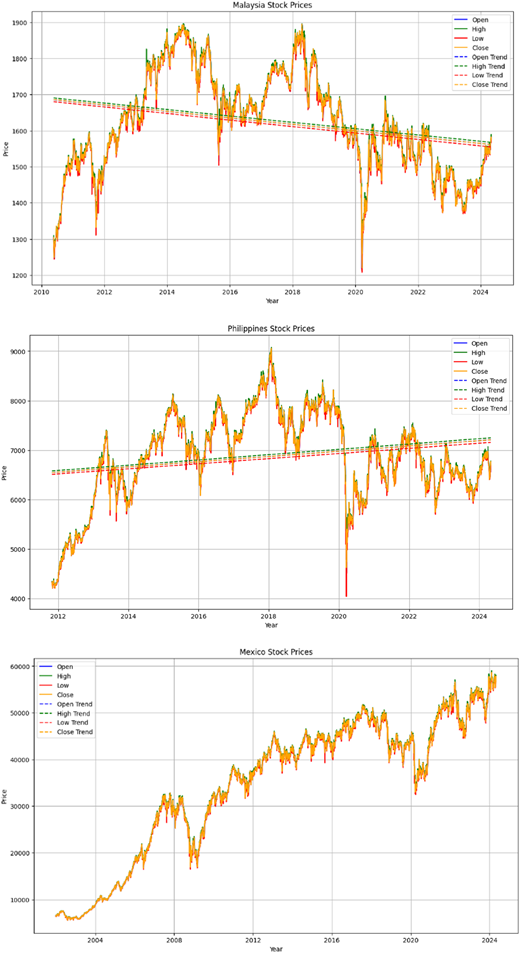
The descriptive analysis of daily open, high, low, and close prices of market data from the 15 countries is summarised in Table 3, while Figure 1 illustrates the market trends from 2002 to 2024.
The US stock market exhibits strong growth and resilience, characterised by high mean prices and notable volatility throughout 2002 to 2024, supported by steep upward trendlines. Based on high mean prices with tight price ranges and lower volatility, the Swiss market seems very stable. The UK market demonstrates strong growth over time, evidenced by its upward trendlines. Japan’s stock market grow has a wide range of min and max prices, with high volatility, reflecting both economic recovery and challenges over the period. India’s market exhibits dramatic growth, especially post-2020, highlighted by its wide price ranges and considerable volatility during the period. South Korea’s market indicates considerable growth and periodic high volatility. Brazil’s stock market demonstrates steady growth until 2016, but increased drastically from 2016 to 2024, resulting in significant volatility. Russia’s market exhibits high volatility, with stable growth until 2020, followed by downturns possibly due to the COVID-19 and Ukraine war from 2022. China’s stock market reflects significant economic changes and rapid growth based on its high volatility and upward trendlines. Singapore’s market shows a relatively stable yet upward trend over the period. The Vietnamese market, while smaller, shows substantial growth and volatility. The Thai market shows an upward trend with some fluctuations. Malaysia’s market displays steady growth with moderate fluctuations, and a declining trend in stock prices over time. The Philippine stock market has exhibited a significant range of prices over the studied period, indicating a rapid growth throughout the period. Mexico’s stock market has shown significant growth, especially after 2007, with high volatility.
4.2 Results of ADF test
Table 4 presents the results of the ADF test result. The results reveal that the time-series data of close prices for all stock markets are stationary, demonstrating their feasibility in using the VAR models.
4.3 Observation of spillover effects
To evaluate spillover effects across selected stock markets, we use results from the VAR model, applied over five distinct time windows. Only the UK, Mexico, Japan, Korea, Thailand, Switzerland, and the US have available stock market data as early as 2002, so these seven countries are included in the spillover analysis. Tables 5–10 below show the spillover dynamics among these countries across each of the five windows. The rows indicate the level of spillover received from other countries, while the columns indicate the level of spillover transmitted to other countries. Green, yellow and red cells indicate the strong, moderate and light spillovers, respectively.
Table 5 indicates a period of relative stability, where markets exhibit moderate interdependence in Window 1, reflected by a total spillover index of 27.16%. This suggests that, while the markets are interconnected, the influence of external shocks is not overwhelmingly strong. Most markets demonstrate a degree of independence, as over 50% of their variances are explained by their own past values. The UK, Switzerland and the US play the most central roles in this network, acting as both primary transmitters and recipients of spillovers. The UK exerts a directional spillover effect of 57.79%, showing its strong influence on other markets. It also receives 41.95% of its variability from spillovers generated by other countries, highlighting its bidirectional integration within the global financial system. Switzerland similarly contributes significantly to outward spillovers at 40.23% and absorbs 46.84% from other markets, indicating a balanced role in transmitting and receiving financial impacts. The US market, with a 46.31% contribution to outward spillovers and a 33.22% inflow from other markets, maintains its position as a major source of global financial influence, though it is less impacted by external spillovers than Switzerland and the UK.
Japan’s market plays a significant role in the Asian region, especially influencing neighbouring countries. It exerts spillovers to Korea and Thailand at 6.15% and 1.43%, respectively, while receiving 6.48% from Korea and 2.01% from Thailand. Japan also has substantial financial ties with Western markets, receiving spillovers of 4.04% from the US and 4.31% from the UK, reflecting its integration with both regional and global markets. The Korean market is notably influenced by major players, particularly Japan and the US, from which it receives 6.15% and 5.06%, respectively. In turn, Korea exerts spillovers of 6.48% to Japan and 1.69% to Thailand, underscoring its growing capacity to influence neighbouring economies due to regional economic integration. Korea’s market dynamics indicate a balance between sensitivity to international spillovers and its expanding role in the region.
As an emerging market, Mexico shows moderate spillover dynamics, contributing 18.69% in directional spillovers to others and receiving 20.65% from external sources. Mexico’s financial linkages are especially pronounced with the US, from which it receives 11.73% of spillovers while transmitting 8.1% back to the US. However, Mexico has a limited impact on advanced economies like Japan and Switzerland. Overall, the interdependencies in Window 1 reveal a structure where developed markets such as the UK, Switzerland, and the US drive spillovers, while emerging and regional markets like Mexico, Japan, and Korea exhibit a mix of influence and susceptibility, with varying degrees of connectedness.
Table 6 shows the spillover behaviour during the 2008 financial crisis and demonstrates a remarkable spillover increase within the global financial market. The spillover index rises to 50.75%, and in each country, the spillover received from other countries jumps drastically compared Window 1. This suggests that during the financial crisis, global markets became more interconnected. The variances explained by their own past values reduced dramatically, with the UK having the smallest value at 36.63% and Thailand having the largest percentage at 67.66%. The UK market is both a key source and recipient of spillovers. While it influences other markets with 63.22% spillovers transmitted, a significant portion of its variation (63.37%) is attributed to influences from other countries, suggesting that the UK has strong bidirectional interconnections. Major contributors to the UK’s received spillovers are the US (19.33%) and Switzerland (19.45%). Switzerland has substantial bidirectional spillovers, with 60.41% of its variance influenced by external factors and contributing 53.54% of spillovers to other markets. It is notably impacted by the UK (18.76%) and the US (18.96%), which reflect its integrated role in the global financial network. The US market exhibits both high inward and outward spillovers. It transmits 94.15% of its variance to other markets, primarily impacting Mexico (22.37%) and Switzerland (18.96%). It also receives 54.72% of its total variance from spillovers, showing a balanced interdependence with major global economies, particularly the UK (14.55%) and Switzerland (11.08%).
Mexico shows the highest outward spillovers among all markets, transmitting 88.18% to others, primarily influencing the US (22.20%) and Japan (12.88%). However, it is also relatively impacted by external forces, with 49.54% of its variance attributed to spillovers from other countries. The most substantial inbound influence for Mexico comes from the US (22.37%). Japan exerts moderate spillover effects, particularly influencing Korea (6.67%) and Mexico (3.90%). It receives 49.93% of its total influence from external sources, with notable contributions from the US (13.42%) and Mexico (12.88%). This interdependence highlights Japan’s strong regional influence in Asia and its susceptibility to broader global market changes. Korea receives a substantial portion of its variance (44.97%) from spillovers, indicating its sensitivity to external forces, especially from Japan (6.67%) and Mexico (11.45%). In turn, Korea transmits 22.63% of its spillovers to other markets, suggesting its growing but limited regional impact compared to larger economies. Thailand shows the highest degree of independence among these markets, with 67.66% of its variability explained by its own past values. It receives spillovers primarily from Mexico (11.19%) and Korea (3.16%) and contributes modestly to other markets with only 12.3% outward spillover, reinforcing its relative isolation in the network. Overall, Window 2 reveals that Mexico and the US are the most influential in terms of spillovers transmitted to others, while the UK, Switzerland, and the US are central nodes in this network, demonstrating strong bidirectional interdependence with the other markets. In contrast, Thailand remains relatively isolated with limited influence on and from other markets.
Table 7 indicates that the total spillover index decreases to 33.76% in Window 3, reflecting continued but moderate interdependence. The results suggest a period of recovery and relative stability following a crisis, where markets are still intertwined, but the intensity of contagion effects has reduced. Each market, again, has relatively high self-dependence of over 50%. The UK market shows a notable level of self-reliance, with 51.86% of its variance explained by its own past values. It is a strong source of spillovers to other markets, contributing 54.66% to others, primarily impacting Switzerland (18.61%) and the US (12.11%). It also receives significant influence from external sources (48.15%), particularly from the US (16.55%) and Switzerland (13.1%), indicating its central role in the global network. The US market is again central in the spillover network, explaining 65.3% of its variance internally but transmitting a significant 61.23% to others. It has a considerable influence on the UK (16.55%), Mexico (8.77%), and Japan (10.28%). The US also receives 34.71% of its variance from spillovers, particularly from the UK and Switzerland, reinforcing its strong bidirectional links with other major markets. Switzerland is a significant player in terms of bidirectional spillovers, with 58.79% of its own variance explained internally while transmitting 30.95% of spillovers to other markets. It is particularly influenced by the UK (18.61%) and is a notable contributor to the US (12.86%) and UK markets. This reflects Switzerland’s importance in the European financial landscape.
Mexico demonstrates a high degree of independence, with 67.88% of its own variance attributed to its internal dynamics. It transmits 29.42% of its spillover to other markets, mainly affecting the US (8.77%) and Japan (4.69%). Mexico is relatively insulated from external influences, with only 32.12% of its movements impacted by other markets. Japan’s stock market shows strong self-sufficiency, with 62.79% of its variance explained by its own values. It transmits 20.59% of spillovers to others, with notable influence on Korea (6.76%) and the US (10.28%). Japan’s moderate inward spillovers (37.22%) indicate its position as both a regional leader and a receiver of spillovers, mainly from the US and Mexico. Korea exhibits high independence, with 70.6% of its variance explained by its own history, showing less sensitivity to external shocks. It transmits 24.42% of spillovers to other markets, primarily impacting Japan (6.76%) and the US (7.3%). The inward spillovers for Korea are relatively low (29.41%), highlighting its relative stability in this window. Thailand is the most self-contained market in this period, with 86.53% of its variance explained by its own values, suggesting limited integration with global financial markets. It contributes a small 15.02% to other markets, making it the least influential in terms of spillovers. Thailand is also minimally affected by external influences, with only 13.47% of its variance attributed to spillovers from others.
Overall, in this window, markets exhibit a more independent phase, with a lower total spillover index (33.76%) indicating reduced interdependence. Thailand and Korea maintain the highest levels of internal variance, signalling regional stability. The UK, Switzerland, and the US are the main contributors to spillovers, with the US remaining a key influencer globally, while Switzerland and the UK play essential roles within Europe. The emerging market of Mexico shows high self-reliance and low spillover activity, demonstrating its relative isolation from external shocks.
In Table 8, the overall spillover index rises to 58.41% in Window 4. This reflects another period of significant global economic stress and enhanced market integration, corresponding to the COVID-19 pandemic crisis. During this phase, all seven markets exhibit a high degree of vulnerability to external shocks, with over 50% of their variance explained by movements in other markets. The UK shows a high level of outward influence, contributing 96.61% in directional spillovers to other markets. This reflects its role as a major global financial centre. Meanwhile, the UK absorbs a significant 60.38% of spillovers from other markets, indicating it is affected by global dynamics, particularly from Switzerland (27.14%) and Thailand (11.51%). Switzerland has the highest outward spillover at 115.62%, indicating its significant global influence, particularly on the UK (23.47%) and Thailand (18.64%). Switzerland, meanwhile, receives 57.86% spillovers, suggesting substantial feedback from global markets, mainly from the UK and Thailand. The US shows a significant 47.86% outward spillover effect, impacting Mexico (8.78%), Japan (7.69%), and other major markets. It also has a high inward spillover rate of 62.22%. On the other hand, the US is influenced heavily by Switzerland (21.74%) and the UK (16.55%).
Mexico exerts moderate influence with 30.92% in directional spillovers to other markets and receives 51.98% from others, showing more sensitivity to external factors. Mexico is particularly influenced by the UK (11.95%) and Switzerland (16.25%), suggesting a strong susceptibility to external shocks. Mexico’s close economic ties with the US and its emerging market status make it sensitive to changes in advanced economies. Trade and foreign direct investment links with the UK and Switzerland might also contribute to spillover effects. Japan transmits 40.68% of directional spillovers, with considerable influence on Korea (9.3%) and Thailand (8.16%). However, it also receives 58.6% spillovers from other stock markets, especially, since it is highly influenced by the UK (15.34%) and Switzerland (17.72%). Korea has moderate outward spillovers (17.78%) but is more impacted by spillovers from other countries (60.98%), especially Japan (9.3%), Thailand (12%), and Switzerland (14.13%). Thailand shows a relatively high directional impact on others (59.39%), indicating it plays a more influential regional role than previously thought. It also receives 56.84% from external markets, especially from the UK, Japan, and Switzerland. Thailand is affected notably by Switzerland (18.64%) and Japan (8.67%), reflecting dependencies on global and regional players.
The spillover analysis reveals that mature financial centres like Switzerland, the UK and the US exert strong influences on global markets, while also being significantly impacted by each other. Emerging markets such as Mexico, Korea, and Thailand display moderate outward spillovers but are more sensitive to shocks from larger economies, particularly those with close economic ties. Regional interdependencies are evident, especially in Asia, where Japan plays a key role in influencing Korea and Thailand, reflecting both global and regional economic interconnectedness.
Table 9 reveals that the spillover index in Window 5 drops remarkably to 17.05%, indicating a period of reduced global market interdependence. This suggests a post-crisis recovery phase and a period of relative economic stability, in which global market interdependence is reduced. During this period, all markets exhibited strong self-dependence, with over 65% of their market variance explained by their own historical data. Emerging and developing markets such as Mexico, Korea and Thailand show significantly high independence with approximately 90% of their variances driven by their own shocks. This suggests that during periods of recovery or stability, internal factors drive market movements rather than external shocks.
The UK market exhibits a moderate degree of independence, with 67.22% of its variance driven by its own past values. However, it also has a substantial outward spillover influence, especially towards Switzerland (20.74%) and the US (6.8%). Switzerland displays a high degree of influence on other markets, as evidenced by its substantial directional spillovers, especially to the UK (17.2%). It retains 64.88% of its variance through self-dependence but still absorbs spillovers from the UK (10.33%) and the US (5.84%). The US market is predominantly self-sustaining, with 88.11% of its behaviour internally determined. It has a moderate spillover influence on Switzerland (5.84%) and receives spillovers from the UK (1.81%) and Mexico (2.03%).
Mexico’s stock market is highly self-contained, with 90.96% of its behaviour explained by its historical performance. Its interactions with other markets are limited, with minimal spillovers received or exerted. However, there are some moderate spillover effects from Switzerland (4.13%) and the US (2.52%). This high level of independence indicates Mexico’s relative insulation from external market shocks during this period. Japan also shows a high level of self-dependence, with 91.28% of its variance driven internally. The primary international influence on Japan’s market comes from Switzerland (2.32%) and Korea (2.09%), suggesting the interconnectedness within regional and global markets. Japan has minimal outward spillovers, indicating that its market dynamics during this period were mostly inward-focused, with limited influence on other markets. Korea’s stock market is largely driven by internal factors, with 90.79% of its variance explained by its own history. It receives moderate spillovers from Japan (3.26%) and the US (2.66%), reflecting both regional and global economic ties. Korea’s influence on other markets is relatively small, with limited spillovers sent outward. Thailand’s market is also highly self-reliant, with 87.42% of its variance internally driven. It exhibits vulnerability to spillovers from the UK (3.67%) and Switzerland (3.63%), which may reflect trading or economic ties with these economies. Thailand’s outward influence is minimal, and its dynamics remain primarily contained, showing low interdependence with other markets in this period.
In summary, this shows that mature economies such as the UK, Switzerland and the US exhibit moderate spillover effects both outward and inward and maintain interdependencies, especially with each other. In contrast, developing markets (e.g. Mexico and Thailand) and emerging economies (e.g. Korea) are more self-contained with limited influence on global markets.
Table 10 summarises the key spillover indicators of 7 countries during 5 windows. Mexico, Japan, South Korea, and Thailand demonstrate high self-reliance, with strong internal variance across all periods. Their self-variance ranges from 39.02% to 67.66% during crisis periods and increases to 58.79% to 94.52% during recovery periods. In contrast, the UK, Switzerland, and the US exhibit relatively lower internal variance, with values between 36.63% and 45.29% during crises and 51.86% to 88.11% during recoveries. Outbound spillovers peak during crisis periods, with Mexico and the US reaching 88.18% and 94.15%, respectively, during the 2008 financial crisis, and the UK and Switzerland exhibiting 96.61% and 115.62% during the COVID-19 crisis. During recovery periods, the UK, Switzerland, and the US consistently show higher outbound spillovers compared to Mexico, Japan, South Korea, and Thailand. In terms of inward spillovers, the US, UK, and Switzerland are heavily influenced by external factors, with inbound spillovers exceeding 54.72% during crisis periods. In contrast, Mexico, Japan, South Korea, and Thailand generally maintain lower dependence on external factors, particularly during recovery phases. This disparity can be attributed to the globally integrated financial markets of developed economies like the UK, US, and Switzerland, which act as financial hubs with substantial cross-border capital flows and strong international trade ties. Conversely, Japan, South Korea, and Thailand, though export-driven, are more insulated due to regional trade blocs and a focus on domestic markets, which buffer them from global market shocks.
The results for 15 countries are included in Windows 4 and 5 to provide a more comprehensive analysis. The results are summarised in Tables 11 and 12.
Table 11 reveals that global stock markets from 15 countries are highly interconnected in Window 4, with a total spillover index of 56.24%. In terms of matured countries, the US market retains a high self-driven variance of 35.18% and shows a strong spillover from Switzerland (18.68%) and the UK (14.06%). The US remains influential and is moderately impacted by European markets, with 64.82% of its variance driven by external factors, underscoring its interconnectedness in the global financial system. Switzerland has a high level of self-reliance at 36.3% but significantly influences other countries, notably the UK (21.3%) and Thailand (13.72%). With 63.7% of its market variance impacted by international markets, Switzerland plays a central role in global finance. The UK retains a considerable 34.19% self-dependence but shows a high level of exposure to other markets (65.82%), especially Switzerland (22.38%) and the US (8.38%). This reflects the UK’s status as a major financial hub with extensive international ties, particularly with Europe and the US. Japan’s market variance is internally driven by 33.65% but receives considerable spillovers from Switzerland (13.94%) and the UK (12.7%). This reliance on foreign markets highlights Japan’s integration into the global economy, with 66.35% of its variance affected by external movements.
In terms of emerging countries, India has a notable inward spillover influence, with 68.72% of its variance attributed to external markets. Key influencers are Switzerland (12.81%) and the UK (10.86%), which underscores India’s connection to global markets, especially Europe. Self-driven dynamics make up 31.29%, showing a moderate degree of independence within its market. South Korea maintains a self-driven portion of 33.76% but has substantial external influence, particularly from Thailand (11.62%) and Switzerland (9.74%). This suggests South Korea’s sensitivity to both regional and global economic trends, with external factors accounting for 66.24% of its variance. Brazil shows a strong self-dependence at 45.35%, with key external influences from Switzerland (12.79%) and the UK (9.26%). While Brazil is relatively self-sustained, with 54.64% external influence, it remains moderately impacted by European markets. Russia displays high self-reliance, with 74.9% of its variance internally driven. It has minimal interaction with other markets, receiving modest spillovers from Switzerland (8.1%) and the UK (3.52%). Russia’s low connectivity reflects its economic detachment from most global markets. China’s market is largely self-sustaining with 70.46% of its variance internally driven, exhibiting limited spillover influence from global markets. It receives moderate external influence, with Switzerland (6.76%) as the primary external factor, reflecting China’s relative economic isolation and resilience. Singapore’s market is self-driven by 37.63% but is significantly influenced by the UK (13.99%) and Switzerland (11.84%). This high spillover from European financial hubs suggests Singapore’s strong ties to global finance, making it a bridge between Asian and European markets with over 62% of its variance due to external influences.
In terms of developing countries, Vietnam is highly self-reliant with 71.07% of its variance internally generated. It has minimal connections with global markets, although it is somewhat influenced by Brazil (5.04%) and Switzerland (2.45%), showing that Vietnam’s market is relatively isolated, with only 28.95% external influence. With 34.35% of its variance internally driven, Thailand’s market is influenced by Switzerland (13.72%) and the UK (13.17%). This significant spillover from European markets highlights Thailand’s global financial integration, with 65.65% of its variance impacted by external markets. Malaysia retains 42.57% of its own market variance but is heavily influenced by Switzerland (10.15%) and the UK (8.42%). With 35.38% of its variance driven by its own factors, the Philippines market is moderately self-reliant. It is influenced heavily by Thailand (15.15%) and Switzerland (10.87%), indicating sensitivity to Asian and European financial movements. This suggests that external factors, particularly from regional economies, play a substantial role, with 64.61% of its variance impacted by other countries. Mexico’s market displays a notable self-driven portion at 40.34%, yet it is moderately influenced by Switzerland (13.15%) and the UK (10.2%). This indicates that while Mexico demonstrates certain market independence, its financial dynamics are shaped by both European and North American economic activities, with a 59.67% external spillover.
This analysis reveals that mature economies act as major sources of spillovers, while most emerging and regional markets are relatively self-dependent and have limited external influences.
Table 12 reveals that global interconnectedness had decreased significantly, with the total spillover index of 18.33%. Most countries show greater self-containment, with over 80% being driven by its historical volatility. The US, UK, and Switzerland remained influential but with reduced impact. This period indicates a shift toward increased market resilience and reduced vulnerability to global shocks, likely a response to the challenges posed by the COVID-19 pandemic.
In terms of mature countries, the US has a substantial internal influence at 71.11%, with significant outward influence on other countries, notably the highest directional spillover to others at 42.6%. It has a substantial influence on economies worldwide, particularly in Switzerland (8.29%), Brazil (6.05%), and the UK (5.69%), indicating its far-reaching economic impact. Switzerland has the smallest internal spillover of 59.29% within the 15 countries, demonstrating a highly interconnected and internationally influenced economy. It receives substantial influence from the UK at 18.06% and exerts a high directional spillover of 45.91%, reflecting its strong role in European and global finance. The UK demonstrates a moderate internal influence of 63.88%, but receives substantial spillover from Switzerland (19.27%), indicating close financial ties within Europe. The UK exerts a strong influence on other countries, with the highest directional spillover to others (37.89%), underscoring its global economic impact. Japan exhibits an internal spillover of 88.69%, showing a robust economy with significant self-sufficiency. Externally, Japan exerts influence on other economies such as Thailand (2.1%) and Korea (1.84%), which are key trade partners in Asia.
With regards to emerging markets, India retains 82.59% of its economic influence domestically yet receives notable spillovers from the US (5.4%) and China (1.89%), which reflects its strong economic connections with both countries. India exerts a high level of influence on other countries at 20.64%, indicating its significant role in regional economic dynamics. South Korea has a lower internal influence at 79.12%, indicating higher sensitivity to external economic conditions. It receives significant influence from India (2.75%) and the US (3.63%), reflecting the importance of both countries in South Korea’s economic landscape. With a directional spillover of 14.34% to others, South Korea demonstrates notable outward influence on other countries. Brazil shows strong domestic stability with an internal spillover of 86.98%. It receives its largest influence from the US at 6.05%, underscoring the significance of trade and financial connections between the two countries. Brazil has a relatively low spillover to others at 7.33%, indicating a smaller impact on global economies compared to larger economies like the US or UK. Russia’s internal spillover is 87.95%, with substantial influence from the UK (4.89%), reflecting its historical and economic ties to Europe. Its directional spillover to others is 15.37%, indicating moderate external influence. China has a high internal spillover of 91.8%, suggesting strong domestic resilience and a largely self-contained economy. Externally, it exerts moderate influence on other markets (10.58%), while India (1.99%) and Russia (1.26%) are the most significant external influences. Singapore shows a high level of internal stability with 83.69% of influence being internal. It also exerts a moderate influence on other countries with a directional spillover of 10.54%, especially towards the UK (2.77%) and Korea (1.91%).
From the perspective of developing countries, Vietnam has a strong internal spillover of 85.93%, but it also receives notable influence from Switzerland (4.43%), possibly due to trade or financial market connections. Its spillover influence on other countries is relatively low at 9.53%, with the largest impact on US (2.75%), Switzerland (1.47%), and the Philippines (1.18%). Thailand maintains a high internal spillover at 82.34%, signalling domestic stability, but it also receives substantial influence from the UK (2.81%) and Japan (2.1%). Thailand has a moderate spillover impact on other economies at 9.49%, indicating that its economic influence is largely regional. Malaysia has a high internal influence at 90.77%, reflecting a resilient domestic market with minimal dependence on external factors. The US, with a 0.47% influence, and Thailand, with 2.31%, are its major external influences, showing the importance of regional and US trade ties. Its directional spillover to others is 5.85%, the lowest in this table, indicating a limited external influence. The Philippines receives the majority of its spillover influence internally, with 81.95% originating within its own economy, indicating strong domestic stability and insulation. Among external influences, the largest impact comes from the US at 3.37%, followed by Korea at 2.34%, and India at 4.2%, reflecting economic ties with key trade and economic partners in the region. Overall, the Philippines has moderate influence on other countries, with a directional spillover to others at 16.89%, indicating regional engagement, especially in Asia. Mexico shows a high internal spillover at 89%, signifying domestic economic resilience and lower dependence on foreign economies. Externally, it is most influenced by the US at 1.71%, reflecting strong economic ties with its northern neighbour. Mexico’s directional influence on other countries is 14.34%, showing a moderate spillover impact in the region, largely driven by trade partnerships.
4.4 Persistence of US market shocks
The optimal lag order determined by the AIC algorithm provides insights into how long the effects of a shock originated in the US stock market persist in other selected markets. The lag order represents the number of days that past information continues to influence the current values in the VAR model. Higher lag orders suggest that the impact of a shock persists for a longer duration, while lower lag orders indicate a quicker dissipation. Table 13 summarises the results of AIC for each time window.
In the first window, markets exhibit high persistence (9 to 15 days) in absorbing shocks from the US, reflecting slow adjustment likely caused by lingering uncertainties after the crisis. In the second window, persistence varies across markets: India and Mexico experience strong contagion effects with longer lag times (15 days), while Thailand and the UK adjust more quickly (5 to 7 days), possibly due to effective policy responses. The third window mirrors the first, showing consistently high persistence, which indicates continued market vulnerability driven by cautious investor behaviour and ongoing structural adjustments (Baele, 2005).
During the COVID-19 pandemic (fourth window), lag times decrease significantly, with markets like Russia showing very short persistence. This can be attributed to rapid global policy implementation and advancements in digital communication, enabling faster market responses (Zhang et al., 2020a, b). In the fifth window, persistence shortens further (5 to 10 days), suggesting greater market resilience and faster absorption of shocks. This improvement is likely due to advancements in global communication, technological innovation, and experience gained from previous crises (Diebold and Yilmaz, 2014).
Overall, these findings reveal that the persistence of US market shocks varies with the economic cycle, being higher during recovery phases and lower during crises when markets react swiftly but remain vulnerable. Post-crisis periods demonstrate improved resilience, reflecting lessons learned and structural advancements.
5. Discussion
Our study reveals the existence of spillover effects among mature, emerging, and developing economies, with the intensity of these effects varying based on the global economic environment. We find that spillover effects are reinforced during crisis periods and diminish during relatively stable times. This observation aligns with Nguyen et al. (2022), who highlighted the extension of financial contagion and spillover effects across global markets during the COVID-19 pandemic. Specifically, our findings corroborate their conclusion regarding strong correlations between the US and Japanese markets with Asian emerging markets. Additionally, although our study period differs, our conclusions align with Bekaert et al. (2014) and Forbes and Rigobon (2002), who demonstrated that financial shocks originating in the US consistently propagate to other markets, particularly during crises, driving global volatility in both developed and emerging economies. Furthermore, we observe that the UK, Switzerland, and Japan are emerging as influential markets, challenging the longstanding dominance of the US. This finding is consistent with Kose et al. (2003), further validating our research methods and outcomes. Beyond examining spillover effects from the US and other mature economies, our study takes a broader approach by analysing cross-country spillover effects among a diverse range of mature, emerging, and developing economies. This comprehensive analysis underscores the dynamic nature of global financial interconnections and provides valuable insights into how spillover effects evolve across different market types.
As economic events unfold, capital markets react to policy changes, liquidity injections, or opportunities created by volatility. Cross-border capital flows intensify as investors chase returns, hedge risks, or rebalance portfolios to adjust to new realities. Global economic shocks often lead to massive shifts in capital allocations. For example, if the US Federal Reserve lowers interest rates, it makes US assets less attractive, causing capital to flow emerging or developing markets. This amplifies financial integration, as investors simultaneously adjust positions across global markets. The rise of technology and financial innovation has made it easier for investors to access global markets in real-time. Economic events trigger immediate reactions due to high-speed information flow, algorithmic trading, and instant access to foreign assets. For example, during the COVID-19 pandemic, digital platforms allowed global investors to shift their investments in response to events rapidly, leading to more integrated financial reactions as national borders became less relevant in the movement of capital. Globalization has led to a deeper integration of trade and investment networks, meaning shocks in one part of the world quickly propagate through supply chains, financial markets, and investment channels.
During the COVID-19 crisis, Vietnam, China, and Russia demonstrated strong self-resilience, maintaining high levels of variance explained by their own past values. In contrast, countries such as the Philippines, Singapore, India, the UK, Japan, South Korea, Thailand, Switzerland, and the US experienced significantly lower self-variance values, indicating greater external influence on their markets. The UK, Thailand, and Switzerland emerged as key contributors to global spillovers, exerting substantial influence on other economies. Meanwhile, Mexico, Brazil, and Malaysia experienced medium levels of spillover impacts from external sources. Notably, Malaysia and China had minimal outbound spillover effects, while Vietnam, China, and Russia received the least spillover impacts from other countries, reflecting their relative insulation from global market turbulence during this period. During the recovery from COVID-19, most countries regained high self-resilience, with variance explained by their own past values exceeding 80%. However, the UK, South Korea, Switzerland, and the US displayed relatively lower self-variance levels (ranging from 63.88% to 79.12%), indicating ongoing external influences. The UK, Switzerland, and the US continued to exert higher spillover effects on other economies, with outbound spillovers ranging between 37.89% and 45.91%. These countries, along with South Korea, also received relatively higher spillover impacts from external sources, highlighting their interconnectedness within the global financial system even during the recovery phase.
6. Conclusion and practical implications
In conclusion, this study offers several key innovations that contribute to the understanding of global financial market interconnectivity. First, it systematically quantifies spillover effects across markets from different economic groups, developed, emerging, and developing, providing valuable insights into the varying resilience of these markets during periods of crisis and recovery. The study uses a comprehensive dataset from 2002 to 2024, incorporating significant global events such as the 2008 Global Financial Crisis and the COVID-19 pandemic, allowing for a comprehensive analysis of market behaviour under different economic conditions. By employing VAR models, the study not only measures the self-resilience of markets but also explores the transmission of shocks and the direction of spillover effects between countries. This study design enables a deeper understanding of how shocks propagate through different economies, highlighting the increased vulnerability of certain markets and the resilience of others.
Using 7 countries in the VAR model, it is found that Mexico, Japan, South Korea, and Thailand show high self-reliance, with internal variance ranging from 39.02% to 67.66% during crises and 58.79% to 94.52% during recoveries, while the UK, US, and Switzerland demonstrate lower self-variance (36.63%–45.29% in crises and 51.86%–88.11% in recoveries). The UK, US, and Switzerland are highly interconnected globally, with outbound spillovers peaking during crises (e.g. 96.61%–115.62% during COVID-19), and inbound spillovers exceeding 54.72%, whereas Mexico, Japan, South Korea, and Thailand exhibit lower cross-border dependence, especially during recoveries.
Another set of spillover analyses involved 15 countries. During the COVID-19 crisis, Vietnam, China, and Russia demonstrated strong self-resilience with minimal external influences, while the UK, Thailand, and Switzerland emerged as key contributors to global spillovers. In the recovery period, most countries regained high self-resilience, but the UK, the US, South Korea, and Switzerland continued to exhibit significant interconnectedness through higher spillover effects on and from other economies. Moreover, the persistence of US market shocks varies across economic cycles, with high persistence during recovery phases (9–15 days) reflecting slower adjustment, and shorter persistence during crises (as low as 5 days) indicating faster but more vulnerable responses due to rapid global policy actions and technological advancements. Post-crisis, markets show improved resilience and faster absorption of shocks (5–10 days), reflecting lessons learned and structural improvements over time.
Given the varied persistence of shocks during crises, market participants should implement rapid response mechanisms and suitable hedging strategies. Shifting investments toward safer assets, such as government bonds or gold, can offer protection during periods of heightened uncertainty. On the other hand, as markets exhibit higher persistence of shocks during recovery phases, market participants should adopt a cautious investment strategy. Diversifying portfolios across less correlated assets can help mitigate risks associated with prolonged market adjustments. Additionally, closely monitoring global economic indicators and policy developments is crucial, as broader economic conditions remain fragile. As markets become more resilient in post-crisis and stable periods, investors can engage in more aggressive strategies to capitalize on quick rebounds and reduced shock persistence. Leveraging advanced analytics and communication tools is critical, enabling market participants to stay ahead of market trends and make informed decisions. Regularly rebalancing portfolios is also recommended to ensure they remain aligned with the current economic environment and risk tolerance, helping maintain an optimal risk-return profile. Since financial markets dynamics vary over time as shown over five windows, market participants are highly recommended to regularly revisit and adapt risk management practices considering the latest data to maintain resilience against market shocks. Lastly, given the proven existence of contagion effects, regulators and financial oversight bodies should closely monitor the connectedness among markets to identify potential systematic risks and ensure market stability.
6.1 Study limitations and future studies
Despite valuable insights provided by this study, it is important to acknowledge several limitations that could be addressed in future research. Firstly, this study, although focuses on markets with diverse economic standings, does not cover the entire spectrum of global financial markets. Future research can extend the scope of the analysis by including extensive range of global markets, such as African and Middle Eastern markets, for more comprehensive understanding of contagion effects. Secondly, the focus of this study is exclusively on stock indices. Since financial contagion can spread across various asset classes, including bonds, commodities, derivatives, digital assets, etc., expanding the analysis to include other classes offers deeper insights into how shocks propagate across different financial markets. Additionally, adjusting for different time zones is omitted in this project due to the asynchronous opening hours of global markets and utilization of closing prices, which already reflect all market activities on that day. However, many scholars believe that time zone differences can distort the results of the VAR model. Future studies can adjust for time differences to enable more accurate assessment. Another limitation of this project is the use of VAR model, which assumes linear relationships among variables. As financial markets often exhibit non-linear behaviour in practice, future research can explore non-linear modelling approaches, such as GARCH, to better capture the complex dynamics of financial contagion. Lastly, further research can extend this study by applying Impulsive Response Functions (IRFs) to calculate the transmission speed of a shock originating in one market to another. Integrating this into machine learning models to forecast transmission speed undoubtedly aids risk management.
There are no conflicts of interest to declare.