

This paper investigates the development of efficiency and the progress of banking integration in the European Union by checking for convergence among banks of European and Eurozone countries as well as contrasting the results with those of United States banks.
Initially, we employ the two-stage semi-parametric double bootstrap DEA method, which absorbs the effects of possible integration barriers in the measurement of efficiency. Afterwards, we apply a panel data model, in order to investigate the process of banking integration by testing for convergence and for convergent clusters in banking efficiency.
Our main findings show that the bank efficiency of the US is considerably higher than that of the Eurozone and the European Union. Although there is no evidence of convergence across the banking groups, our results indicate the presence of club convergence. We also conclude that the US banking system is closer to convergence than the Eurozone and the European Union banks. Nevertheless, this outcome is subject to change in the future due to the fact that Eurozone and European Union banks' speed of convergence is higher than that of US banks.
Our survey is unique in trying to check for convergence while controlling for country-specific and bank-specific factors that affect the efficiency of European and Eurozone banks. Moreover, recent literature does not compare the convergence of efficiency of Eurozone, European and US banking. Finally, in our paper special consideration was given to the comparison of commercial, cooperative and savings banks, as subsets of our banking groups.
1. Introduction
Since its establishment, the European Union has progressively made a series of reforms in order to improve the integration of European financial markets [1]. The banking sector is one of the most important aspects not only of the financial markets, but also of the economy, as it is the main channel through which enterprises are financed. European integration is expected to contribute to a more efficient banking sector (European Central Bank, 2005). Thus, the banking industry has experienced profound changes and reforms aiming at fostering integration of banking services across the E.U. [2]. Nonetheless, European banking integration still confronts certain obstacles as European member-countries have different national characteristics and legal systems, which means that complete banking integration is not yet close to being achieved (Weill, 2009; Matousek et al., 2015; Kalemli-Ozcan et al., 2008; Stavárek et al., 2012).
Therefore, in order to draw accurate conclusions, we must consider the possible barriers (environmental variables) that determine to what degree integration of European banks can be expected. For the purposes of our survey we examine country-specific and bank-specific barriers. Country-specific variables refer to the diversity of national market characteristics. This category forms the main conditions under which banks of each country operate, and how they affect their efficiency level. It is also important to note that they cannot be controlled by the managers of the banking institutions. On that basis, we analyze and compare the efficiency of European banks while controlling for the environmental variables that affect the outcome by employing the two stage semi-parametric bootstrap model developed by Simar and Wilson (2007). Moreover, different types of banks do not follow the same efficiency pattern and therefore the bank-specific factors form barriers to banking integration that should be considered (Pasiouras et al., 2009; Stavarek, 2005; Casu and Molyneux, 2003; Carbó Valverde et al., 2007; Casu and Girardone, 2009). In order to control for bank-specific barriers hampering European Integration, we examine separately three subgroups of banks (cooperative, commercial and savings banks) of our sample.
Concerning the integration of the European banking sector, Altunbas and Chakravarty (1998) point out that “In the calculation for gains from European integration in the financial services, it is assumed that banks will become equally efficient between countries with the removal of cross-border restrictions”. Therefore, it is assumed that in a perfectly integrated European financial market, banks should be equally efficient regardless of their home-country. To reach this purpose, the convergence of efficiency across European banks is required. Thus, in our paper we describe the progress of integration in the banking market by trying to determine whether convergence in banking efficiency between European countries exists. We calculate European banking convergence by applying the methodology introduced by Phillips and Sul (2007). This methodology permits us to determine whether our sample is convergent and the speed of convergence overtime. It also enables us to investigate the existence of possible sub-groups of countries which are already convergent.
The introduction of the common currency (the euro) represents one of the most important steps towards monetary integration and this analysis aims at testing the hypothesis that an advanced level of financial integration is associated with higher convergence of efficiency in banking. Hence, our paper examines whether banking integration among the Eurozone countries has developed more than that of the total sum of European countries.
Additionally, we compare the evolution of efficiency and the progress of banking integration across Eurozone member countries with that of the United States. It is appropriate to compare US banking with Eurozone banking because not only have the member countries of both Unions the same currency and Monetary Policy, but also each country maintains its different economic structure and legal system. Moreover, the permission of interstate banking in the US is also recent, as until the 1990s, strict restrictions forbade the expansion of banking across different states (Johnson and Rice, 2007).
US banking is considered to be more integrated than banking among Eurozone countries. Gropp and Kashyap (2009) point out that: “the US banking market appears significantly more integrated than the banking market in the E.U.”.
For the above mentioned purposes we use a two-step approach:
Step 1: Estimation of the evolution of banking efficiency.
Step 2: Assessment of convergence in banking efficiency.
The rest of the study is organized as follows: Section 2 reviews the banking efficiency and convergence efficiency literature and Section 3 presents our research hypotheses. Section 4 presents the employed methodology. Section 5 describes the data and datasets used, Section 6 presents our empirical findings and section 7 summarizes our results and presents our conclusions.
2. Literature review
A great number of academic surveys address the issue of efficiency in European banking. The vast majority of those surveys is undertaken on a national level, while the number of cross-border studies is considerably lower. Regarding the cross-border investigations, the greatest part is focused on Western European countries and some of those studies compare the results with US banks. Most of these studies focus on the comparison of banking efficiency between countries (Kösedağ et al., 2011; Kolia and Papadopoulos, 2020b). In addition, recent surveys investigate how the European banking integration was affected by the global financial crisis of 2008.
There are only a few studies trying to control for the environmental factors which affect efficiency and none of the surveys tries to control for these factors in order to examine the convergence of bank efficiency. For instance, Casu and Molyneux (2003) apply a non-parametric D.E.A approach and a Tobit regression approach for European Union banks, throughout the period 1993–1997 and proved that the differences in the efficiency of the sample are mainly attributed mainly to country-specific factors. Kolia and Papadopoulos (2020a) investigate the relationship among capital, risk and efficiency in the Eurozone and the US banking systems and take into consideration environmental variables. Furthermore, Dietsch and Lozano-Vivas (2000) conduct a cross-country analysis of cost efficiency, between French and Spanish banks, in order to determine the effect of environmental factors on banking efficiency. They apply the distribution free approach (D.F.A.) and provide evidence that during the period 1988–1992 the difference between the two banking samples is limited when environmental variables are taken into account. Similarly, Carbó Valverde et al. (2007) compare the efficiency of 153 large European banks that operate in ten European Union countries during the period 1996–2002. Their results indicate that when environmental variables are controlled for, the efficiency scores of the reported banks are almost the same.
As regards the investigation of banking integration through convergence, some studies analyze the convergence of interest rates, productivity, capital flows, behavioral patterns and so on, as a measure of European integration (Fernández de Guevara et al., 2007; Rughoo and Sarantis, 2014; Gropp and Kashyap, 2009; Sander and Kleimeier, 2004; Centeno and Mello, 1999; Tziogkidis et al., 2020; Badircea et al., 2016).
Additionally, regarding the relation between efficiency and integration, in his paper Stavarek (2005) compares the efficiency of three banking groups of European countries, which are separated according to the involvement of these countries in the integration process, by applying D.E.A analysis. The author's main conclusion is that banking efficiency is connected with economic development and European Union integration. There are only a handful of studies which assess directly the issue of the convergence efficiency throughout European banking as a measure of integration and the reported results are mixed.
On the one hand, some papers conclude that there is no evidence of convergence in European banking. For instance, Matousek et al. (2015) investigate efficiency and convergence of the Eurozone and the EU15 during the period 2005–2012. The methodology applied is the parametric distance function approach (NPLs) which calculates efficiency, and the Phillips and Sul technique is used in order to calculate convergence. The results of the paper support the view that there is a decrease in efficiency during the reported period and that there is no evidence of convergence in the sample. Furthermore, they find evidence of club formation with weak convergence. Similarly, Centeno and Mello (1999) investigate the integration of the money market and the banking market of six European countries between 1985 and 1994, and they conclude that although the money market is integrated, banking is not.
Interestingly, many findings reported by other researchers indicate that there is convergence in European banking. For example, Casu and Girardone (2009) investigate the convergence of cost efficiency of European banks from 1997 until 2003. The methodology used is DEA, σ and β convergence and data in the EU-15 area and the results suggest the existence of convergence in the sample. Nevertheless, there is no evidence for the improvement of efficiency levels. Moreover, Weill (2009) surveys convergence of cost efficiency of 10 EU member countries from 1994 until 2005. He estimates cost efficiency of EU banks with the Stochastic Frontier Approach (S.F.A.) and analyses its evolution. Moreover, he uses β and σ convergence tests for panel data to show progress in convergence in cost efficiency between EU countries, followed by robustness checks. The main conclusions of this paper are the increase of efficiency through the reported period in all the EU countries and the existence of evidence of convergence in cost efficiency of these banks. As a result, the paper provides evidence in favor of the improvement of European banking integration from 1994 until 2005.
Many papers conclude that although European banking is not yet integrated, evidence exists in favor of its development. For example, Kösedağ et al. (2011) conduct a cross-border analysis testing for convergence in European banking efficiency from 1990 until 2003. The methodology applied is data envelopment analysis (D.E.A.). The results indicate that efficiency of European banking has increased during the reported period and is more convergent than global banking, but even in this group convergence is at an infant stage. Moreover, Bos and Schmiedel (2007) investigate the efficiency of 5,000 European Union commercial banks through the period 1993–2004 in order to check for the existence of integration in the Single Market. The authors employ a meta-frontier approach in order to fairly compare the efficiency of the banks of different countries, and they find evidence in favor of improvement of the integration of European banking, although the efficiency scores vary across the sample. Furthermore, a test for the convergence of efficiency and the risk of Eurozone commercial, cooperative and savings banks over the period 1999–2012 is undertaken by Wild (2016). The results show that although Eurozone banking is not yet integrated, there is convergence of efficiency when the ratio of equity to total assets is used as to control for risk.
Furthermore, Andrieş and Ursu (2016) point out that the impact of financial crisis as is a barrier for banking integration, explaining that an increase of convergence in banking efficiency was observed until 2008 and then, the convergence among bank efficiency worsen again.
Concerning the different methodologies used for the studies, the following table (Table 1) shows that a vast number of the related literature uses Data Envelopment Analysis (DEA) in order to calculate efficiency and β and σ convergence tests to measure integration, while the use of the panel data model of Phillips and Sul is considerably limited. The Data Envelopment Analysis is a vastly employed methodology, which is also applied in multiple recent papers (Abidin et al., 2020; Davidovic et al., 2019; Erdem Demirtaş and Fidan Keçeci, 2020; Fukuyama and Matousek, 2017; Grmanová and Ivanová, 2018; Henriques et al., 2018, etc.).
Relevant literature
| References | Reported period | Subject of research | Methodology to estimate efficiency | Methodology to estimate integration |
|---|---|---|---|---|
| Abidin et al. (2020) | 2017–2018 | Efficiency | DEA, Tobit regression model, Mann–Whitney test | – |
| Alexandrou et al. (2011) | 1990–2005 | Volatility spillovers for bank stock returns | – | Garch models |
| Altunbaş and Chakravarty (1998) | 1988–1995 | Inefficiency | Mean, variance, skewness, gimi coefficient, Theil index | – |
| Badircea et al. (2016) | 2000–2004 | Banking assets flows through Europe | – | Simple linear regression |
| Bos and Schmiedel (2007) | 1993–2004 | Efficiency | SFA | – |
| Carbó Valverde et al. (2007) | 1996–2002 | Cost efficiency | Distribution free approach (DFA) | – |
| Casu and Girardone (2009) | 1997–2003 | Cost efficiency | DEA | β and σ convergence measures |
| Casu and Molyneux (2003) | 1993–1997 | Efficiency | DEA | Tobit regression and bootstrapping |
| Centeno and Mello (1999) | 1985–1994 | Interest rates and bank lending rates | – | The Augmented Dickey Fuller (ADF), the Phillip Perron (PP), and the Kwiatkowski et al. (KPSS) tests |
| Davidovic et al. (2019) | 2006–2015 | Efficiency | DEA | – |
| Dietsch and Lozano-Vivas (2000) | 1988–1992 | Cost efficiency | DFA | – |
| Erdem Demirtaş and Fidan Keçeci (2020) | 2013–2016 | Efficiency of private pension companies | Dynamic DEA and traditional DEA | – |
| Fernández de Guevara et al. (2007) | 1993–2001 | Interest rates | – | σ convergence |
| Fukuyama and Matousek (2017) | 2000–2013 | Banks' network revenue performance | DEA, Simar and Wilson model, Nerlove's revenue inefficiency model | – |
| Grmanová and Ivanová (2018) | 2009, 2013 | Efficiency | DEA | – |
| Henriques et al. (2018) | 2012–2016 | Efficiency | DEA | – |
| Ilut and Chirlesan (2012) | 2002–2010 | Efficiency | DEA, VRS model | – |
| Kösedağ et al. (2011) | 1990–2003 | Efficiency | DEA | – |
| Mamatzakis et al. (2008) | 1998–2003 | Cost and profit efficiency | SFA | β and σ convergence measures |
| Matousek et al. (2015) | 2005–2012 | Cost efficiency | Parametric distance function approach (NPLs) | Phillips and Sul methodology |
| Pastor et al. (1997) | 1992 | Efficiency | DEA | – |
| Rughoo and Sarantis (2014) | 2003–2011 | Deposit and lending rates | – | Phillips and Sul methodology |
| Sander and Kleimeier (2004) | 2000–2002 | Interest rates | – | β and σ convergence measures |
| S,argu and Roman (2012) | 2003–2010 | Efficiency | DEA | – |
| Stavarek (2005) | 2002–2003 | Efficiency | Data envelopment analysis (DEA), CCR model and BCC model | – |
| Weill (2009) | 1994–2005 | Cost efficiency | Stochastic frontier approach (SFA) | β and σ convergence tests |
| Zhang and Matthews (2012) | 1992–2007 | Cost efficiency | DEA | β and σ convergence measures |
This paper provides various contributions to the ongoing empirical literature. Firstly, our survey is unique in trying to check for convergence while controlling for country-specific and bank-specific factors that affect the efficiency of European and Eurozone banks. Secondly, although much of the literature focuses on the convergence of efficiency of European banking, none compares the convergence of efficiency of Eurozone, European and American banking. The majority of studies cover the banks of all European Union countries (Carbó Valverde et al., 2007) or EU-15 countries (Casu and Girardone, 2009; Matousek et al., 2015) or other combinations of European countries (Centeno and Mello, 1999). Thirdly, in our paper unlike any previous papers special consideration was given to the comparison of commercial, cooperative and savings banks, as subsets of our banking groups. Last but not least, we should mention that the recent research on European banking efficiency (2013-onwards) is very limited.
3. Research hypotheses
In this study we investigate the progress of integration in the European banking market by showing how convergence in banking efficiency has improved during the reported period. More specifically, we test the following four hypotheses:
The European, Eurozone and United States banking systems are integrated.
We describe the progress of integration by showing whether convergence in banking efficiency exists, in each union separately. Initially, we employ the dynamic panel convergence methodology of Phillips and Sul (2007) [3] in order to test for convergence. In this stage of our analysis, we equally consider each bank regardless of its assets. Then, in the case where we find no evidence of convergence in the unions, we apply the clustering algorithm of Phillips and Sul (2007) and we examine if there are subgroups of banks which are convergent. Subsequently, we also check for convergence by using the asset-weighted efficiency of each country as calculated in the previous section, and we apply the clustering algorithm in order to investigate if there are subgroups of countries whose banks are convergent in the same clusters.
The efficiency of Eurozone banks is more convergent than that of European Union banks.
This analysis aims at testing the hypothesis that an advanced level of financial integration is associated with higher convergence of efficiency in banking. The introduction of a common currency is considered as one of the most important steps towards monetary integration and, hence, this study examines whether banking integration among Eurozone countries has developed more than that of the total sum of European countries. For this purpose, we compare the speed of convergence of both groups and the results of the above mentioned convergence analysis of European and Eurozone banking.
The integration of Eurozone banks of the same type is more developed than the integration of a general sample of banks.
In order to control for bank-specific barriers of European integration, we create three subgroups of Eurozone banking (commercial, cooperative and savings banks), and we repeat the above mentioned steps inquiring whether Eurozone banks operating in the same category are more integrated than the total sum of them.
The samples of United States banks and its subgroups are more integrated than those of Eurozone banks.
In this stage, we compare the evolution of efficiency and the progress of banking integration across Eurozone member countries with that of the United States and of their subgroups (commercial, cooperative and savings banks).
4. Research methodology and data
4.1 Estimation of banking efficiency
4.1.1 Estimation of D.E.A results
While trying to draw accurate inferences about the impact of European Integration on banking efficiency, initially, we measure efficiency and make a comparison between the reported countries while controlling for environmental variables that affect the outcome.
The efficiency of a banking institution can be calculated as the radial distance of its efficiency to a frontier. In this research field, there is a vast and growing literature which is divided into two categories: non-parametric analysis, for instance Data Envelopment Analysis (D.E.A.), and parametric analysis, for example Stochastic Frontier Approach (S.F.A.).
In our study, we apply the well-established D.E.A. methodology, which was developed by Charnes et al. (1978) and measures efficiency by evaluating the ability of a Decision Making Unit (D.M.U.) to utilize multiple inputs in order to produce various outputs. Charnes et al. (1978) state that: “Our proposed measure of efficiency of any D.M.U. is obtained as the maximum of a ratio of weighted outputs to weighted inputs subject to the condition that the similar ratios for every D.M.U. be less than or equal to unity.” Moreover, D.E.A. does not provide absolute results, it generates relative results. To be more precise, the outcome is adjusted depending on the decision making units that are included in the sample (Stavarek, 2004).
The use of D.E.A. gives us the opportunity to compare banking systems of different sizes. This is of great importance for our survey because there is a great variety of sizes in the sample. Furthermore, another essential advantage of the use of D.E.A is that it can be applied even in small groups of financial institutions.
The C.C.R. model, applied in our survey, is developed by Charnes et al. (1978) and combines a number of inputs and outputs, in order to create a ratio of their weighted sums. Concerning its characteristics, it is an input-oriented model that is based on convex structure, constant returns to scale and radial distance. The choice of an input-oriented model is based on the fact that in periods during and following financial crises, firms focus on reducing expenses. Moreover, the management of a D.M.U controls more effectively the inputs than the outputs.
Furthermore, there are two techniques in modeling bank efficiency; the production approach and the intermediation approach. On the one hand, in the production approach financial institutions use physical assets, for instance labor and capital, in order to produce deposits and loans. On the other hand, in the intermediation approach they generate loans from deposits and physical assets. The appropriate variable categorization of inputs and outputs is of great importance as it can provide completely different results of relative efficiency. In our survey, as suggested by Berger and Humphrey (1997), we adopt the intermediation approach which was developed by Sealey and Lindley (1977) and also adopted by Casu and Girardone (2009) and Abidin et al. (2020). More specifically, Berger and Humphrey (1997) examine a vast number of papers studying banking efficiency and they recommend the use of intermediation approach to measure bank efficiency.
For our analysis, following Stavarek (2005) and Sargu and Roman (2012), we have selected three inputs (labor, capital, and deposits) and two outputs (loans and net interest income). More specifically, concerning inputs, “labor” is defined as the total expenses of staff, “capital” is defined as the book value of the fixed assets (property, plant and equipment) and the variable “deposits” depicts the sum of time and demand deposits. Referring to outputs, “loans” refers to the sum of net loans and advances to banks and net loans and advances to customers while “net interest income” is the difference between interest incomes and interest expenses.
4.1.2 Estimation of two-stage semi-parametric double bootstrap DEA
Current DEA analysis includes bootstrapping of efficiency results, in order to generate bias corrected efficiency scores, or take into consideration the effects of environmental variables on efficiency. For instance, Simar and Wilson (2007), provide an alternative to the conventional D.E.A. approach by performing a two-stage semi-parametric bootstrap method which absorbs the effects of environmental variables in the measurement of efficiency. They apply a coherent Data- Generating Process (DGP). They use the single or double bootstrap procedures and test the statistical performance of their model by performing Monte Carlo experiments. This analysis overcomes the problem of a biased estimation (leaving out of the sample 0 or using log0 etc.) and of the serial correlation of DEA efficiency estimates. Their purpose was to estimate efficiency while controlling for external factors that affect the efficiency of the banks but cannot be influenced by their managers. These barriers explain to what extent integration can be accomplished and, therefore, must be seriously considered in the evaluation of the integration progress. In our survey, we apply the methodology of Simar and Wilson (2007), more specifically the algorithm 2 of the two-stage semi-parametric double bootstrapping method [4].
In the first stage of our analysis, we employ D.E.A. to calculate the relative efficiency scores ρj. Then, we apply the methodology of Simar and Wilson (2007) to bootstrap D.E.A. results with a truncated bootstrap regression. For this purpose we use the maximum likehood method in order to regress the efficiency estimates on a set of environmental variables zj and Equation 1 is the model to be estimated.
where : D.E.A. efficiency estimates, : we use only > 1 in this step, = , : a vector of environmental variables for the jth bank, β: a vector of parametres associated with each factor to be estimated, : is a truncated random error , truncated at .
The methodology can be summarized as follows:
Step 1: Use the methodology of maximum likehood method in order to estimate of β and of σε, in the truncated regression of on .
Step 2: Repeat the next 4 steps times to obtain a set of bootstrap estimates βj = :
Step 2.1: Estimate εj from the distribution with left-truncation at , for each i = 1, ….,m.
Step 2.2: Compute , for each i = 1, ….,m.
Step 2.3: Set , for all i = 1, ….n.
Step 2.4: Calculate , …., n (where * is estimated by replacing (x,y) in D.E.A. analysis with
Step 3: Calculate the bias-corrected estimator – BIAS() by using the D.E.A. estimates obtained in the previous step and the original estimate .
Step 4: Use the methodology of maximum likehood method in order to estimate the truncated regression of on , yielding estimates
Step 5: Repeat the next 3 steps L2 times to obtain a set of bootstrap estimates :
Step 5.1: Estimate from the distribution with left-truncation at , for each i = 1, …., n
Step 5.2: Compute , for each i = 1, …., n.
Step 5.3: Use the methodology of maximum likehood method in order to estimate the truncated regression of on zj yielding estimates .
Step 6: Construct the estimated confidence intervals by using the bootstrap results.
The variables L1 and L2 refer to the number of replications in the first and the second bootstrap respectively. According to Simar and Wilson (2007) 100 replications are sufficient, while Hall (1986) suggests the use of at least 1,000 replications. In our survey, 100 replications are used in the first bootstrap while 2000 are used in the second one.
4.2 Assessment of convergence in banking efficiency
As banking is a multi-product business, it is quite complex to describe its integration. One way to describe the progress of integration in the European banking market is to show how convergence in banking efficiency for European countries has improved. For this purpose we rely on the dynamic panel method introduced by Phillips and Sul (2007) [5]. This technique is a nonlinear factor model with a growth component and a time varying idiosyncratic component that allows for quite general heterogeneity across individuals and over time. The analysis consists of a long t-regression test of convergence which “represents the behavior of economies in transition, allowing for a wide range of possible time paths and individual heterogeneity …. . a new method of clustering panels into club convergence groups is constructed.” (Phillips and Sul, 2007).
The applied model has significant advantages over the most commonly used methods, σ-convergence and β-convergence (Matousek et al., 2015). More specifically, β and σ convergence do not provide information about the speed of the convergence process over the reported period, whereas the methodology of Phillips and Sul (2007) permits the calculation of each country's relative transition parameters and compares it to the panel average, giving us evidences about the speed of convergence. Moreover, the employed methodology is capable of not only identifying if our sample is convergent, but also if the convergent sub-clusters exist in our sample.
To apply Phillips and Sul dynamic panel data method we need to perform three steps, while for the club convergence algorithm four more steps are necessary. More specifically:
Concerning the methodology, Phillips and Sul use the relative transition coefficients and propose a regression-based long t-test. The hypotheses of convergence are as follows:
H0: δi = δ and a ≥ 0
H1: δi ≠ δ for all I and a<0
The three steps required for this methodology are the following:
Step 1: Calculation of the cross sectional variance :
Step 2: Perform OLS regression:
where:
log t: the fitted coefficicnet of log t is = 2, : the estimate of a in H0, t: the data for the regression starts at t = r*T, with some r > 0
Step 3: Use and a standard estimation error to perform a one-sided t-test of null a ≥ 0. The standard estimation error is calculated using a heteroskedasticity and autocorrelation consistent (HAC) estimator. The t-statistic is normally distributed and the null hypothesis is rejected when t-statistic < −1.65.
4.3 Assessment of convergent clusters in banking efficiency
The rejection of the null hypothesis does not necessarily mean that there is no sub-group convergence within the panel. The club convergence algorithm developed by Phillips and Sul (2007) provides the opportunity to determine whether convergent clusters in the reported sample exist. The four steps of the algorithm are listed below:
Step 1: The series (Xit) in the panel are ordered according to the last observation (XiT).
Step 2: A core group which includes the first k highest panel members is created in order to form the subgroup Gk for some N > k ≥ 2, and the convergence test statistic t(k) is estimated for each k. The size of the core group is selected by maximizing the t(k) under which min t(k) > −1.65.
Step 3: Once the core group is created, each remaining bank of the sample is added to the group and the log t-test is repeated. A chosen critical value, c, is the criterion under which a bank is included in the current subgroup to form a new group. If the corresponding test statistic t is greater than c and if t > −1.65, the subgroup is created. If these pre-requisites are not fulfilled, the value of the variable c is increased and the model is repeated.
Step 4: The log t-test is repeated for the rest of the banks, which have not been selected in the previous step, and if the null hypothesis is verified, a second club is created. In the case of rejection, the previous three steps are repeated for the remaining banks. In the case where no other groups can be created we can conclude that the remaining countries are not convergent in any sample.
4.4 Data
Our data sample consists of aggregate balance sheet and income statement data from 2,369 banks. The sample is divided into two parts; European and American banks. The types of banks used are commercial, cooperative, investment, savings, real estate and mortgage banks. The subgroups of banks that are separately investigated are commercial, cooperative and savings banks and they are chosen as they constitute the largest types of banking institutions in both economic unions (Figure 1).
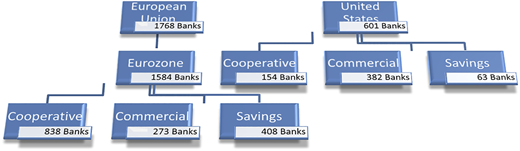
Regarding the group of European Union banks (Table 2), it includes the countries which have achieved the final stage of financial integration and are members of the European Economic Monetary Union [6] (Eurozone), as well as the countries which are not members of the Monetary Union [7]. This sample comprises of 1,768 banks. The subgroup of European Union banks which is the Eurozone banks is separately investigated for the purposes of our survey and includes 1,584 banks. Our sample also includes 601 United States banks.
The data sample per country
| Country | Number of banks |
|---|---|
| Austria | 104 |
| Belgium | 12 |
| Bulgaria | 13 |
| Croatia | 21 |
| Cyprus | 9 |
| Czech Republic | 18 |
| Denmark | 18 |
| Estonia | 6 |
| Finland | 12 |
| France | 141 |
| Germany | 865 |
| Greece | 6 |
| Hungary | 13 |
| Ireland | 4 |
| Italy | 311 |
| Latvia | 9 |
| Lithuania | 5 |
| Luxembourg | 17 |
| Malta | 4 |
| Netherlands | 8 |
| Poland | 45 |
| Portugal | 16 |
| Romania | 16 |
| Slovakia | 9 |
| Slovenia | 7 |
| Spain | 38 |
| Sweden | 9 |
| United Kingdom | 32 |
| European Union | 1,768 |
| Eurozone | 1,584 |
| United States | 601 |
The reported period is 2013–2018 and was chosen for two reasons:
The studies on the European banking integration using recent data are limited and the comparison of integration of efficiency between European banks and American banks are even more limited for this period.
The article provides an analysis of the European banking system 1 decade after the implementation of the Financial Services Action Plan (FSAP), which is considered as the most important recent step towards integration, as it removed the majority of legal obstacles towards the liberalization of the financial market and the integration of European banks [8].
5. Empirical results
5.1 Efficiency estimation
This section presents the results of the D.E.A. efficiency analysis, which have been calculated by using two models, as they are described in the second part of our survey. More specifically:
Model 1: We perform the estimation of D.E.A efficiency by using three inputs (labor, capital, and deposits) and two outputs (loans and net interest income).
Model 2: We estimate the bias corrected efficiency of the results of model 1 by considering the environmental variables and by applying the two-stage semi-parametric bootstrap method of Simar and Wilson (2007).
Initially, we calculate D.E.A. efficiency scores of European banks. We also separately estimate the scores of each bank, set up in the Eurozone and in the United States. The descriptive statistics of the yearly DEA results for each model, spilt by the individual estimation periods, are presented in the following table.
In Table 2, we can observe that the standard deviations of the European and Eurozone banking in model 1 are significantly higher than those of model 2, that is more than 30%. Considering the fact that model 2 is an expansion of model 1, which also controls for environmental variables that affect the efficiency of banking institutions, this outcome illustrates that in the reported groups the efficiency of banks is highly affected by environmental variables. Therefore, our results confirm the necessity for controlling exogenous factors in our study. Nevertheless, concerning the United States, we should mention that model 1 has been applied in order to calculate the DEA efficiency results as the environmental variables which are used in model 2 of our survey remain the same among US banks. Figures 2 and 3 illustrate the mean efficiency of Eurozone banking and United States banking and of their subgroups.
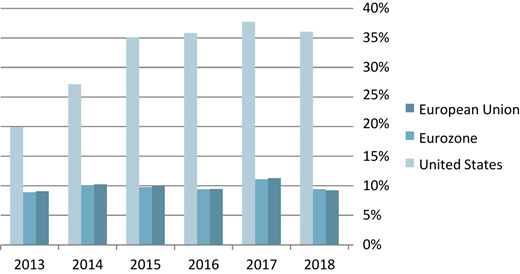
As regards the sample that includes all banks (commercial, cooperative, investment, savings, real estate and mortgage banks) our findings seem to suggest that the efficiency of the United States banking system is considerably higher, that is more than double, than that of Eurozone and the European Union banks (Figure 2). Our findings are in line with those of Weigand (2016) who compares the banking systems of the United States, the European Union and Japan. The author provides evidence that US commercial banks outperform those of the other two unions during the period 2014–2015. It is also interesting to note that, throughout the reported period, the efficiency of United States banks increased about 80%, while that of Eurozone and European Union banks is quiet steady. This outcome could be explained as (1) the recovery of the United States from the financial crisis of 2008 is faster than that of the European Union (Kollmann et al., 2016, 2017), (2). the after-crisis regulatory framework implemented in the United States is more flexible than that of the Eurozone (Lakhani et al., 2019) and (3) different interest rates policies are employed by the Federal Reserve Bank and the European Central Bank (McLannahan and Arnold, 2017). Finally, we notice that the efficiency of the European Union banking group is slightly increased, when compared to Eurozone banks. One explanation could be that the Eurozone banks (Irish, Italian, Spanish and Greek banks) have the highest rates of non-performing loans in the European Union (Binham and Noonan, 2015).
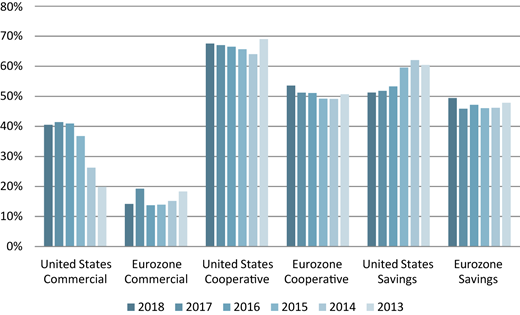
In the next stage of our analysis, we calculate D.E.A. efficiency results separately for the banks that are cooperative, commercial and savings. In order to observe the differences among the analyzed groups, we depict the results in Figure 3. We notice that the efficiency of all Eurozone banking sectors is considerably lower than that of the United States. Moreover, the charts illustrate that the efficiency of cooperative banks is the highest reported in both the Eurozone and the United Stated and that the efficiency of commercial banks is the lowest reported. This outcome is in line with Spulbar et al. (2015) who conclude that cooperative and savings banks manage their costs more efficiently than commercial banks.
5.2 Convergence of efficiency
In this section we compare the evolution of efficiency and the progress of banking integration across Eurozone member countries with that of the United States and their subgroups (cooperative, commercial and savings banks).
Initially, we determine whether there is convergence of efficiency in European banking over the period 2013–2018 by describing the evolution convergence, and contrasting the results of European banking with those of Eurozone countries. Moreover, we compare the development of the convergence in efficiency of European banks with that of the United States banks so as to assess which of the unions is more integrated. Finally, we follow the same pattern in order to compare the convergence of the different types of Eurozone banks with those of the United States banks. In the following table (Table 4), we report the results of the test for convergence.
Convergence of efficiency
| Coefficient | t-statistics | |
|---|---|---|
| European Union | −1.6748 | −54.1004* |
| Eurozone | −1.6695 | −50.6722* |
| Commercial | −1.5136 | −24.5433* |
| Cooperative | −1.6896 | −62.3616* |
| Savings | −2.1759 | −72.0216* |
| United States | −2.3548 | −19.5428* |
| Commercial | −2.1795 | −10.0094* |
| Cooperative | −1.5185 | −102.129* |
| Savings | −1.0879 | −29.1054* |
Note(s): 1. Phillips and Sul (2007) convergence methodology was applied by using the model introduced by Du (2018) on Stata statistical software. 2. * indicates the rejection of the null hypothesis of convergence at the 5% significance level
When the t-statistics, obtained from the convergence test, are less than −1.65 the null hypothesis of convergence is rejected. Our results, as reported in Table 3, show that the hypothesis of convergence is rejected. Moreover, the convergence test is applied to the subgroups of the United States and the Eurozone commercial, cooperative and savings banks, and the null hypothesis is also rejected. Therefore, based on our results, we can conclude that there is no evidence of convergence across the banking sectors of the European Union, the Eurozone and the United States. Among the several studies that investigate the integration of European banking by using efficiency as an indicator, many authors reach the same conclusion, for instance Centeno and Mello (1999) and Matousek et al. (2015) and Goddard et al. (2007). Factors that can explain the absence of banking integration are the existence of differences in the legal and fiscal systems of each country as well as the existence of different economic conditions, language and culture (Goddard et al., 2007). Our findings, however, seem to contradict those of Casu and Girardone (2009) and Weill (2009) who indicate that there is convergence in European banking.
Descriptive statistics of DEA efficiency scores – general sample
| Mean (%) | Median (%) | SD (%) | Min (%) | Max (%) | ||
|---|---|---|---|---|---|---|
| European Union | ||||||
| Model 1 | 2018 | 10.57 | 8.62 | 10.21 | 0.00 | 100.00 |
| 2017 | 12.77 | 10.90 | 9.83 | 0.00 | 100.00 | |
| 2016 | 10.78 | 8.98 | 9.65 | 0.06 | 100.00 | |
| 2015 | 11.27 | 9.27 | 9.78 | 0.05 | 100.00 | |
| 2014 | 11.50 | 9.60 | 9.55 | 0.09 | 100.00 | |
| 2013 | 10.05 | 8.35 | 8.87 | 0.22 | 100.00 | |
| Model 2 | 2018 | 9.23 | 7.94 | 6.94 | 0.00 | 83.42 |
| 2017 | 11.29 | 10.23 | 7.15 | 0.00 | 85.90 | |
| 2016 | 9.46 | 8.43 | 6.48 | 0.04 | 79.71 | |
| 2015 | 9.92 | 8.71 | 6.72 | 0.03 | 81.27 | |
| 2014 | 10.22 | 9.02 | 6.52 | 0.06 | 76.89 | |
| 2013 | 9.08 | 7.80 | 11.82 | 0.16 | 432.20 | |
| Eurozone | ||||||
| Model 1 | 2018 | 10.61 | 8.66 | 9.93 | 0.01 | 100.00 |
| 2017 | 13.18 | 11.58 | 9.59 | 0.00 | 100.00 | |
| 2016 | 10.67 | 8.98 | 9.51 | 0.08 | 100.00 | |
| 2015 | 11.11 | 9.22 | 9.66 | 0.05 | 100.00 | |
| 2014 | 11.31 | 9.56 | 9.45 | 0.09 | 100.00 | |
| 2013 | 9.94 | 8.30 | 8.96 | 0.22 | 100.00 | |
| Model 2 | 2018 | 9.41 | 8.00 | 6.89 | 0.00 | 84.04 |
| 2017 | 11.09 | 10.54 | 10.52 | 0.00 | 80.93 | |
| 2016 | 9.39 | 8.43 | 6.38 | 0.05 | 79.45 | |
| 2015 | 9.75 | 8.65 | 6.52 | 0.03 | 80.96 | |
| 2014 | 10.05 | 8.98 | 6.36 | 0.06 | 76.89 | |
| 2013 | 8.89 | 7.71 | 9.28 | 0.16 | 283.61 | |
| United States | ||||||
| Model 1 | 2018 | 36.04 | 31.84 | 15.58 | 1.61 | 100.00 |
| 2017 | 37.71 | 34.07 | 15.46 | 0.00 | 100.00 | |
| 2016 | 35.83 | 31.84 | 15.71 | 3.06 | 100.00 | |
| 2015 | 35.12 | 32.21 | 15.46 | 3.28 | 100.00 | |
| 2014 | 27.16 | 24.62 | 14.06 | 1.25 | 100.00 | |
| 2013 | 19.94 | 17.04 | 13.64 | 0.84 | 100.00 | |
Note(s): (1) The D.E.A. efficiency results of model 1 are generated using “rDEA” package version 4.47 in R software developed by Simm and Besstremyannaya (2016). (2) The dea efficiency results of model 2 are generated using the methodology of Simar and Wilson (2007), more specifically the algorithm 2 of the two-stage semi-parametric double bootstrapping method. (3) The size of confidence interval for the bias-corrected DEA score is 0.05
Nevertheless, we should mention that the t-statistics of the United States is higher than those of the Eurozone and the European Union, which has the lowest value. The larger the t-statistics are the closer to convergence the banking group is. Therefore, it is reasonable to conclude that banking integration among United States has not yet been achieved, but it is slightly more developed than that of European banks and Eurozone banks. This outcome could be explained as United States banks were rapidly recapitalized after the global financial crisis (Tziogkidis et al., 2020), whereas this did not happen in the Eurozone (Jenkins, 2015), thus Eurozone banks were differently affected by the global financial crisis depending, among other factors, on their different needs of bank capital.
Moreover, we find that the indicator of convergence of Eurozone banks is slightly higher than that of European Union banks. However, the difference is so slight that it cannot help us to draw valid conclusions and we cannot determine which banking system is closer to convergence. Hence, our results cannot confirm those of Alexandrou et al. (2011) and Andrieş and Căpraru (2012) who conclude that the introduction of the common currency has contributed to the enhancement of European banking integration.
Furthermore, we may notice that commercial and savings banks in the United States are closer to convergence than those in Eurozone. However, as regards the cooperative banks the outcome is different. The t-statistic of cooperative banks of the Eurozone is higher than that of the United States cooperative banks. Furthermore, the commercial banking sector is closer to convergence than savings banks, and the least convergent banking group is that of the cooperative banks.
In addition, the convergence test provides information for the speed of convergence. More specifically, the higher the value of the coefficient is, the faster the rate of convergence. Table 3 illustrates that Eurozone banks have the highest speed as the variable coefficient is the highest among the banking groups examined. Moreover, the value of the coefficient of European Union banks is also higher than that of the rest of the banking groups and almost the same as that of Eurozone banks. Interestingly, the convergence progress of the Eurozone is faster than that of its three subgroups, while the speed of convergence of US banks is lower than that of its subgroups, and the lowest recorded. Finally, we observe that United States savings and cooperative banks exhibit higher speed of convergence than Eurozone cooperative and savings banks.
The absence of convergence in the reported groups could be attributed to some divergent members of the sample. Thus, it is essential not to reject the existence of convergence before we investigate whether there are clusters of banks in our sample for which convergence exists and whether there are divergent members of the sample (Matousek et al., 2015; Rughoo and Sarantis, 2012). For this purpose, we apply the Phillips and Sul (2007) clustering algorithm test, in order to investigate whether convergence between clusters of banks exists. The algorithm creates the clusters which are convergent and its results for European Union banks are reported in Table 5.
Convergent clusters
| European Union | Club 1 | Club 2 | Club 3 | Club 4 | Club 5 | Club 6 | Club 7 |
|---|---|---|---|---|---|---|---|
| Coefficient | −0.243 | −0.008 | −0.197 | 0.064 | −0.061 | −0.176 | 0.179 |
| T-statistics | −0.287 | −0.05 | −1.571 | 0.535 | −0.489 | −1.438 | 4.249 |
| Number of banks | 54 | 172 | 488 | 517 | 394 | 107 | 25 |
| % of total banks | 3.07% | 9.79% | 27.77% | 29.43% | 22.42% | 6.09% | 1.42% |
| Eurozone | Club 1 | Club 2 | Club 3 | Club 4 | Club 5 | Club 6 | Club 7 | Club 8 | Club 9 | Club 10 |
|---|---|---|---|---|---|---|---|---|---|---|
| Coefficient | −0.055 | 0.824 | 1.206 | 1.394 | 0.591 | 1.003 | −0.044 | 6.229 | 0.937 | 1.515 |
| T-statistics | −0.184 | 8.778 | 10.322 | 10.824 | 6.78 | 10.835 | −1.099 | 2.763 | 9.931 | 5.545 |
| Number of banks | 156 | 128 | 266 | 280 | 404 | 217 | 94 | 2 | 23 | 5 |
| % of total banks | 9.90% | 8.13% | 16.89% | 17.78% | 25.65% | 13.78% | 5.97% | 0.13% | 1.46% | 0.32% |
| Eurozone commercial | Club 1 | Club 2 | Club 3 | Club 4 |
|---|---|---|---|---|
| Coefficient | −0.316 | 0.924 | 0.242 | −0.135 |
| T-statistics | −1.117 | 7.062 | 2.836 | −0.401 |
| Number of banks | 176 | 34 | 44 | 17 |
| % of total banks | 64.94% | 12.55% | 16.24% | 6.27% |
| Eurozone cooperative | Club 1 | Club 2 | Club 3 | Club 4 | Club 5 | Club 6 | Club 7 | Club 8 |
|---|---|---|---|---|---|---|---|---|
| Coefficient | 0.172 | 0.932 | −0.179 | −0.044 | 0.421 | 0.856 | 4.939 | −2.444 |
| T-statistics | 2.442 | 8.219 | −1.338 | −0.605 | 6.748 | 6.482 | 3.02 | − 79.202 |
| Number of banks | 99 | 73 | 236 | 290 | 114 | 15 | 2 | 3 |
| % of total banks | 11.90% | 8.77% | 28.37% | 34.86% | 13.70% | 1.80% | 0.24% | 0.36% |
| Eurozone savings | Club 1 | Club 2 | Club 3 | Club 4 | Club 5 | Club 6 | Club 7 | Club 8 |
|---|---|---|---|---|---|---|---|---|
| Coefficient | 1.016 | 0.03 | −0.214 | −0.081 | 0.101 | 0.052 | 0.014 | 0.476 |
| T-statistics | 4.704 | 0.123 | −1.616 | −0.592 | 0.539 | 0.303 | 0.12 | 8.563 |
| Number of banks | 8 | 24 | 90 | 134 | 79 | 28 | 34 | 11 |
| % of total banks | 1.96% | 5.88% | 22.06% | 32.84% | 19.36% | 6.86% | 8.33% | 2.70% |
| United States | Club 1 | Club 2 | Club 3 | Club 4 | Club 5 | Club 6 | Club 7 | Club 8 | Club 9 | Club 10 | Club 11 | Club 12 |
|---|---|---|---|---|---|---|---|---|---|---|---|---|
| Coefficient | −4.103 | −0.228 | −1.415 | 0.418 | −0.055 | −0.091 | −0.093 | 1.095 | −0.128 | 0.741 | 1.6 | −2.485 |
| T-statistics | −1.039 | −0.256 | −24.699 | 1.619 | −0.416 | −0.241 | −1.118 | 4.256 | −1.619 | 4.796 | 0.577 | −404.408 |
| Number of banks | 6 | 3 | 3 | 3 | 19 | 62 | 121 | 153 | 165 | 44 | 4 | 4 |
| % of total banks | 1.02% | 0.51% | 0.51% | 0.51% | 3.24% | 10.56% | 20.61% | 26.06% | 28.11% | 7.50% | 0.68% | 0.68% |
| United States commercial | Club 1 | Club 2 | Club 3 | Club 4 | Club 5 | Club 6 | Club 7 | Club 8 |
|---|---|---|---|---|---|---|---|---|
| Coefficient | −0.152 | −1.415 | −0.061 | −0.153 | −0.574 | 0.059 | 1.506 | −2.9200 |
| T-statistics | −0.16 | −24.699 | −0.295 | −1.235 | −1.575 | 0.165 | 4.655 | −689.512 |
| Number of banks | 2 | 3 | 24 | 61 | 206 | 65 | 7 | 2 |
| % of total banks | 0.54% | 0.81% | 6.49% | 16.49% | 55.68% | 17.57% | 1.89% | 0.54% |
| United States cooperative | Club 1 | Club 2 | Club 3 | Club 4 | Club 5 | Club 6 | Club 7 | Club 8 | Club 9 |
|---|---|---|---|---|---|---|---|---|---|
| Coefficient | 4.405 | −1.415 | −0.114 | 0.042 | 0.196 | 0.642 | 0.788 | 0.493 | −2.62 |
| T-statistics | 1.123 | −24.699 | −0.621 | 0.557 | 3.163 | 8.432 | 9.502 | 2.037 | −155.574 |
| Number of banks | 2 | 6 | 9 | 11 | 39 | 38 | 26 | 20 | 3 |
| % of total banks | 1.30% | 3.90% | 5.84% | 7.14% | 25.32% | 24.68% | 16.88% | 12.99% | 1.95% |
| United States savings | Club 1 | Club 2 | Club 3 | Club 4 | Club 5 | Club 6 | Club 7 | Club 8 | Club 9 | Club 10 |
|---|---|---|---|---|---|---|---|---|---|---|
| Coefficient | −1.415 | 0.013 | −0.025 | 0.046 | 0.178 | 2.37 | 0.59 | 0.255 | 1.574 | −6.599 |
| T-statistics | −24.699 | 0.073 | −0.808 | 0.367 | 2.857 | 14.198 | 10.651 | 2.7 | 5.065 | −2.794 |
| Number of banks | 3 | 5 | 13 | 7 | 12 | 4 | 5 | 5 | 4 | 3 |
| % of total banks | 4.92% | 8.20% | 21.31% | 11.48% | 19.67% | 6.56% | 8.20% | 8.20% | 6.56% | 4.92% |
Note(s): The results are generated using the methodology of Simar and Wilson (2007), more specifically the clustering algorithm
Our findings indicate the presence of club convergence in all the reported groups. More specifically, our results suggest that European banks may be divided into 6 different clusters which are convergent, while only 25 banks cannot be included in any cluster, comprising only 1.4% of the total number of banks. It is also worth mentioning that although the sample of European Union banks is divided into 6 convergent clusters, the vast majority of banks belong to 3 clusters amounting to 79.6% of the total sample of banks. In relation to Eurozone banks, the same pattern is repeated. We can compare our results with those of Matousek et al. (2015) investigating the efficiency and convergence of the Eurozone and EU15 from 2005–2012, and also applies the methodology of Phillips and Sul (2007). The authors found no evidence of group convergence, and attributed the outcome to the impact of the financial crisis on European banking. However, our findings show the presence of club formation in European banking throughout the period 2013–2018. Therefore, our findings appear to support the view that banking integration has improved since 2012. This finding is in line with many papers which conclude that although European banking is not yet integrated, evidence exists in favor of its improvement, for example, Kösedağ et al. (2011), Bos and Schmiedel (2007), Wild (2016).
As can be shown by the results reported in Table 4, Eurozone banks may be separated into 10 clusters which are convergent and four of those clusters include the majority of banks in our sample (74.1% of the number of banks). Additionally, the results show that there are 10 convergent clusters of US banks, while among these clusters, three include 75.11% of the banks. Furthermore, as concerns the subgroups of banks, we observe that the same pattern is repeated. Our results seem to suggest that, with the exception of the US savings banks, 4 convergent clusters include more than 80% of the sample of each group. Therefore, we reach the conclusion that, although none of the banking systems are convergent, our findings indicate the presence of club formation for all the banking groups and subgroups of our sample.
6. Conclusion
This paper undertakes the task of examining the convergence of efficiency in the Eurozone, European and American banking markets which is of utmost importance as it sheds light on the process of banking integration. For this purpose, we have applied the methodologies of Simar and Wilson (2007) and of Phillips and Sul (2007) in order to calculate the efficiency and the convergence of efficiency for the above-mentioned banking markets, and the subgroups of cooperative, commercial and savings European and United States' banks during the period 2013–2018.
Regarding the evolution of banking efficiency, our findings show that the efficiency of the United States banking system is considerably higher, more than double, than that of the Eurozone and European Union banks. Moreover, throughout the reported period, the efficiency of United States banks increased about 80%, while that of the Eurozone and European Union banks is almost steady, fluctuating between 8 and 11%. Finally, we notice that the efficiency of the European Union banking group is slightly increased, when compared to that of Eurozone banks.
Concerning the subgroups of banks (cooperative, commercial and savings banks), we observe the same pattern as the efficiency of all the Eurozone banking sectors is considerably lower than that of the United States. Our results also provide evidence that the efficiency of cooperative banks is the highest reported in both Eurozone and United Stated banking and that the efficiency of commercial banks is the lowest reported.
We also test for bank convergence in order to verify or reject the four hypotheses, related to integration, that were posed in our paper. The first hypothesis examines whether the European, Eurozone and United States banking systems are integrated. Our findings suggest that there is no evidence of convergence across these banking sectors, when considering all banks. Therefore, European, Eurozone as well as United States banking systems are not yet integrated and thus, we reject the first hypothesis.
The second hypothesis aims at testing whether an advanced level of financial integration is associated with higher convergence of efficiency in banking. For this purpose, this paper examines whether banking integration among Eurozone countries has developed more than that of European countries. We compare the results of the above mentioned convergence analysis of European and Eurozone banking and also the speed of convergence. We find that the indicator of convergence and the speed of convergence of Eurozone banks are slightly higher than that of European Union banks. However, the difference is so minimal that it cannot help us to draw any valid conclusions nor reject or confirm the second hypothesis.
Furthermore, our third hypothesis is associated with the control of bank-specific barriers hampering European integration, and examines whether the integration of commercial, cooperative and savings Eurozone and United States banks is greater than the integration of the total sample of banks. Our findings suggest that the integration of savings and cooperative banks is less developed than that of the total sample of banks, as the indicator of convergence and the speed of convergence of Eurozone banks are higher than those reported for the banking subgroups. However, both the commercial Eurozone and United States banks are closer to convergence than the total sample of banks. Thus, the third hypothesis can be confirmed only for the commercial banks of our sample.
Additionally, we tried to determine whether the samples of the United States banks and the subgroups of commercial, cooperative and savings banks are more integrated than those of the Eurozone banks. Our results indicate that the United States banks, apart from cooperative banks, are more integrated than the total sample of Eurozone banks throughout the reported period. Therefore, the forth hypothesis is confirmed.
Overall, our main findings convey that the efficiency of the United States banking system is considerably higher than that of the Eurozone and the European Union. Moreover, there is no evidence of convergence across the reported banking groups. However, our analysis shows that United States banks are closer to convergence than Eurozone and European Union banks, while the speed of convergence of the Eurozone and European Union banks is higher than that of the rest of the banking groups. Interestingly, our findings also indicate the presence of club convergence in all the reported groups and, with the exception of US savings banks, four convergent clusters comprise more than 74% of the banks of each group. We also come to the conclusion that, although the US banking system is closer to convergence than Eurozone and European Union banks, this outcome could possibly change in the future as the Eurozone and the European Union's speed of convergence is higher.
This paper provides considerable implications for both regulators and bank managers. Initially, our empirical evidence reveals great discrepancies of the levels of efficiency among different banking sectors and banking systems. Therefore, managers and regulators should consider the banking sector and the location of the banking institutions when implementing policies or regulations affecting banking efficiency. Moreover, our results indicate that there is no evidence of integration across the banking groups of the European Union, the Eurozone and the US Thus, the country unions do not benefit from banking integration and it is highly recommended that regulators and supervisors take decisive steps on promoting banking integration. Additionally, the existence of convergent clusters in our sample could indicate the need for a more individualistic approach. More specifically, bank managers and regulators could cooperate and examine the individual banks that do not belong into any convergent cluster and the differences of characteristics among the convergent clusters. Afterwards, they could implement individual reforms to each bank or each cluster of banks in order to foster integration.
Finally, one limitation of our analysis is the small reported period (2013–2018). Thus, our analysis could lead to further research into the evolution of efficiency and integration of Eurozone, European Union and United States banking systems, by employing a sample covering more years after the global financial crisis. Another limitation of this paper is that it does not incorporate into the D.E.A. any measurement of the ratio of non-performing loans. Considering the significant differences among the ratios of non-performing loans of the European Union, the Eurozone and the United States banks, the employment of those ratios in future research could also provide interesting results. Similarly, future research could also use capital buffer or contingent capital as indicators of capital ratio. Moreover, this paper could instigate further research into whether the recent increase in banking efficiency and the improvement of the banking integration process will have an impact on economic growth.
Notes
Τhe definition of an integrated financial market is: “The market for a given set of financial instruments and/or services is fully integrated if all potential market participants with the same relevant characteristics: (1) Face single set of rules when they decide to deal with those financial instruments and/or services (2) Have equal access to the above-mentioned set of financial instruments and/or services 3. Are treated equally when they are active in the market” (Baele et al., 2004).
Τhe most decisive steps towards the economic and financial integration of European banking are:
The European Commission's White Paper (1986)
The Single European Act (1986)
The Liberalization of capital flows (1988)
The Second Banking Directive (1999)
The establishment of Single Currency (1999)
Financial Services Action Plan implemented (2005)
The software used is the Stata Statistical Software, and the model which is introduced by Du. K., includes 5 commands in order to apply the above mentioned methodology.
We apply the methodology of Simar and Wilson (2007) by using “rDEA” package version 4.47 in R software developed by Simm and Besstremyannaya (2016).
To apply Phillips and Sul (2007) methodology, Stata statistical software is used and more specifically, the model introduced by Du, K.
Austria, Belgium, Cyprus, Germany, Estonia, Spain, France, Greece, Ireland, Italy, Lithuania, Luxembourg, Latvia, Malta, Netherlands, Portugal, Slovenia, Slovakia.
Bulgaria, Czech Republic, Denmark, Finland, United Kingdom, Croatia, Hungary, Poland, Romania, Sweden
The purpose of this plan was threefold. It aimed at the creation of the single market for financial services and products, the creation of a single financial retail market and the implementation of common rules and supervision. According to the European Commission 98% of the measures of FSAP were implemented in 2005.
